


Introduction
It is known that, during exercise, the anaerobic threshold (AT) is the level of exertion where your body must switch from aerobic metabolism to anaerobic metabolism. The AT is also defined as the VO2 above which the lactate/pyruvate ratio increases1. In the field of sports and physical activity, this threshold is used to analyze physical fitness and to provide a criterion for setting training workloads. One of the most frequently used methods for determining AT is the analysis of gas exchange variables, which establishes both the ventilatory aerobic and anaerobic thresholds (VT1, ventilatory threshold 1, and VT2, ventilatory threshold 2, respectively)2. However, this requires sophisticated and expensive equipment which is not always available to sports technicians.
An alternative methodology involves measuring heart rate (HR), whether it is by measuring the absolute response of the HR in beats/ min3-5, or by analyzing HR variability (HRV)6-19.
A number of different mathematical approaches have been employed for HRV analysis and its application in determining thresholds. One of the most frequently utilized is fast Fourier transform (FFT), which sorts HR into a series of bandwidths: low-frequency (LF) (< 0.15 Hz), high-frequency (HF) (0.15-0.4 Hz) and very high-frequency (VHF) (> 0.4 Hz). The LF band is under sympathetic and vagal cardiovascular control, while the HF and VHF bands are related to sinorespiratory arrhythmia, and are, therefore, under vagal control. However, FFT might not be the most appropriate method since it is relatively simple only for the analysis of stationary signals.
One of the shortcomings of the Fourier transform is that it does not offer any information about the time at which a given frequency component occurs. This is not a problem for stationary signals, signals whose frequency content does not change with time, but does leave room for improvement when non-stationary signals are involved. In order to solve this problem, short time Fourier transform (STFT) has been suggested. In this method, the non-stationary signal is divided into small portions, which are assumed to be individually stationary. For this purpose, a window function of a given width is selected, this window function is shifted during the signal, and in each case, the Fourier transform is then applied to each of these portions. Thus, it becomes necessary that an agreement with regards to window size be made. It is known that STFT may fail if the signal contains both slowly changing components and rapidly changing transient events. Moreover, in the case of non-stationary signals, it is necessary to select sufficiently short windows. This improves temporal resolution but produces deterioration in frequency resolution.
In order to overcome the problem of non-stationarity, a number of solutions, known as time-frequency analysis, have been proposed. One of the most known of these is the "Wigner-Ville Distribution"20, which is functionally similar to a spectrogram but offers better temporal and frequency resolution.
Another method is that known as time-scale or "wavelet" transform analysis (WTA). This methodology is relatively recent and is gradually becoming widely used in the study of non-stationary biological signals such as HRV. WTA utilizes short windows at high frequencies and long windows at low frequencies and can be successfully applied to non-stationary signals for analysis and processing. The underlying concept of WTA is to analyze according to scale; for such purpose base functions known as "mother wavelets" of finite energy and duration are used. They retain their form at different scales (via dilatation or compression of the base signal). In such way, the wavelet transform coefficients are obtained when shifting the base function by an extremely small amount in time for each scale factor. The scalogram (wavelet transform plot) of the continuous wavelet transform (CWT) obtained in this way is a function of two variables, [X(a,b)]2, whereb is the translation factor and a the scale factor, and is represented on a two-dimensional plane. The scalogram contains information about the temporal localization of "events", but is dependent on the base function selected for the analysis. For the best-known wavelet functions, it is quite straightforward to relate the scale at which a signal is evaluated to the frequency. Another advantage of WTA is the existence of a distinct version known as discrete wavelet transformation (DWT), which enables a signal to be decomposed into a set of mutually orthogonal signals in such way that each one of these covers a particular region of the total frequency spectrum. Among other things, this model allows us to eliminate parts of a signal (detrending, denoising, etc.) very easily, while leaving us in good control of the frequency component that has been eliminated. Generally speaking, WTA also produces good results in terms of the clarity and discrimination of patterns.
Another problem with this type of methods is what is known as the "uncertainty principle" which, in short, states that the more accurate the temporal localization of a given pattern is, the less well defined its frequency will be, and vice versa; i.e. improved accuracy of frequency definition has a negative effect on time measurement. In the case of CWT, this situation can be dealt with by a suitable choice of base function, both in order to reach a good compromise between time and frequency and to fix the value of one of these two parameters. A single base function, such as the Morlet wavelet function, thus depends on a parameter that we can operate on, and that defines its angular frequency. In any case, the choice must always be made prior to the analysis.
Thus, the main objective of this paper was to demonstrate that WTA is also capable of providing good results when we need to obtain information regarding the measurement of thresholds, using HRV as the study parameter and for which good, and easily utilizable software packages are available. To this end, on the basis of an HRV signal obtained via an incremental test, and using WTA, we attempt to identify the first and second thresholds and compare them with those obtained from ventilatory parameters obtained through the use of traditional methods.
Methods
Subjects
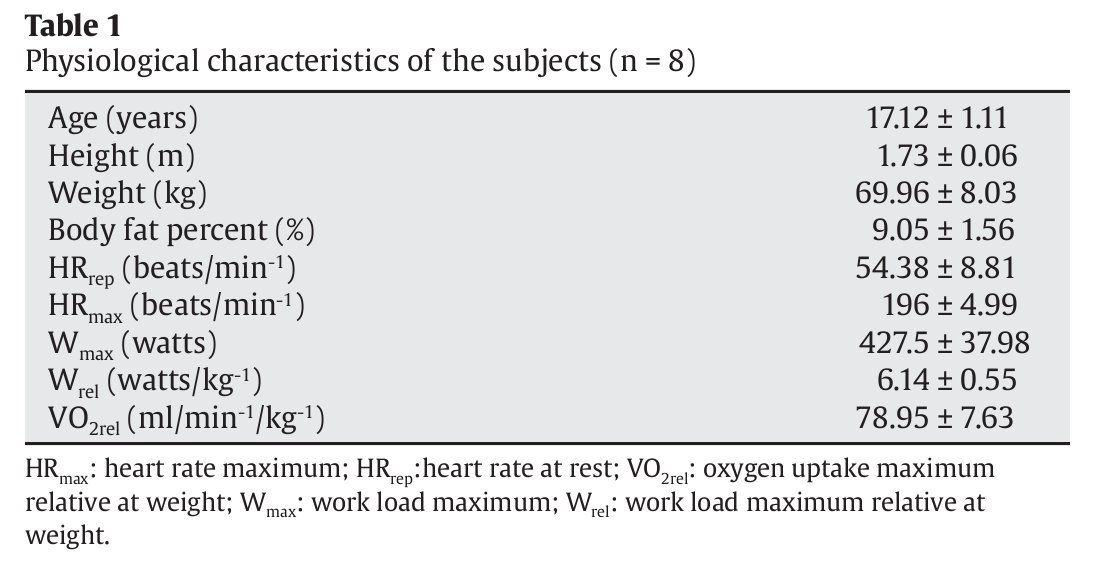
The study subjects were 8 healthy, male, high-performance cyclists (descriptive anthropometric and physiological characteristics for the sample are shown in table 1), all of whom were familiar with cycloergometer tests. The subjects were informed of the nature of the study, which adhered to the ethical guidelines of the Declaration of Helsinki, and all gave their written informed consent to be included. The study protocol was approved by the Ethics Committee of the University of Las Palmas de Gran Canaria. Height and weight were measured before each test. Six skinfold measurements were taken (triceps, subscapular, suprailiac, abdominal, thigh and calf) and the Yuhasz formula was used to determine percentage body fat21.

Experimental design
In this cross-sectional study the exercise tests were performed using a cycloergometer with an electromagnetic braking system (Jaeger ER800, Erich Jaeger, Germany). Before starting the incremental load test the subjects spent 2 min at rest on the cycloergometer to determine baseline values. After a warm-up period of 10 min (5 min at 50 W and 5 min at 100 W), all subjects pedaled at between 80-90 rpm with load increases of 5 W every 12 s (25 W/min-1) until exhaustion. All tests were performed at a room temperature of 21 °-24 °C and a relative humidity of 44-55%.
Data acquisition
The subjects breathed normal air through a low resistance valve using a mask of known dead volume. The composition and volume of the expired air was determined using a Jaeger Oxicon Pro analyzer (Erich Jaeger, Germany); this adheres to the standards of the American Thoracic Society and the European Communities Chemistry Society. Gaseous exchange data were processed breath by breath using LabManager v. 4.53 software (Erich Jaeger, Germany). Prior to each test, the equipment was calibrated using a gas of composition 16% O2, 5% CO2 and 79% N2. HR was monitored beat by beat using a Polar S810i RR cardiotachometer (Polar Electro, Oy, Finland) and a Jaeger ECG surface electrocardiograph (Viasys Healthcare, Erich Jaeger, Germany). The cardiotachometric recording of the HR is a validated method22. The cardiac data were processed using Polar Precision Performance SW software v. 3.00 (Polar Electro, Oy, Finland).
Data analysis
The cardiac signal was examined by analyzing the intervals between each beat; this provided the HRV. It is well known that, during incremental load tests, the HRV decreases with increasing workload. A DWT, with a Daubechies (Db8) type base function23, was initially used to eliminate the trend of the signal over time. A linear interpolation was then applied to the remaining signal in order to obtain a uniformly sampling.Finally, the digital RR signal was subjected to CWT using a Morlet type base function24 with ω= 20, which provided good quality frequency resolution. Figure 1 shows the spectrogram using a contour line diagram, in which we can see the changes in the frequency of HRV as the exercise progresses.
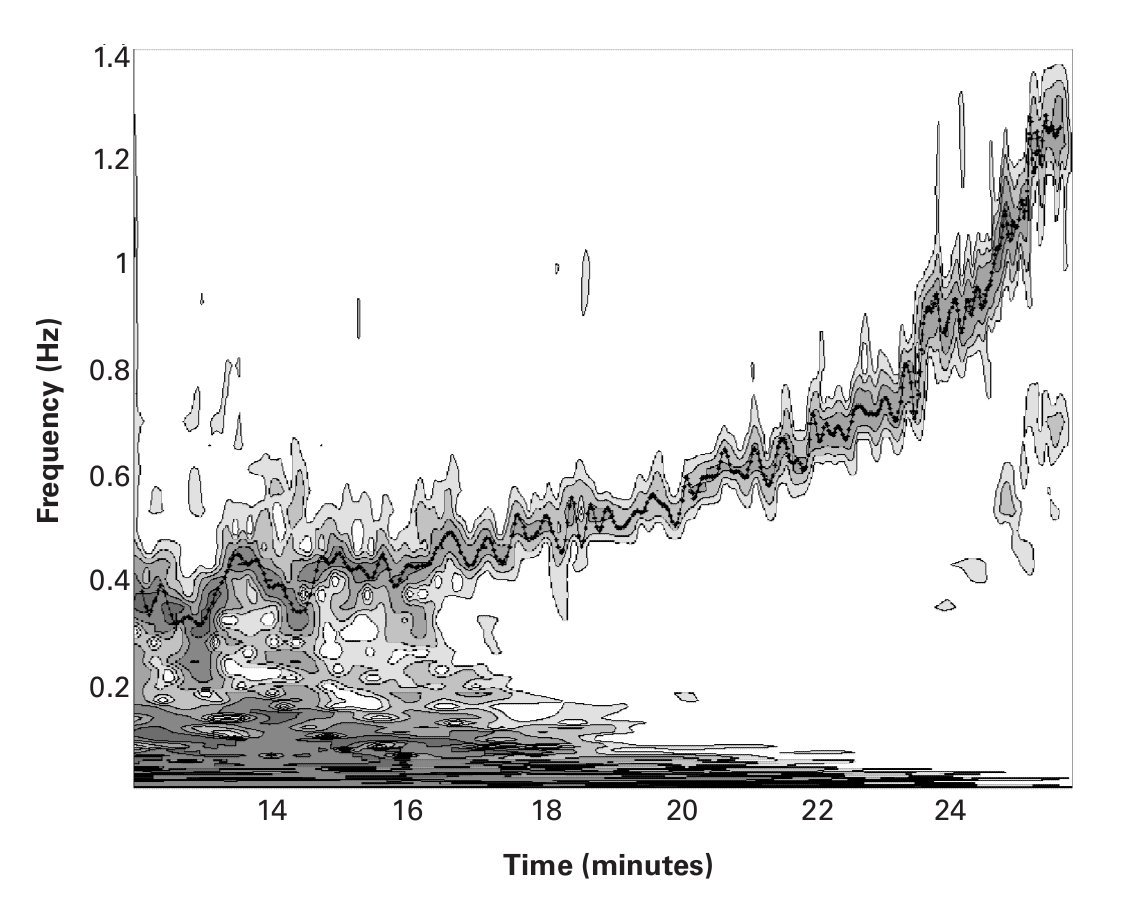
Fig. 1. Contours of the wavelet coefficients of the heart rate variability, showing the changes in the frequency components with time, obtained using a Morlet base function where ω = 20. The x-axis represents time in minutes, with frequency in Hz on the y-axis. Coefficients below a certain value have been eliminated in order to improve the readability of the spectrogram. The line of points show respiratory frequency values in Hz.
In order to validate both the chosen interpolation and the resulting spectrogram, we have superimposed, in figure 1, the breathing frequency (Bf) in Hz, which was obtained from the gas analyzer. It can be observed how Bf and the peaks of the HF-VHF band of the HRV signal become synchronized during the course of the exercises. The analysis was performed using Matlab software (Mathworks Inc., Natick, MA, USA).
Identification of the aerobic-anaerobic transition phase via the analysis of gas exchange variables
Gas exchange data were analyzed using the visual identification method of Wasserman25. This method relates VE/VCO2 (ventilatory equivalent CO2), VE/VO2 (ventilatory equivalent O2), PETCO2 (end-tidal partial pressure CO2), and PETO2 (end-tidal partial pressure O2) to the load in order to detect the aerobic-anaerobic transition phase26,27. The combination of several methods, however, is more reliable for the determination of VT1 and VT2; thus, the procedure described by Gaskill et al was followed2. Three independent, blinded observers determined these thresholds (fig. 2, upper right and lower left and right).
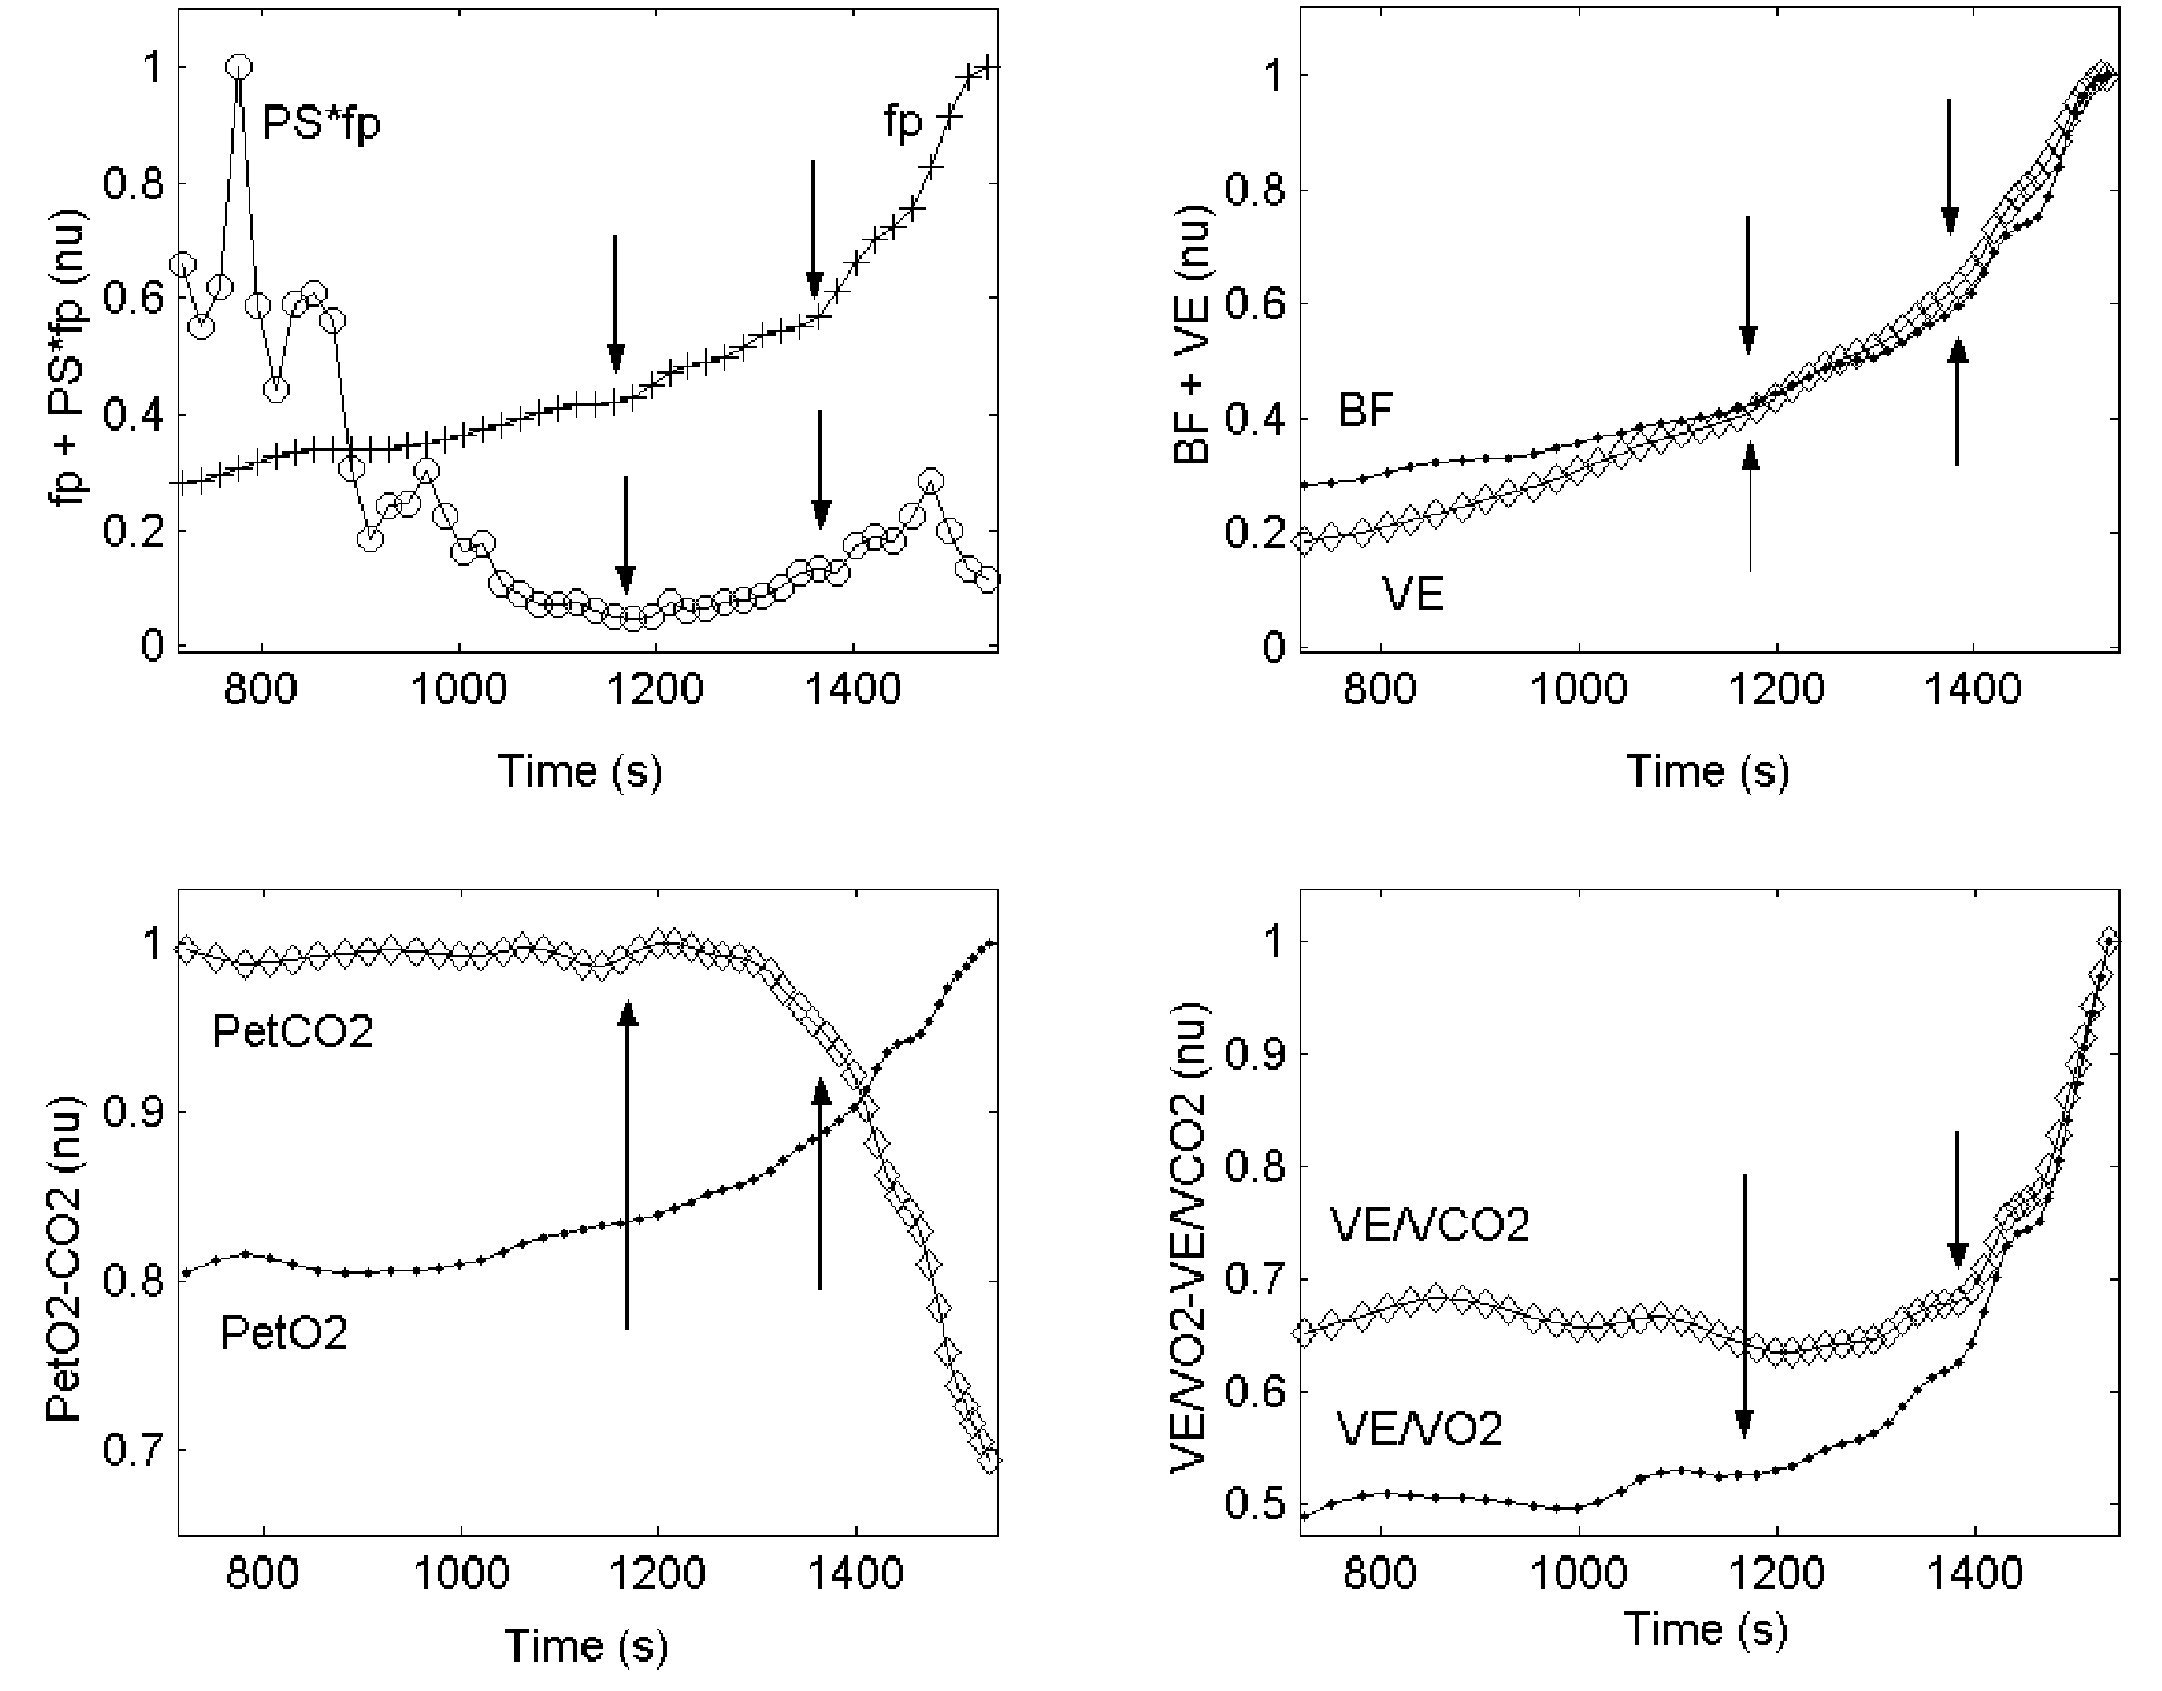
Fig. 2. Upper left: graph showing the behavior of fp and PS·fp against time during the incremental load test. Upper right: graph showing the kinetics of Bf and VE (see abbreviations) against time. Lower left: graph showing the kinetics of PETO2 and PETCO2. Lower right: graph showing the kinetics of VE/VO2 and VE/VCO2 (see abbreviations) against time. The values of all variables were normalized; the last three graphs show VT1 and VT2.
Identification of the aerobic-anaerobic transition by wavelet analysis of the heart rate variability
This procedure required the calculation of:
1) The evolution of frequency peaks of the HRV HF-VHF band (fp). The values of fp were obtained from the spectrogram, taking the value of the frequency that corresponds to the local maximum value of the wavelet coefficients (equivalent to the maximum spectral density) in the HF-VHF band at any time during the test. The aerobic and anaerobic thresholds were determined on the basis of the changes in the values of fp in the test. The aerobic threshold, (fpT1), was taken as the first inflexion of the kinetics of the fp slope, and the anaerobic threshold, (fpT2), as the second inflexion (fig. 2 upper left).
2) The evolution of the product of the HF-VHF spectral energy value by fp (PS·fp). PS·fp was found useful by Cottin et al17,19 for identifying these thresholds. This variable decreased with load until reaching a minimum value (fig. 2 upper left), i.e., the first inflexion point representing the aerobic threshold (PS·fpT1); it then remained stable until it started to show a moderate increase, i.e., the second inflexion point representing the anaerobic threshold (PS·fpT2).
Statistical analysis
The paired Student's t-test was used to compare the values for the aerobic and anaerobic thresholds determined by the analysis of gas exchange variables and the wavelet transformation of HVR. Pearson product moment correlation was used to evaluate the association between gas analyzer procedures and HRV methods. The significance level was set at p < 0.05. The degree of agreement between the two methods was determined using Bland-Altman plots28.
Results
Table 1 shows the anthropometric and baseline characteristics (mean ± standard deviation [SD]) of the study subjects and the values of their physiological variables. It is clear that the subjects, in spite of their youth, displayed a morpho-functional profile close to that of an experienced cyclist of the senior category.
Figure 1 shows the wavelet coefficients of the HRV of one of the subjects, in which we can observe a typical behavior of an incremental test. The figure shows the changes in the frequency components with time. The x-axis represents time in minutes, while the y-axis represents frequency in Hz. Coefficients below a certain value have been eliminated in order to improve the readability of the spectrogram. The dotted line superimposed on the frequency of the HF-VHF band represents values of Bf (in Hz) obtained from the gas analyzer. It should be noted that the two signals are synchronized, which may be taken as an indicator of the adequacy of the wavelet transform method.
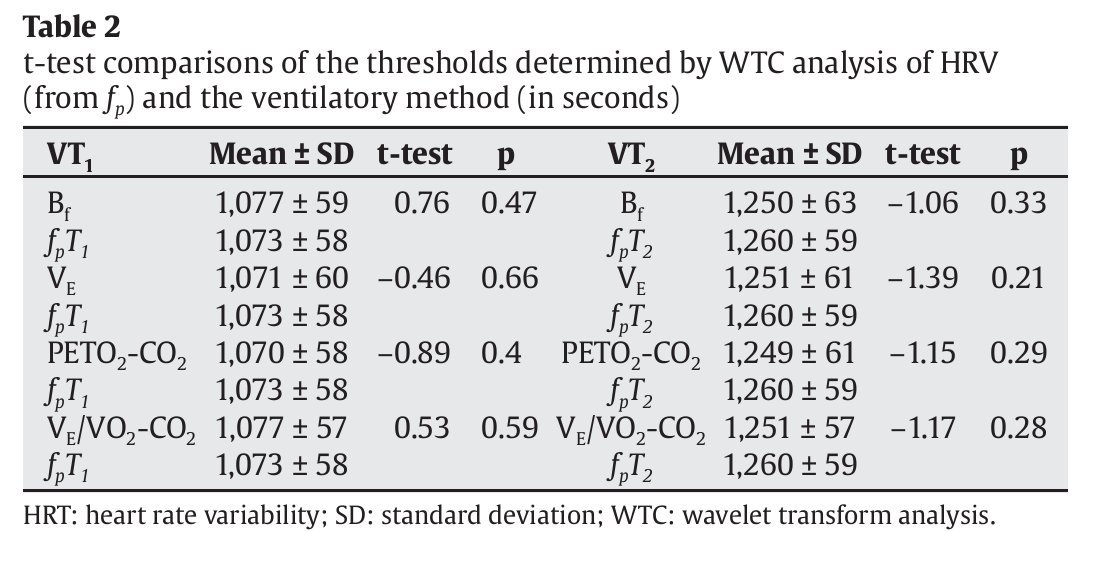
Table 2 compares the values of the aerobic and anaerobic thresholds obtained using the different gaseous exchange variables (Bf, ventilatory flow [VE], PETO2 and PETCO2, VE/VO2 and VE/VCO2) and those obtained using fp. No significant differences were found between the results for VT1 and fpT1 or VT2 and fpT2. Table 3 compares the threshold values (in seconds) obtained using the same gas exchange variables and those obtained using PS·fp. No significant differences were found between the results for VT1 and PSfpT1 or VT2 and PSfpT2.

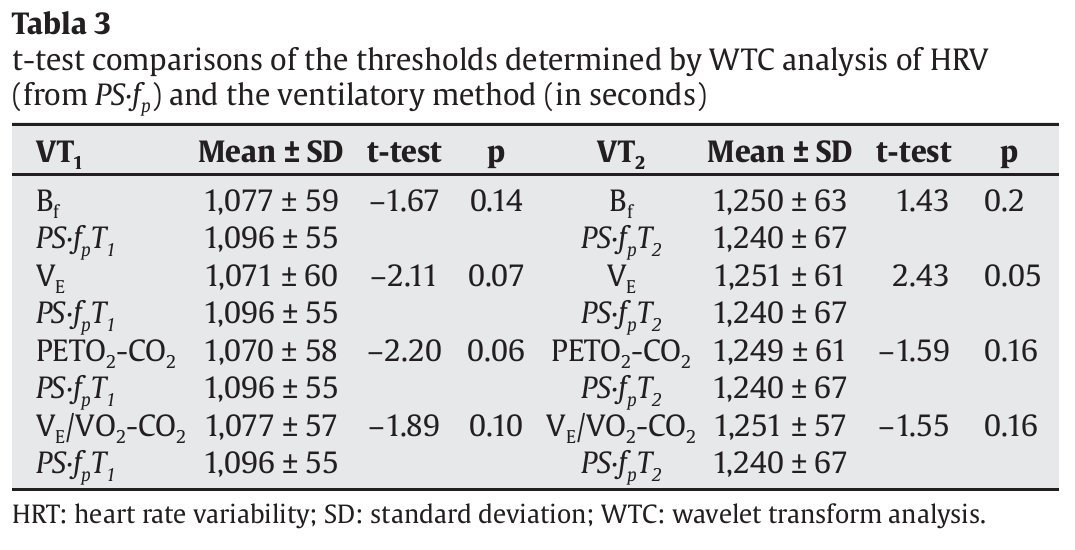
Figure 2 shows the behavior of fp and PS·fp and several gas exchange variables against time during the incremental load test, as well as changes in the ventilatory parameters used for threshold determinations (Bf, VE, PETO2 and PETCO2, VE/VO2 and VE/VCO2). The points at which VT1 and VT2 were found are shown by arrows.
Figure 3 shows the Bland-Altman plots for the analysis of agreement between VT1 and fpT1, and VT2 and fpT2; the mean differences were 5.9 and 10.2 W, respectively. The agreement for the first threshold was thus slightly better than for the second.
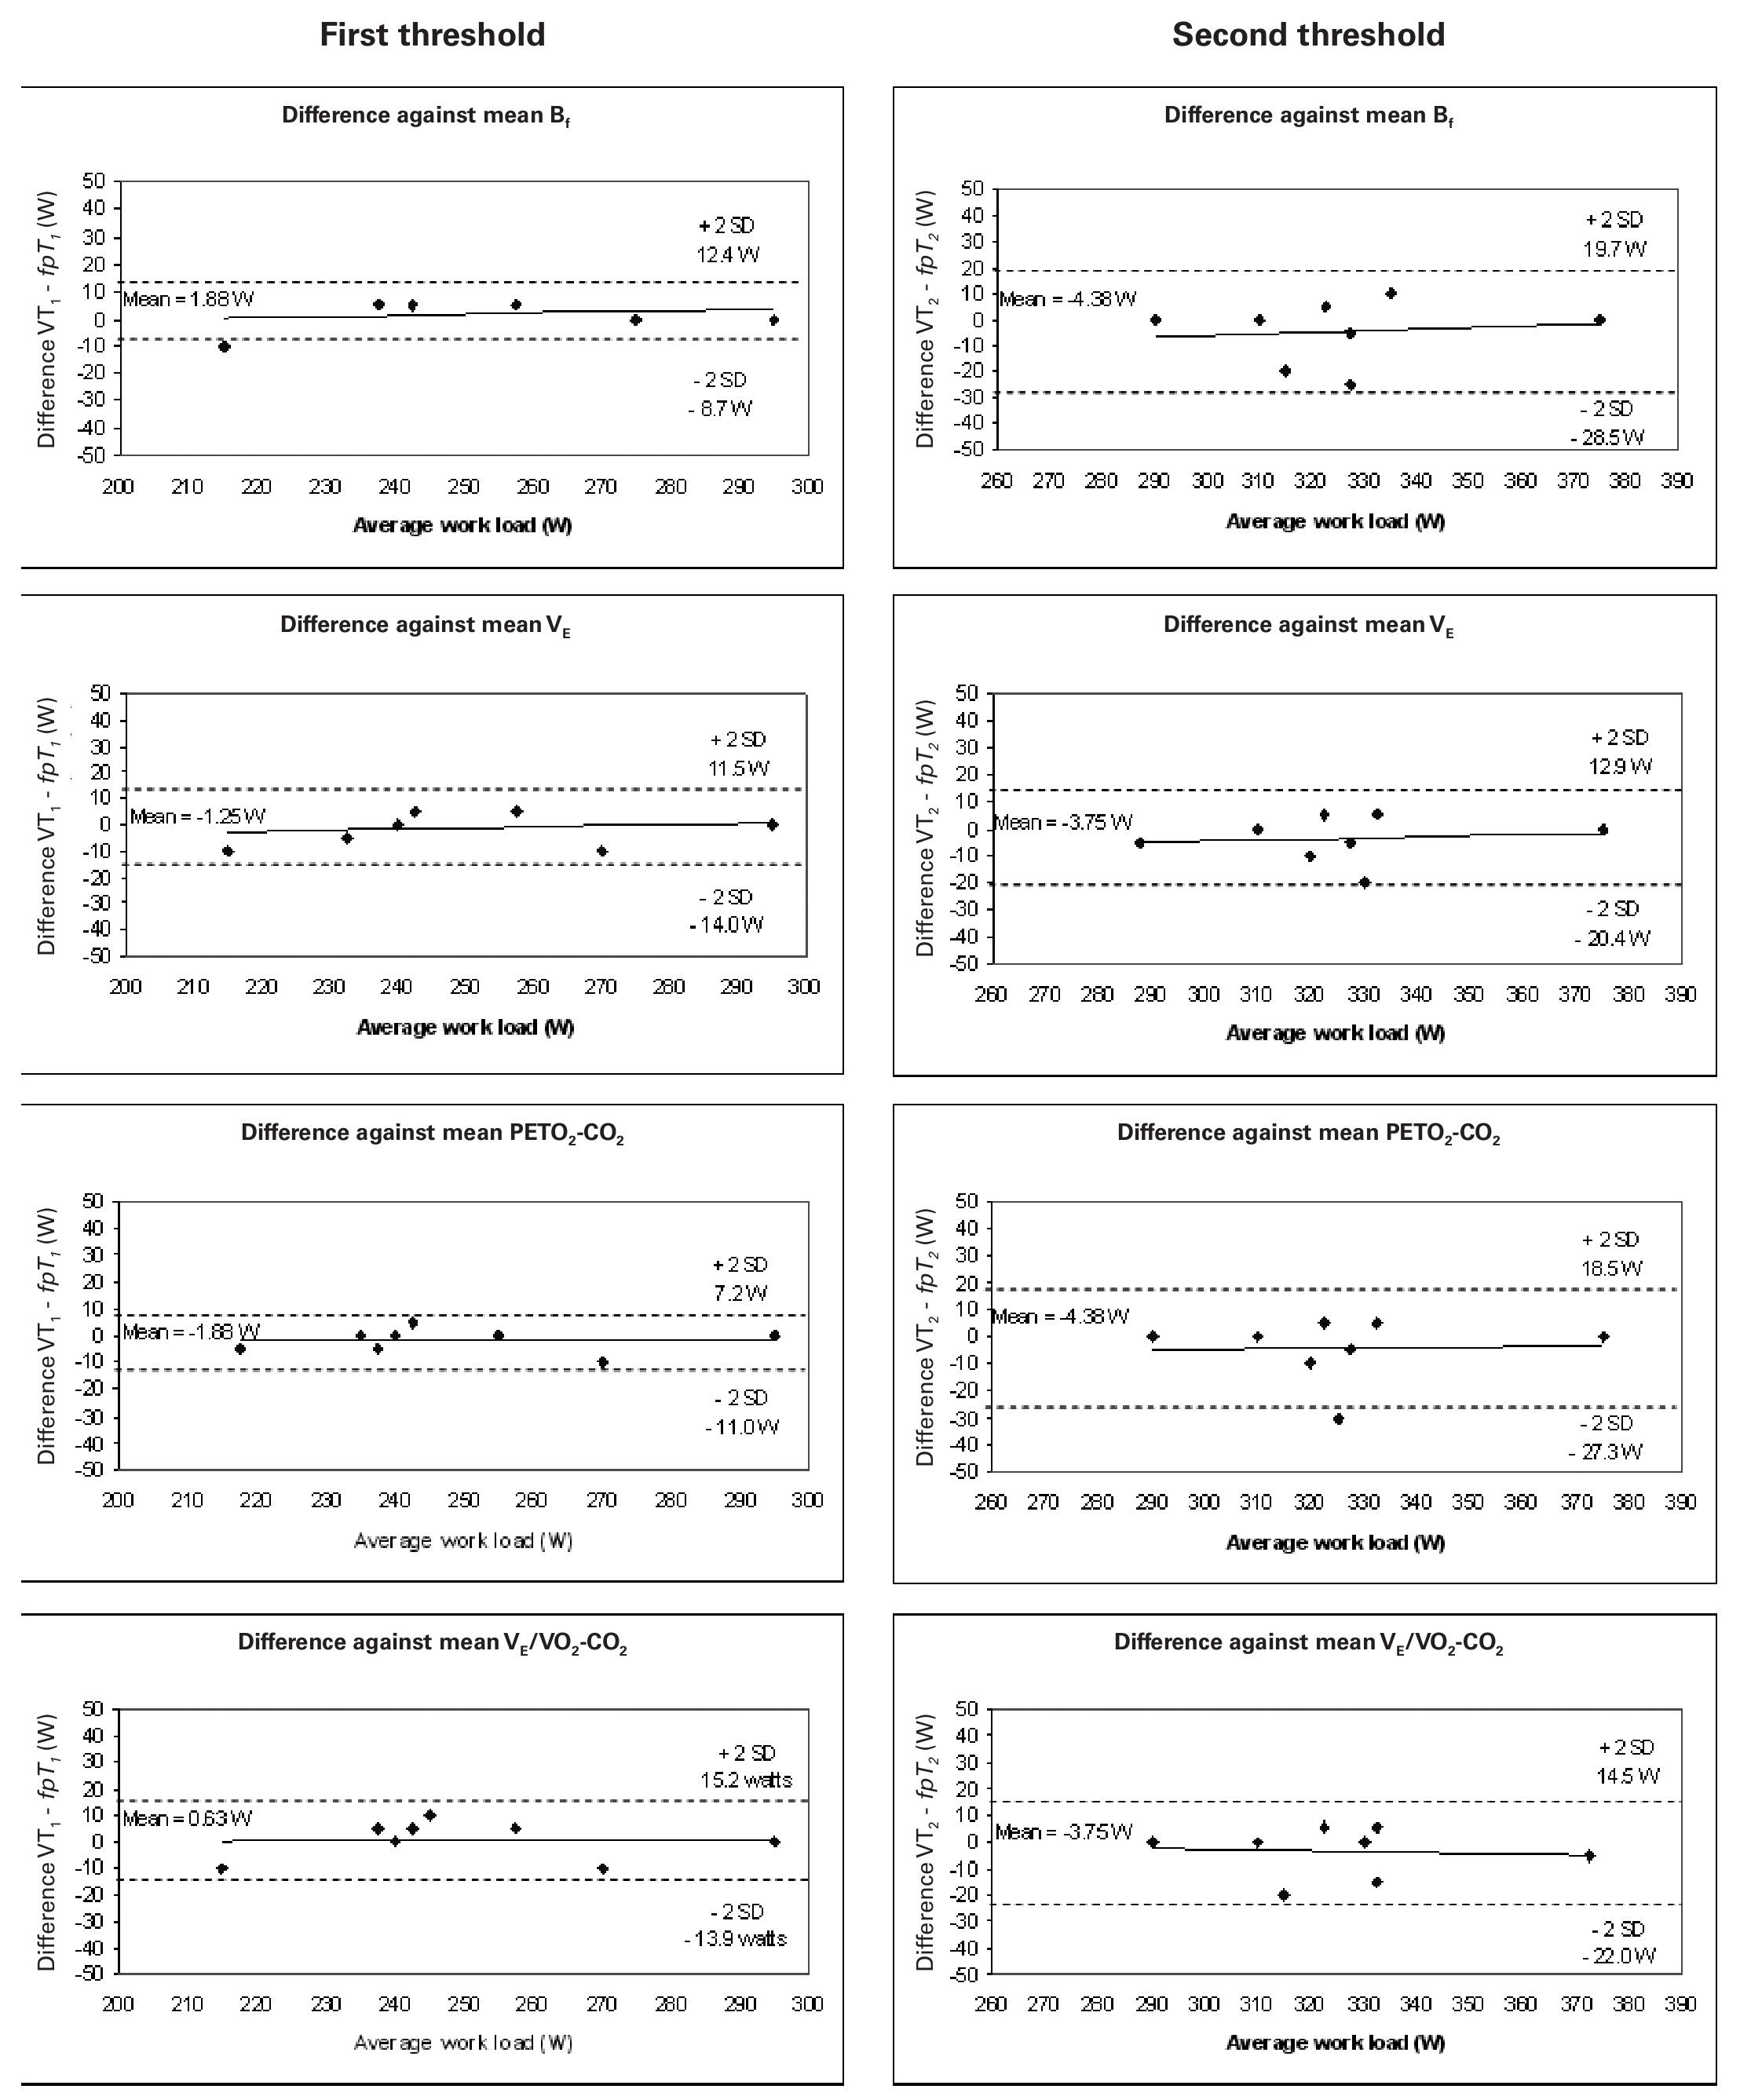
Fig. 3. Bland-Altman plots: differences between the mean threshold results determined using fpand the ventilatory method plotted against the average threshold work load (W). Left: aerobic threshold determined using fp compared with that detected using Bf, VE, PETO2-CO2 and VE/VO2-CO2 (from above to below). Right: anaerobic threshold determined using fp compared with that determined using Bf, VE, PETO2-CO2 and VE/VO2-CO2 (form above to below). Each graph shows the means of the differences and the upper and lower limits of agreement (mean difference ± twice the standard deviation [SD]).
Figure 4 shows the same results for PS·fp; the mean differences between VT1 and PS·fpT1, and VT2 and PS·fpT2, were 13.1 and 6.4 W respectively. The agreements for both thresholds were within acceptable limits, with that for the second threshold slightly better than for the first.
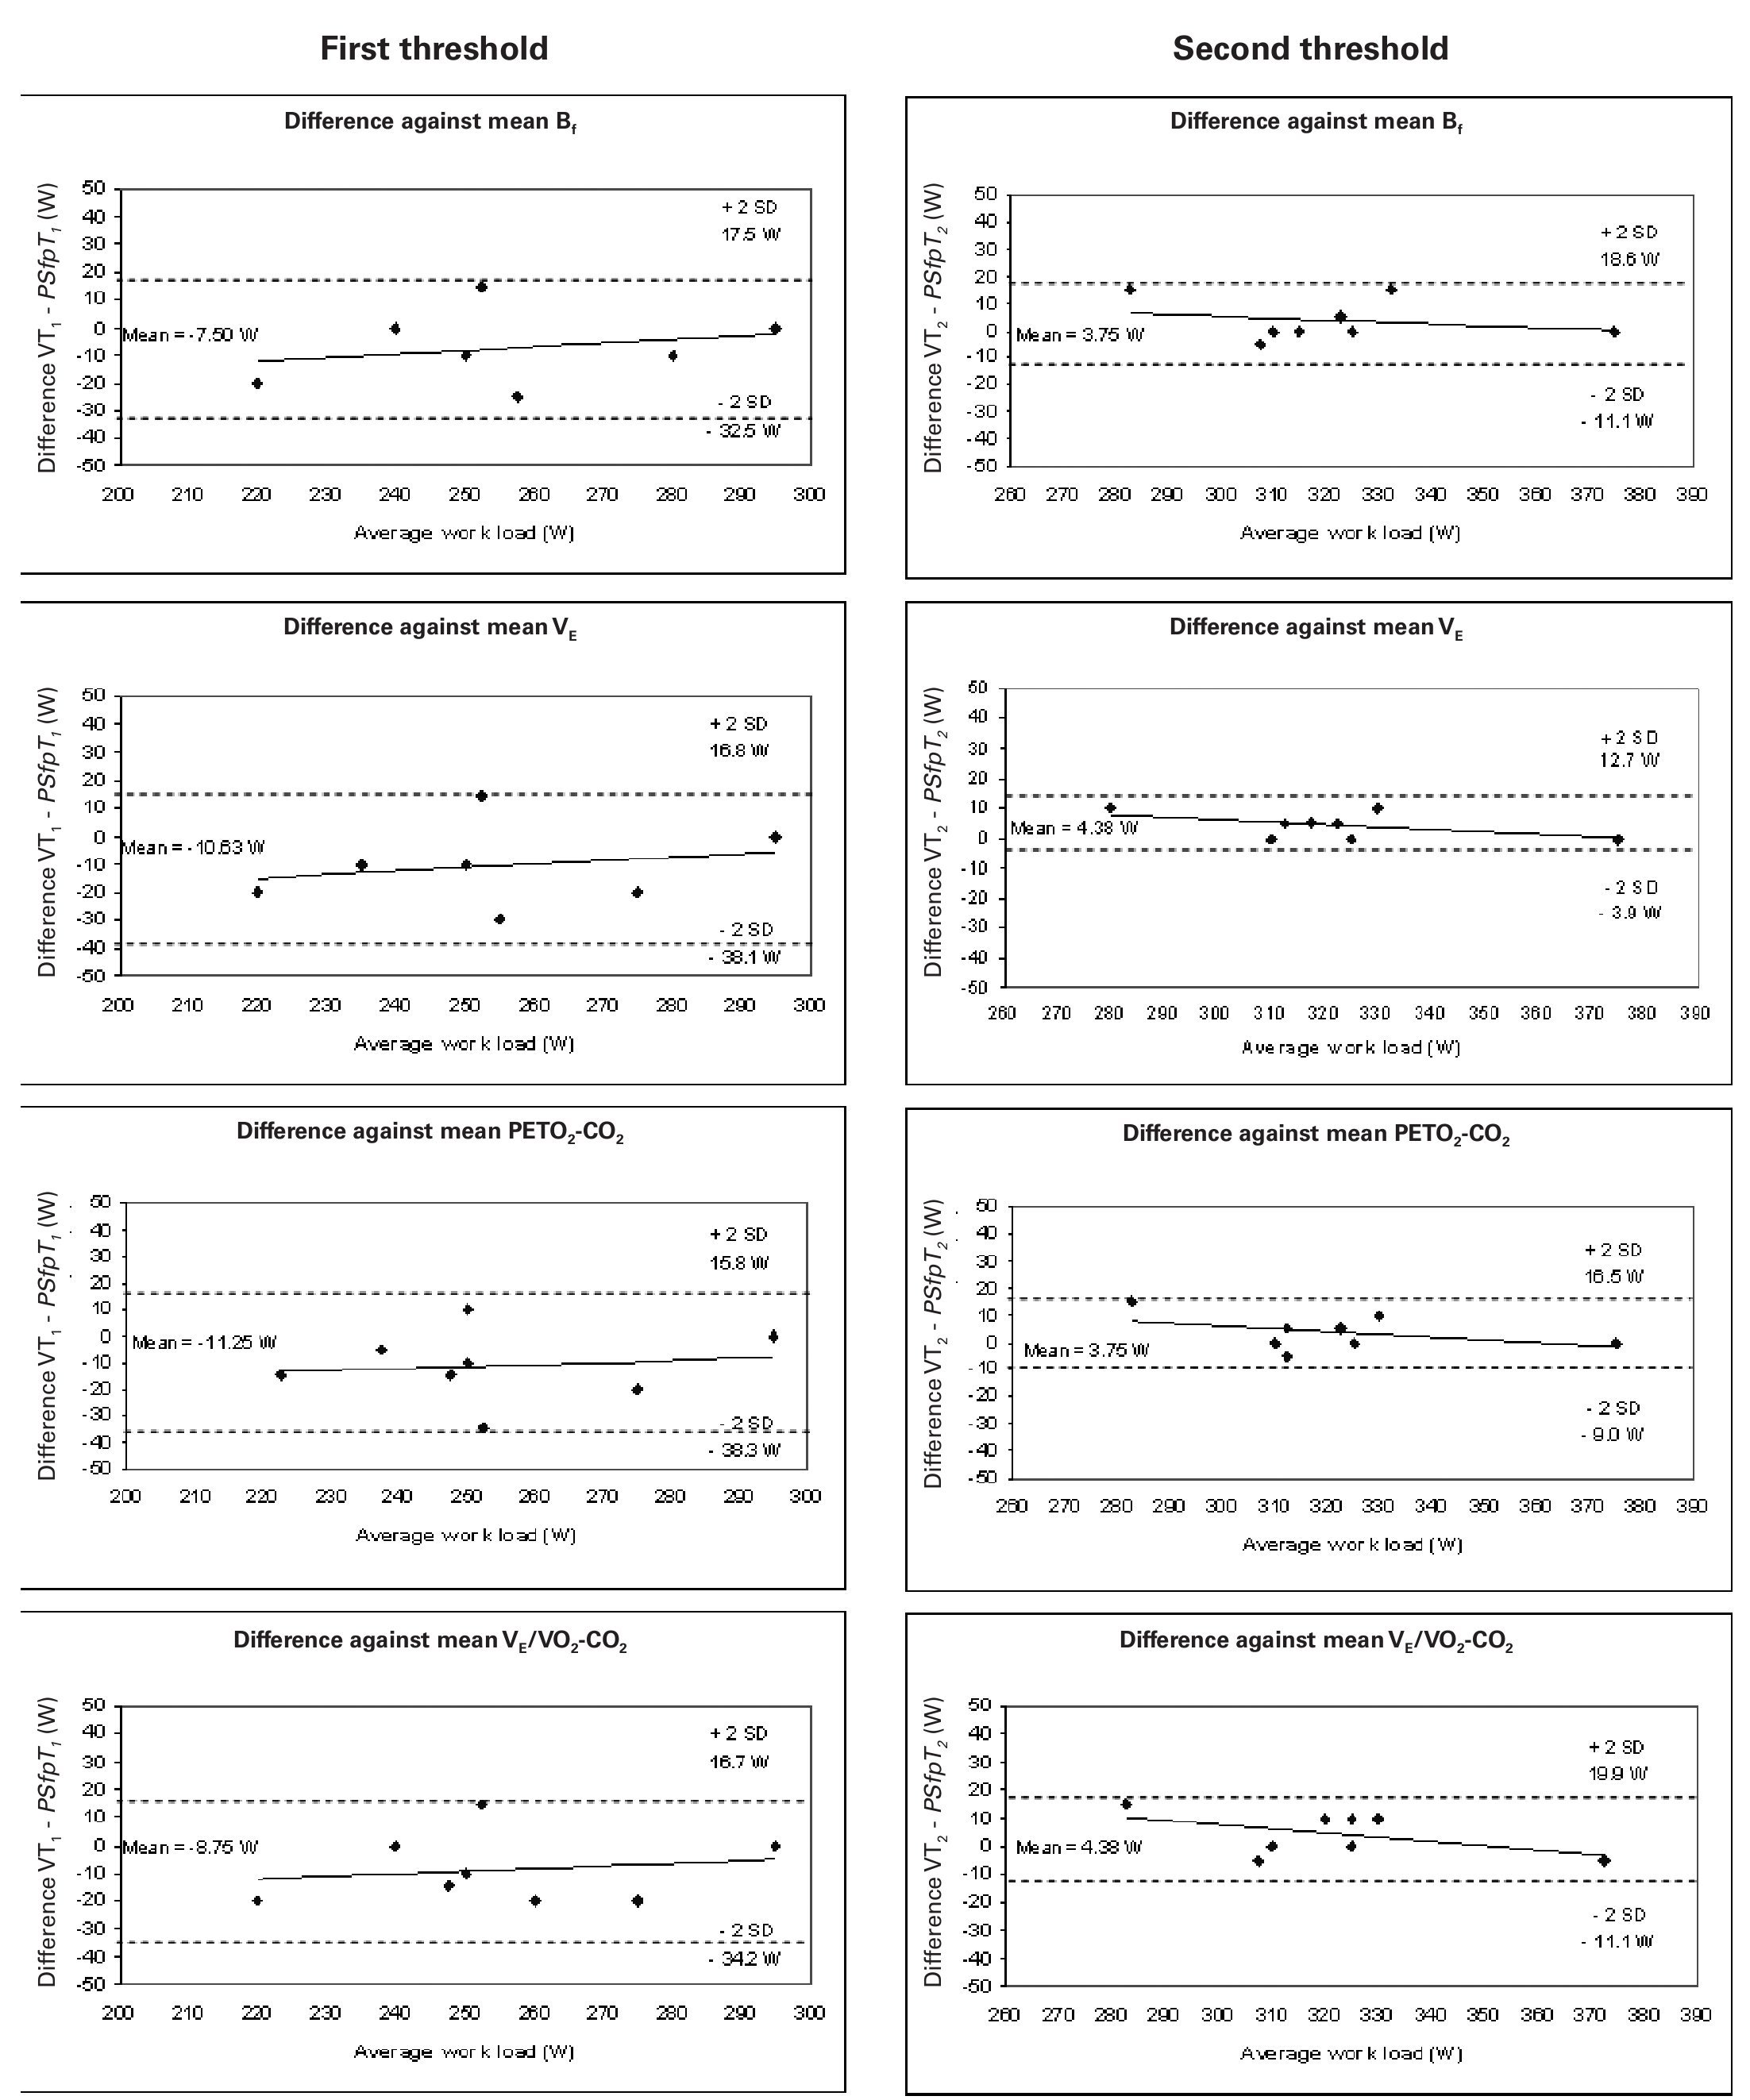
Fig. 4. Bland-Altman plots: differences between the mean threshold results determined by PS·fp and the ventilatory methods plotted against the average threshold work load (W). Left: aerobic threshold determined using PS·fp compared with that detected using Bf, VE, PETO2-CO2 and VE/VO2-CO2 (from above to below). Right: anaerobic threshold determined using PS·fp compared with that determined using Bf, VE, PETO2-CO2 and VE/VO2-CO2 (from above to below). Each graph shows the means of the differences and the upper and lower limits of agreement (mean difference ± twice the standard deviation [SD]).
Discussion
The present results show that there are no significant differences between the aerobic and anaerobic thresholds identified using either gaseous exchange variables or the WTC of HRV. The behavior of the HF-VHF band, in terms of both its spectral power and peaks, when these are measured by means of WTA, is therefore a good tool for detecting the aerobic-anaerobic transition phase and its thresholds. In agreement with other authors17,19,29, the validity of using the HRV as an inexpensive, non-invasive method for determining these thresholds is confirmed.
The results show the close coordination between breathing and heart rhythm (sinorespiratory arrhythmia). VT2 correlates well with the anaerobic threshold determined by measuring the blood lactate concentration26. However, several authors have questioned whether ventilatory thresholds reflect what happens at the blood or muscle level27,30,31.
What is beyond doubt, however, is the practical nature of non-invasive procedures, and the need for studies to demonstrate their validity17,19.
With regards to the load, PS·fp behaves in a similar manner to that of the raw value of the spectral power measured by means of CWT in the HF-VHF band, although it accentuates the points of inflexion of this signal. In exercise-until-exhaustion tests, the spectral power decreases with the load until it reaches a minimum when the load is approximately 60% of its maximum value32,33. After this point, the HF-VHF power spectrum shows moderate increments, marking the anaerobic threshold9,17,19.
As Bf and VE, fp showed a increase with three inflexions points. It should be remembered that fp is related to changes in baroreflex activity induced by mechanical respiratory effects29,34.
No significant differences were found between the means of the thresholds determined by HRV analysis (involving the variables fp andPS·fp) and VT1 and VT2 determined using Bf, VE, PETO2-CO2 or VE/ VO2-VCO2. The results display a high correlation between the two HRV methods proposed and the gas analysis methods. The differences between the two methods are not statistically significant at the p < 0.05 level.
According to our results, when comparing thresholds obtained from fp to those from are compared with the ventilation-based methods, the agreement is closer for the first threshold (aerobic) than for the second (anaerobic). The method proposed here (fp) tends to delay the second threshold (fig. 3). The SD of the differences in the first threshold was 5.9 W, while for the second threshold it rose to 10.27 W. The mean differences for the first threshold ranged from 0.63 to 1.88 W, while for the second threshold the range was 3.75 to 4.38 W.
However, when the results produced by the PS·fp method are compared to those of the ventilation-based methods, there is a closer agreement for the second than for the first threshold. In this case, the results indicate that the proposed method tends to delay the first threshold (fig. 4). The SD of the differences in the first threshold was 13.15 W, while for the second threshold it fell to 6.45 W. The mean differences for the first threshold ranged from 7.50 to 11.25 W, while for the second threshold the range was 3.75 to 4.38 W.
The present results show that the WT analysis of HRV and the standard gas exchange methodologies produced identical measurements of aerobic and anaerobic thresholds. When the comparison variable used in the wavelet analysis was fp, close agreement was observed with the results of gas exchange variable analysis in terms of the aerobic threshold; the relationship was less strong for the anaerobic threshold. When the comparison variable was PS·fp, the relationship between the methodologies was again within the acceptable range, although this time it was stronger in terms of the anaerobic threshold.
In conclusion, the use of cardiotachometers seems to be a valid method for capturing the cardiac signal and its treatment by CWT; moreover, it is also inexpensive, non-aggressive and non-invasive for determining the aerobic-anaerobic transition phase.
Correspondence:
J. M. García-Manso.
Departamento de Educación Física. Facultad de Ciencias de la Actividad Física y el Deporte. Universidad de Las Palmas de Gran Canaria. 35017 Ilhas Canárias. España.
E-mail: jgarcia@def.ulpgc.es
History of the article:
Received June 13, 2008
Accepted October 7, 2008
