


Suicide and alcohol use disorders are significant Alaska Native health disparities, yet there is limited understanding of protection and no studies about social network factors in protection in this or other populations. The Qungasvik intervention enhances protective factors from suicide and alcohol use disorders through activities grounded in Yup’ik cultural practices and values. Identification of social network factors associated with protection within the cultural context of these tight, close knit, and high density rural Yup’ik Alaska Native communities in southwest Alaska can help identify effective prevention strategies for suicide and alcohol use disorder risk. Using data from ego-centered social network and protective factors from suicide and alcohol use disorders surveys with 50 Yup’ik adolescents, we provide descriptive data on structural and network composition variables, identify key network variables that explain major proportions of the variance in a four principal component structure of these network variables, and demonstrate the utility of these key network variables as predictors of family and community protective factors from suicide and alcohol use disorder risk. Connections to adults and connections to elders, but not peer connections, emerged as predictors of family and community level protection, suggesting these network factors as important intervention targets for intervention.
El suicido y los trastornos en el consumo de alcohol son disparidades de salud significativas entre los nativos de Alaska. Sin embargo, hay una comprensión limitada de las dinámicas de protección y no hay estudios sobre el papel de las redes sociales en esta población o en otras poblaciones. La intervención Qungasvik mejora los factores de protección contra el suicidio y los problemas de consumo de alcohol a través de actividades basadas en las prácticas y los valores culturales de los Yup’ik. La identificación de factores de redes sociales de carácter protector en los contextos culturales de comunidades Yup’ik muy unidas y densas del suroeste de Alaska pueden ayudar a identificar estrategias de prevención efectivas contra el riesgo de suicidio y los problemas con el alcohol. Con datos de redes egocéntricas e indicadores de encuesta sobre los factores protectores contra el suicidio y el abuso de alcohol en 50 adolescentes Yup’ik, proporcionamos datos descriptivos de las variables de composición y estructura de la red, identificamos aquellas variables claves de la red social que explican una mayor proporción de la varianza en la estructura de cuatro componentes principales de dichas variables, y demostramos la utilidad de dichos indicadores como predictores de los factores familiares y comunitarios de protección contra el suicidio y el riesgo de consumo abusivo de alcohol. Las conexiones con adultos y las conexiones con ancianos, pero no las conexiones con iguales, emergieron como predictores de la protección a nivel familiar y comunitario, lo que sugiere que estos factores de la red son un objetivo importante de la intervención.
Suicide and alcohol use disorders are significant health disparities experienced by Alaska Native people, with youth, and male youth in particular, at significantly higher risk for death by suicide and alcohol related problems, in contrast to their age cohort in the U.S. general population (Allen, Levintova, & Mohatt, 2011). Rural Yup’ik Alaska Native communities in southwest Alaska have been severely impacted by suicide and alcohol, and in response, several of the communities in this region have created a multilevel cultural intervention for their youth that draws extensively from Yup’ik traditional practices and cultural worldview, drawing from community strengths and local expertise (Rasmus, Charles, & Mohatt, 2014). The resulting Qungasvik (toolbox) intervention is an adaptive intervention. Each community selects from a set of modules that create protective experiences for youth on the individual, family, and community levels against suicide and alcohol use disorder.
A protective factors model for preventionThe Qungasvik intervention represents the results of a community-based participatory research (CBPR) intervention development process grounded in Yup’ik protective factors model. The intervention is strengths based, and instead of adopting a risk reduction approach, seeks to increase protective factors believed to mediate suicide and alcohol use disorder risk. A culturally grounded protective factors theoretical model for prevention of suicide and alcohol use disorder risk in Alaska Native youth guides the Qungasvik intervention.
The protective factors model was derived from qualitative work that generated a heuristic model of protective factors (Allen et al., 2006; Mohatt, Hazel, et al., 2004; Mohatt, Rasmus, et al., 2004) and a set of culturally appropriate measures for the study of the process of change and outcome. These protective factor measures at the level of the individual, family, and community were successfully tested in a predictive model of Reasons for Life (RFL) and Reflective Processes about alcohol abuse consequences (RP) (Allen, Mohatt, Fok, Henry, & Burkett, 2014). RFL and RP are co-occurring strengths-based ultimate outcome variables for the Qungasvik intervention. The individual, family, and community protective factors predictor variables of RFL and RP function as intermediate prevention strategy target variables in the culturally grounded theoretical model guiding the Qungasvik multilevel intervention. Research has produced promising preliminary findings of growth in dose related youth RFL and RP outcomes and in parent and community level protective outcomes in response to exposure to Qungasvik as a preventative intervention (Allen, Mohatt, Fok, & Henry, 2009; Mohatt, Fok, Henry, & Allen, 2014).
Qungasvik as a multilevel intervention has numerous modules at the community and family levels that seek to enhance protection through its strengths-based model. Previous research has identified intervention dose related growth in measures of these intermediate intervention target protective factors hypothesized in the theory of change to be responsible for the Qungasvik intervention effects (Mohatt et al., 2014). However, despite our observations, in conducting the intervention, regarding its impacts on community and family functioning and their network structures, we understand little regarding the relationship of the social networks within these geographically remote, tight knit, kinship-based Yup’ik rural communities to these protective factor variables. Enhanced understanding of social network variables important in protection could guide more effective intervention efforts in our work in these communities. At present, there is similarly no published data providing even basic description of the potentially distinctive characteristics of the social networks in remote Alaskan Indigenous communities.
Relationships between social networks, suicide and alcohol use disorderThere is a long history on study of the influence of social factors in suicide (Berkman, Glass, Brissette, & Seeman, 2000; Durkheim, 1951) and more recent work on social networks in relation to youth alcohol use (Sznitman, 2013). However, the majority of this research is focused on risk, and few studies in the literature explore the relation of network variables for protection. Network variables can be classified as structural or compositional (Hall & Wellman, 1985). Network structure describes the topology of a network and can include variables such as network size, or the number of actors; density, expressed as the number of actual actors/possible number of ties; degree centrality, or the number of ties incident to an actor; closeness centrality, or the reciprocal of the sum of the shortest distances between a node and all others; betweenness centrality, or the number of times a node is on the shortest path between all other nodes; as well as variables describing sub-networks such as cliques, or tight groupings of actors; structural holes, or networks including disconnected segments (Burt, 1992); reciprocity, defined as the extent to which relationships are reciprocal in directed networks and transitivity, which is the proportion of all potential relationships among three people in which two of the parties do not have a relationship or are hostile toward one another (Wasserman, 1994). Compositional variables focus on actors or relationships’ attributes, or to the type of resources to which actors have access, and include such things as homophily, which is the extent to which similar actors associate, boundary density, or the extent to which actors associate across sub-networks, as well as numerical counts of relationships with certain attributes.
Network studies of youth in schools nationwide showed evidence that social isolation, defined as having no friend or only friends who have themselves no friend, and network intransitivity, or the proportion of all 2-step relations between actors that have no direct relations, were associated with more suicide thoughts and behavior in female participants, suggesting that these two network variables may increase suicide risk (Bearman & Moody, 2004). Preliminary results of an ongoing clinical trial in 40 US high schools testing Sources of Strength, a universal youth suicide prevention program (Wyman et al., 2010) that trains peer leaders to change social network structure to decrease isolation and increase connectedness to adults to reduce attempted suicides, have confirmed the relationship of a number of social network variables with suicide risk and protection. Social isolation and intransitive friendship networks associate with increased suicide attempt, and maladaptive attitudes in peer networks (i.e., help-seeking rejection, maladaptive coping, or suicide acceptance) associate with increased suicide ideation and attempts, while having caring adults in a youth's network, particularly when their friends share these connections, is associated with decreased ideation and attempts (Wyman, Valente, Pickering, Pisani, & Brown, 2014). These preliminary data also found that a peer network with more adult ties and positive norms increased youth help-seeking for distress and suicidality, which is typically very low among adolescents (Wilson, 2007). Additional evidence points to suicides among adolescents occurring in clusters (Nanayakkara, Misch, Chang, & Henry, 2013), as suicide of a friend or family member posed risk for suicide attempt equal to severe depression. However, despite the heightened risk for suicide among American Indian and Alaska Native youth (National Center for Injury Prevention and Control. Centers for Disease Control and Prevention, 2013), we could locate no studies exploring social network variable relationships to suicide risk or protection in this population.
While the relation of peer social networks to adolescent alcohol use has been studied among other populations, limited research has been conducted with American Indian and Alaska Native youth. Further, even in the general population, only two studies to date have focused on peer social networks and the issue of adolescent alcohol use initiation (Light, Greenan, Rusby, Nies, & Snijders, 2013; Urberg, Degirmencioglu, & Pilgrim, 1997). Another study exploring longitudinal friendship networks found an association between school popularity trajectory and substance use (Moody, Brynildsen, Osgood, Feinberg, & Gest, 2011), and an influence and selection for similarity in alcohol use, as well as a reciprocal relationship between drinking and being more often chosen as a friend (Osgood et al., 2013). To date, we could locate no study that has explored social network effects on alcohol initiation with American Indian or Alaska Native youth. In contrast to studies of risk, protective factors have received limited attention in the alcohol literature, and few studies explore protective factors with American Indian or Alaska Native youth (Allen, Fok, Henry, Skewes, & Team, 2012). While network effects on alcohol use disorder risk have been studied in the general literature, we could locate no study that has explored peer relations and patterns of protection from alcohol. Study of protection and the growth mechanisms of protective factors among youth is an important research question for alcohol prevention science.
One nationwide school study has been conducted with American Indian youth. Rees, Freng, and Winfree (2014) found fewer ties to in-school friends among American Indians in comparison to White youth, and that level of activities with friends, as well as number of drinking friends in a youth's network increased self-reported social and physical negative consequences of alcohol consumption, whereas parental connectedness decreased consequences. These results are generally compatible with network theories based on Durkheim (Bearman, 1991), in which a good balance of social integration, reflected by network density, and social regulation, represented by a network composition insuring homogeneous and positive norms, are protective from suicide and facilitative of other positive health outcomes, including protection from alcohol use disorders.
Study aimsIn the current study, we describe the youth social networks of a rural Yup’ik Alaska Native community in southwest Alaska in order to evaluate the extent to which network statistics are predictive of protective factors from suicide and alcohol use disorder risk. This can allow for identification of social network variables potentially relevant to protection, suggesting targets for intervention, as well as indices by which to assess key elements within the intervention process of change. Using data from youth social networks within a Yup’ik cultural context, we address three research objectives: (1) provide descriptive data on structural and composition network variables from youth social networks in a rural Yup’ik Alaska Native cultural context, (2) identify key network variables that explain major proportions of the variance in the principal component structure of these network variables, and (3) explore these key social network variables as predictors of hypothesized protective factors from suicide and alcohol use disorder risk. Identification of social network factors associated with protection can potentially help identify effective prevention strategies for suicide and alcohol use disorder risk. In one understanding of intervention (Hawe, Shiell, & Riley, 2009), specific elements of social network change describe important change processes that represent intermediate outcome variables for prevention programs.
MethodsParticipantsParticipants were recruited from one Yup’ik Alaska Native community in southwest Alaska, where communities range in population from 200 to 1500 residents. Participants were Alaska Native youth between ages 12 and 19. All participants described their ethnicity as Yup’ik. All eligible youth in the community were invited to participate, and 50 participants, who are approximately 50% of all youth in this age group in the community, completed both the protective factor measures and the network survey. An additional seven participants completed the network survey, providing a larger sample size of 57 for the network descriptive and principal components analysis. Average age of the total sample of 57 was 15.25 years old, consisting of 30 males and 27 females.
ProceduresThis study was conducted as part of the pre-intervention baseline assessment of an implementation of the of the Qungasvik intervention, whose details were published previously (Rasmus, Charles, & Mohatt, 2014). Briefly, several Yup’ik communities in southwestern Alaska have been engaged with university researchers as part of a long-term collaborative and translational research process to develop and test an intervention using a Yup’ik community-level cultural model to increase protection against suicide and alcohol use disorder (Allen, Mohatt, Beehler, & Rowe, 2014). Assessment of outcomes from the intervention includes measures tapping growth in protective factors. This study added a social networks survey to those measures. Participants for the intervention were recruited through presentations to the tribal council and community groups, posters, announcements in school, and direct contacts and invitations to parents and youth. Written informed consent was obtained in English or Yup’ik from one of the youth's parents and assent was obtained from all youth under age 18, while consent was obtained for youth over age 18. Following this and prior to intervention, the first wave of baseline data collection was conducted. The social network instrument was implemented in the form of a REDCap web survey (Harris et al., 2009), while the protective factors measures were administered using a custom designed web-based software interface. Surveys were administrated in the community school computer lab. The University of Alaska Fairbanks Institutional Review Board, the Yukon Kuskokwim Health Corporation Human Studies Committee, and the local Tribal Council approved all procedures involving study participants.
MeasuresSocial networkWe elected to use an ego-centered approach to social network data collection (e.g. Minden, Henry, Tolan, & Gorman-Smith, 2000; Wasserman, 1994). An ego-centered approach collects information about each participant's network independently, as opposed to a sociometric approach that collects information on the network of the whole population or group. Advantages of this ego-centered approach are its comparative logistical simplicity, lower costs, and greater feasibility in comparison to approaches requiring interviewing of an entire community, and its ability to provide anonymity to the alters, as only each ego knows the identity of alters, who are identified only by nicknames. The approach also allows for application of standard statistical methods, as each ego network is independent of the others. One weakness of the approach is that many statistics pertaining to the whole network (e.g., centrality) cannot be directly calculated, thus limiting interpretations at the social group level – in our case, the community.
The complete ego network survey is provided in Supplementary Table S1. Participants started the survey using a name generator procedure, in which participants (egos) provided nicknames for their relations (alters). Then participants provided their own demographic information and attributes (ego attributes), and their alters’ attributes, and then characteristics of their relationships with alters (name interpreter), and relationships between each pair of alters.
The name generator for alters elicited two types of relationships, for up to 13 alters, who provided social support in the form of: (1) love, and (2) discussing private matters. Nominations could be made for one or both of these types of relationship. Ego attributes described by participants were age and gender, and alter attributes were age group (young child, youth, adult, or elder) and gender. The name interpreter for alters elicited (1) relationship role (sister or brother, parent, child, spouse/boyfriend/girlfriend, friend, someone I know in the community, co-worker, other family member, or other), (2) relationship satisfaction (dissatisfied, neutral, or satisfied), and (3) relationship qualifier, which allowed for multiple selections (we help each other out, we share or tell personal things with each other, is careful about my feelings, I’m able to depend on him/her, she/he's loyal and sticks up for me, stays friendly even when we get mad at each other, likes me just as I am, I look up to him/her, like doing things together, we believe the same things are important, we’re interested in or like the same things, understanding about how each other feels about things, other). Alter-Alter relationships were evaluated by eliciting whether alters knew each other (yes or no). Network statistics were calculated independently for each ego network.
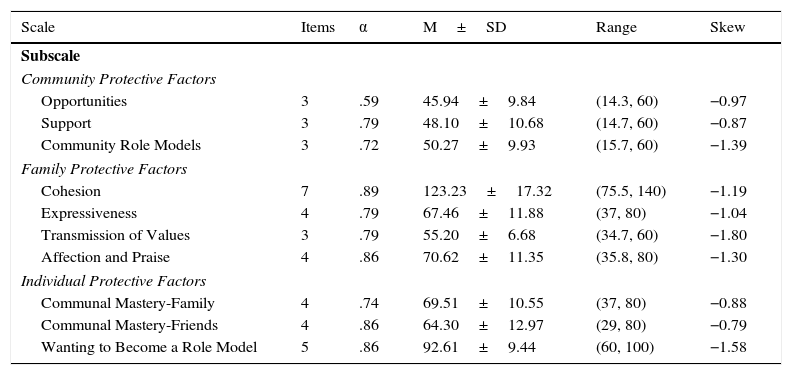
Protective factorsThe Qungasvik intervention outcomes assessment includes a baseline assessment of protective factor measures administered during the same time as the network survey. Manifest variables were defined through subscale scores to avoid under identification in the path modeling described below. Two baseline administrations of the intervention assessment survey were administered within 9 days of each other and of the network survey. Response format consisted of an analog slider control with three semantic anchors (not at all, somewhat, a lot). Prior to analysis, we converted the continuous slider scale into 20 equal intervals. The two baseline measures were averaged; 16 missing data points for a total of 4 participants were replaced by the mean value of the corresponding variable. Number of items, coefficient alpha reliabilities, means, standard deviations, and skewness for each subscale are presented in Table 1.
Descriptive statistics for protective factors variables (n=50).
| Scale | Items | α | M±SD | Range | Skew |
|---|---|---|---|---|---|
| Subscale | |||||
| Community Protective Factors | |||||
| Opportunities | 3 | .59 | 45.94±9.84 | (14.3, 60) | −0.97 |
| Support | 3 | .79 | 48.10±10.68 | (14.7, 60) | −0.87 |
| Community Role Models | 3 | .72 | 50.27±9.93 | (15.7, 60) | −1.39 |
| Family Protective Factors | |||||
| Cohesion | 7 | .89 | 123.23±17.32 | (75.5, 140) | −1.19 |
| Expressiveness | 4 | .79 | 67.46±11.88 | (37, 80) | −1.04 |
| Transmission of Values | 3 | .79 | 55.20±6.68 | (34.7, 60) | −1.80 |
| Affection and Praise | 4 | .86 | 70.62±11.35 | (35.8, 80) | −1.30 |
| Individual Protective Factors | |||||
| Communal Mastery-Family | 4 | .74 | 69.51±10.55 | (37, 80) | −0.88 |
| Communal Mastery-Friends | 4 | .86 | 64.30±12.97 | (29, 80) | −0.79 |
| Wanting to Become a Role Model | 5 | .86 | 92.61±9.44 | (60, 100) | −1.58 |
This scale was adapted from the Protective Factors scale for Yup’ik adults (Allen et al., 2006), itself derived from qualitative life history exploring important protective factors. Three subscales tap opportunities (e.g., There were things to do for fun other than drinking), support (e.g., People supported and helped me if I needed it), and community role models (e.g., I have someone in the community who I can look up to).
Family protective factorsThis scale includes the cohesion (e.g., My family members really support each other) and expressiveness (e.g., In my family, I can talk about my problems) subscales from the Brief Family Relationship Scale (Fok, Allen, Henry, & People, 2014), along with subscales tapping transmission of values (e.g., My family teaches good values) and affection and praise (e.g., [People] Let me know when I do something good).
Individual protective factorsThis scale measures mastery, the sense of efficacy in solving life challenges, along with the desire to become a role model for others. Measures of mastery have typically focused on individually focused mastery, and ignored the contribution to mastery achieved from successfully joining in problem solving with other significant figures in the social environment. The family subscale taps belief one can face life's problems successfully through joining with family (e.g., With the help of my family I can change many of the important things in my life), and with friends (e.g., Working together with friends I can solve many of my problems) from the Multicultural Mastery Scale (Fok, Allen, Henry, & Mohatt, 2012) tap these communal strategies. A third subscale taps wanting to become a role model (e.g., Be a good example for my school).
Analysis planWe adopted a three step approach that included (1) calculating common social network statistics from a social support ego network survey, (2) conducting a Principal Component Analysis (PCA) of these social network variables, interpreting main components capturing the majority of the variance, and (3) conducting a Partial Least Squares Path Modeling (PLS-PM) analysis of network components predicting protecting factors from suicide and alcohol use disorder. The approach is innovative in that we found only one report using PCA to group and organize network statistics (Nordman & Pasquier-Doumer, 2015), and no study using social network variables as predictors of intervention change outcome variables using PLS-PM analysis. PLS-PM is a non-parametric approach common in use in econometrics (Morgan, 1992), that is roughly equivalent to path analysis using structural equation modeling (SEM), and that allows for the analysis of multiple relationships between blocks of measured variables (Sanchez, 2013). PLS-PM has a number of advantages in contrast to SEM, making it an attractive alternative for health disparities research, which is a research area that makes small sample work essential (Srinivasan et al., 2015). PLS-PM requires fewer assumptions, particularly in regard to not having a requirement for normally distributed variables (Tenenhaus, 2008), thereby making it more likely to converge in small samples research with less potential for introducing bias in its estimates. A weakness of PLS-PM is that it provides less precise estimates than SEM (McIntosh, Edwards, & Antonakis, 2014). All analyses were conducted with the R software, v. 3.2 (R Core Team, 2013), using the network and egonet packages for social network analysis, the FactoMineR package for PCA, and the plspm package for PLS-PM analysis.
Social network analysisIn step one, we calculated common network statistics (Wasserman, 1994). The structure of the networks was assessed by size, or number of actors in the network, density (actual number of ties/possible number of ties), and three statistics proposed by Burt (1992) to assess the effects of structural holes, with the rational that a network with more structural holes provides more opportunities: (1) constraint, referring to how much room one has to negotiate or exploit potential structural holes, (2) effective size, or number of alters, minus the redundancy in the network and (3) efficiency, or effective size/actual size. In addition, we computed surrogate global centrality estimators as described by Lozares, López-Roldán, Bolibar, and Muntanyola (2015), summarizing closeness and betweenness centrality of all alters in an ego-network using the mean and max statistics and the centralization function (Butts, 2014; Freeman, 1979). We also computed ego betweenness centrality (in the ego-network) which is correlated to ego betweenness in the whole network (Everett & Borgatti, 2005).
Network composition was assessed by calculating degree, or the number of alters in a category, and their density (number of alters in a category/all alters) for two types of relations (love or private), alters’ role and age group, relationship qualifier, relationship satisfaction (coded as 1–3), and some of their combinations. Composition was also assessed through several standard network statistics: (1) gender and age group homophily, representing the extent to which each ego associates with alters of the same group, operationalized as the EI index (Krackhardt & Stern, 1988), (2) gender and age group heterogeneity, representing the extent to which actors in each network beyond each ego associate with groups other than their own, operationalized as Blau's index (Blau, 1977), and (3) adult and elder boundary density, representing the extent to which adults or elders, and peers in the network know each other, operationalized as the actual number of youth to adult or Elder pairings/number of possible youth to adult or elder pairings (Kazak & Marvin, 1984; Minden et al., 2000). Constraint, effective size, and efficiency were reverse coded so that an increase of the statistic would correspond to an increase in protective factors.
Principal component analysisIn step two, we conducted a PCA of the network statistics obtained in step one, scaled to unit variance. PCA is a multivariate analysis technique that allows reduction of a large number of collinear variables to a limited number of orthogonal components that represent linear combinations of the variables (Jolliffe, 2005). Generally the first few components explain most of the variance in the data, and if interpretable, the main components can be used in a regression type analysis, or a subset of the original variables that load the highest can be used for a component-based analysis, such as PLS-PM.
Partial least squares path modelingIn step three, PLS-PM tested the four major social network components identified in the PCA as predictors of Community, Family, and Individual Protective Factors (CPF, FPF, and IPF). In PLS-PM, a block defines a latent variable. The relationships between measured (manifest) variables represent the outer (measurement) model, and relationships or paths between the latent variables, based on prior knowledge or theory, represent the inner (structural) model. In PLS-PM, the overall model is fitted using partial least squares, consisting of iterative least square regressions of the inner and outer models; convergence is obtained when the overall residual variance is minimized. Confidence intervals can be established around estimates using non-parametric methods such as bootstrapping (Esposito Vinzi, Chin, Henseler, & Wang, 2010; Tenenhaus, Vinzi, Chatelin, & Lauro, 2005); in this analysis we used 1000 bootstrap repetitions, which was the maximum number resulting in convergence for our small sample size. Probability levels for statistical significance for path coefficients were set at the .1 level.
ResultsSupplementary Table S2 provides descriptive statistics for the network variables. Mean network size was 5.93±2.62, while average density at 0.98±0.07 was high and very right skewed. Mean degree adult, 2.53±1.35, was higher than average degree youth, 1.70±2.18, V(56)=914.5, p=.001, itself higher than Degree Elder, 0.53±0.78, V(56)=684.5, p<.001. Mean degree love, 4.88±2.52, was slightly above average degree private, 4.51±2.54, V(56)=41, p=.02, Average adult density, 0.59±0.29, was much higher than average elder density, 0.12±0.20, V(56)=1087.5, p<.001. The relationship qualifier ‘We help each other out’ is present in the highest number of alters, 4.14±2.52, whereas ‘We’re interested in or like the same things’, in the lowest, 2.21±2.23, V(56)=660.5, p<.001. The roles with highest means are Parent, 1.44±1.00, Sister/brother, 1.30±1.40, and Friend, 1.09±1.64. Average satisfaction relationship is highest for Satisfied, 3.49±2.57, lower for Neutral, 1.19±2.07, V(56)=1271.5, p<.001, and lowest for Dissatisfied, 0.25±1.15, V(56)=188, p<.001. Overall satisfaction density is high at 0.91±0.15.
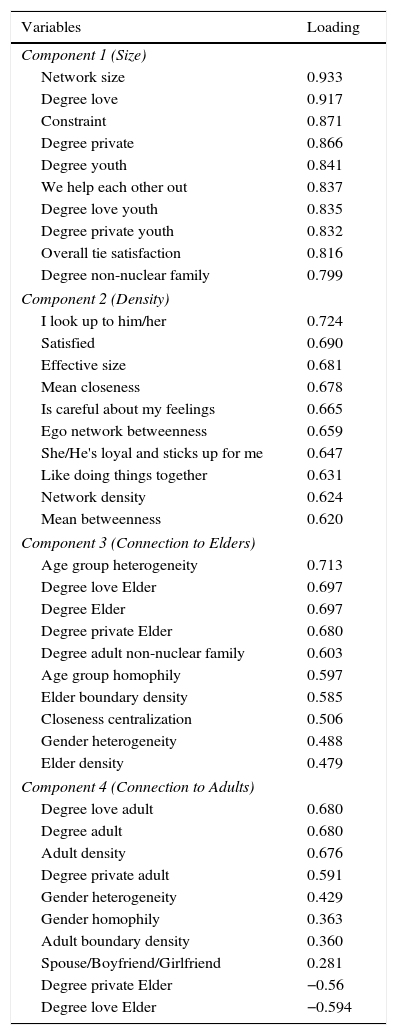
Table 2 presents loadings for the top ten loading variables on the first four components in the PCA of network variables. Examination of the screen plot of the eigenvalues found support for retaining four principal components, accounting for 67.1% of the variance. The first component, size, composed of variables including network size, degree love, constraint, and degree private accounted for 28.3% of variance. The Density component was composed of variables including I look up to him/her, satisfied, effective size, mean closeness, ego network betweenness, network density, and efficiency for 19.3% of variance. The third component, Connection to Elders, was composed of variables including age group heterogeneity, degree of love elder, elder, private elder, and adult non-nuclear family, accounting for 11.5% of variance. The fourth component, Connection to Adults, included variables such as degree of love adult, adult, private adult, and adult density, and accounted for 7.9% of variance.
Principal component analysis of social network variables (n=57).
| Variables | Loading |
|---|---|
| Component 1 (Size) | |
| Network size | 0.933 |
| Degree love | 0.917 |
| Constraint | 0.871 |
| Degree private | 0.866 |
| Degree youth | 0.841 |
| We help each other out | 0.837 |
| Degree love youth | 0.835 |
| Degree private youth | 0.832 |
| Overall tie satisfaction | 0.816 |
| Degree non-nuclear family | 0.799 |
| Component 2 (Density) | |
| I look up to him/her | 0.724 |
| Satisfied | 0.690 |
| Effective size | 0.681 |
| Mean closeness | 0.678 |
| Is careful about my feelings | 0.665 |
| Ego network betweenness | 0.659 |
| She/He's loyal and sticks up for me | 0.647 |
| Like doing things together | 0.631 |
| Network density | 0.624 |
| Mean betweenness | 0.620 |
| Component 3 (Connection to Elders) | |
| Age group heterogeneity | 0.713 |
| Degree love Elder | 0.697 |
| Degree Elder | 0.697 |
| Degree private Elder | 0.680 |
| Degree adult non-nuclear family | 0.603 |
| Age group homophily | 0.597 |
| Elder boundary density | 0.585 |
| Closeness centralization | 0.506 |
| Gender heterogeneity | 0.488 |
| Elder density | 0.479 |
| Component 4 (Connection to Adults) | |
| Degree love adult | 0.680 |
| Degree adult | 0.680 |
| Adult density | 0.676 |
| Degree private adult | 0.591 |
| Gender heterogeneity | 0.429 |
| Gender homophily | 0.363 |
| Adult boundary density | 0.360 |
| Spouse/Boyfriend/Girlfriend | 0.281 |
| Degree private Elder | −0.56 |
| Degree love Elder | −0.594 |
Note. Top ten loading variables on first four components; all loadings p<.001.
Fig. 1 presents the PLS-PM analysis inner or structural, and outer or measurement models. The inner model describes the relationship of the four network latent variables identified in the PCA, labeled Size, Density, Connection to Adults, and Connection to Elders, to each of the three protective factors latent variables, labeled CPF, FPF, and IPF (thick arrows). The outer model links each latent variable to its block of manifest variables (thin arrows). The blocks of protective factors latent variables are composed of the 10 sub-scales described above. The manifest variables composing each network block were guided by the PCA, and were selected from among the highest loading variables on each component to insure both best model fit and maximally coherent interpretation for the block. The variables that did not function well, i.e., with low communality or near zero weight in the outer model, were removed. For example, the variables qualifying the ties (e.g., I look up to him/her) did not function well in the density block for the PLSPM model, and were therefore not used.
. Rectangles on the left denote social network manifest variables; rectangles on the right denote protective factors manifest variables. Ellipses on the left denote social network latent variables; ellipses on the right denote protective factors latent variables. Thin arrows denote relationships between latent variables and their manifest variables (outer or measurement model); thick arrows denote relationship between manifest variables (inner or structural model). *p<1.")
Partial least squares path model of social network predictors of protective factors from suicide and alcohol use disorder for Yup’ik Alaska Native youth (n=50). Rectangles on the left denote social network manifest variables; rectangles on the right denote protective factors manifest variables. Ellipses on the left denote social network latent variables; ellipses on the right denote protective factors latent variables. Thin arrows denote relationships between latent variables and their manifest variables (outer or measurement model); thick arrows denote relationship between manifest variables (inner or structural model). *p<1.
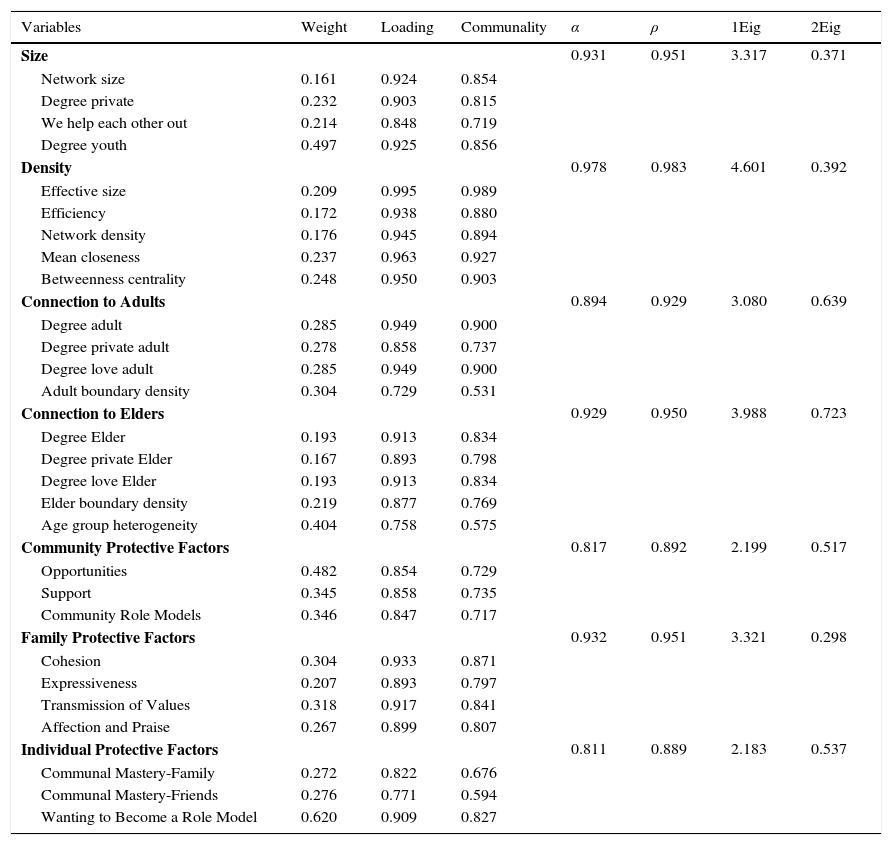
Table 3 displays weights, loadings, communalities and fitting characteristics for the final network variables selected for Size, Density, Connection to Adults, and Connection to Elders from the PCA, and for subscales composing the Community, Family and Individual Protective Factors in the outer model. In PLS-PM, latent variable scores are weighted sums of their manifest variables, and weights represent the relative contribution of each manifest variable to the latent variable. For the latent variable Size, weight for degree youth was much higher than for all other variables, while in the latent variables Density and Connection to Adults the weights for all variables were quite similar, and for Connection to Elders, age group heterogeneity had a higher weight than all other variables. For Community and Family Protective Factors, subscale weightings were generally at similarly levels, but for Individual Protective Factors, the Wanting to Become a Role Model subscale had a weight twice the magnitude of the other subscales. Communalities are squared loadings representing the proportion of the variance in a manifest variable captured by its latent variable. Sanchez (2013) recommends loadings >.7 and communalities >.5. Unidimensionality is tested through Cronbach's alpha, Dillon-Goldstein's rho, and the first and second eigenvalues; alpha and rho exceed .80 in all cases, and often approach or exceed .90, while first eigenvector >1, and second eigenvector <1. Additionally, cross-loadings, calculated, but not presented in the table, showed that each manifest variable always loaded higher for its theorized latent variable that for the others.
Weights, loadings, communalities and unidimensionality for outer partial least squares path model (n=50).
| Variables | Weight | Loading | Communality | α | ρ | 1Eig | 2Eig |
|---|---|---|---|---|---|---|---|
| Size | 0.931 | 0.951 | 3.317 | 0.371 | |||
| Network size | 0.161 | 0.924 | 0.854 | ||||
| Degree private | 0.232 | 0.903 | 0.815 | ||||
| We help each other out | 0.214 | 0.848 | 0.719 | ||||
| Degree youth | 0.497 | 0.925 | 0.856 | ||||
| Density | 0.978 | 0.983 | 4.601 | 0.392 | |||
| Effective size | 0.209 | 0.995 | 0.989 | ||||
| Efficiency | 0.172 | 0.938 | 0.880 | ||||
| Network density | 0.176 | 0.945 | 0.894 | ||||
| Mean closeness | 0.237 | 0.963 | 0.927 | ||||
| Betweenness centrality | 0.248 | 0.950 | 0.903 | ||||
| Connection to Adults | 0.894 | 0.929 | 3.080 | 0.639 | |||
| Degree adult | 0.285 | 0.949 | 0.900 | ||||
| Degree private adult | 0.278 | 0.858 | 0.737 | ||||
| Degree love adult | 0.285 | 0.949 | 0.900 | ||||
| Adult boundary density | 0.304 | 0.729 | 0.531 | ||||
| Connection to Elders | 0.929 | 0.950 | 3.988 | 0.723 | |||
| Degree Elder | 0.193 | 0.913 | 0.834 | ||||
| Degree private Elder | 0.167 | 0.893 | 0.798 | ||||
| Degree love Elder | 0.193 | 0.913 | 0.834 | ||||
| Elder boundary density | 0.219 | 0.877 | 0.769 | ||||
| Age group heterogeneity | 0.404 | 0.758 | 0.575 | ||||
| Community Protective Factors | 0.817 | 0.892 | 2.199 | 0.517 | |||
| Opportunities | 0.482 | 0.854 | 0.729 | ||||
| Support | 0.345 | 0.858 | 0.735 | ||||
| Community Role Models | 0.346 | 0.847 | 0.717 | ||||
| Family Protective Factors | 0.932 | 0.951 | 3.321 | 0.298 | |||
| Cohesion | 0.304 | 0.933 | 0.871 | ||||
| Expressiveness | 0.207 | 0.893 | 0.797 | ||||
| Transmission of Values | 0.318 | 0.917 | 0.841 | ||||
| Affection and Praise | 0.267 | 0.899 | 0.807 | ||||
| Individual Protective Factors | 0.811 | 0.889 | 2.183 | 0.537 | |||
| Communal Mastery-Family | 0.272 | 0.822 | 0.676 | ||||
| Communal Mastery-Friends | 0.276 | 0.771 | 0.594 | ||||
| Wanting to Become a Role Model | 0.620 | 0.909 | 0.827 |
Note. Weight=relative contribution of each manifest variable to the aligned latent variable; Loading=association of each manifest variable and the aligned latent variable; Communality=squared loadings representing proportion of variance in each manifest variable captured by the aligned latent variable; α=Cronbach's alpha; ρ=Dillon-Goldstein's rho; 1Eig=1st eigenvalue; 2Eig=2nd eigenvalue. Variables labels in bold are latent variables; variables labels in plain text are manifest variables.
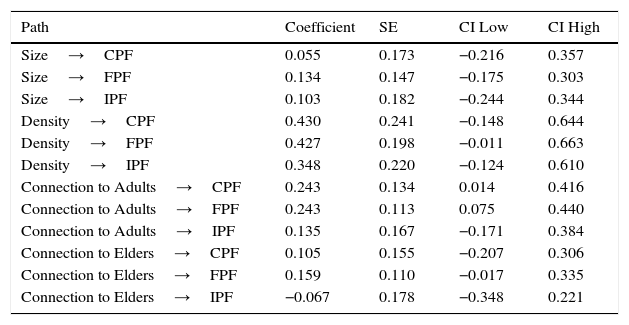
Table 4 summarizes the inner or structural model, providing path coefficients and their standard errors, and confidence intervals at the 90% or p<.1 level; a path is considered statistically significant if its CI does not contain 0. The paths coefficients, corresponding to regression slopes, for size to all three Protective Factors are close to zero and non-significant. The paths from Density to all three Protective Factors are all higher, but non-significant, although Density→FPF=0.43, ns, approaches significance (CI −0.01, 0.66) and this may be due to the wider confidence intervals that are likely related to the extreme right skew of the density construct distribution. Path coefficients for Connection to Adults→CPF=.24, p<.1, and Connection to Adults→FPF=.24, p<.1, were significant, while Connection to Adults→IPF=.14, ns. The path coefficient for Connection to Elders→FPF=.16, ns, approaches significance (CI −0.02, 0.34), while Connection to Elders→CPF=.11, ns, and Connection to Elders→IPF are close to zero. Fig. 1 summarizes path coefficients and their significance. Overall model R2=.31 for CPF and .30 for FPF are high effect sizes, while .14 for IPF is medium, based of the respective values of Cohen f2 of .44, .43, and .16 (Cohen, 1992). The overall goodness-of-fit criterion (0<GoF<1; Tenenhaus et al., 2005) is calculated as the geometric mean of the average communality and the average R2 value, and represents the average predictive power of the model. GoF=.44 exceeds the cut-off value of .36 proposed by Wetzels, Odekerken-Schroder, and Van Oppen (2009) for a large effect size, but also indicates a substantial proportion of protective factors variance is not predicted by the model.
Path coefficients for inner partial least squares path model, with bootstrap standard error and 90% confidence intervals (n=50).
| Path | Coefficient | SE | CI Low | CI High |
|---|---|---|---|---|
| Size→CPF | 0.055 | 0.173 | −0.216 | 0.357 |
| Size→FPF | 0.134 | 0.147 | −0.175 | 0.303 |
| Size→IPF | 0.103 | 0.182 | −0.244 | 0.344 |
| Density→CPF | 0.430 | 0.241 | −0.148 | 0.644 |
| Density→FPF | 0.427 | 0.198 | −0.011 | 0.663 |
| Density→IPF | 0.348 | 0.220 | −0.124 | 0.610 |
| Connection to Adults→CPF | 0.243 | 0.134 | 0.014 | 0.416 |
| Connection to Adults→FPF | 0.243 | 0.113 | 0.075 | 0.440 |
| Connection to Adults→IPF | 0.135 | 0.167 | −0.171 | 0.384 |
| Connection to Elders→CPF | 0.105 | 0.155 | −0.207 | 0.306 |
| Connection to Elders→FPF | 0.159 | 0.110 | −0.017 | 0.335 |
| Connection to Elders→IPF | −0.067 | 0.178 | −0.348 | 0.221 |
Note. R2 for CPF=0.306, FPF=0.301, IPF=0.135; Cohen f2 (R2/(1−R2)) for CPF=0.441, FPF=0.430, IPF=0.157; model goodness of fit=0.444.
The main findings of this study suggest important associations between specific components of Yupik Alaska Native youth social network characteristics and specific levels of protective factors from suicide and alcohol use disorder risk reported by youth. The component of social network characteristic variables labeled Connections to Adults, composed largely of immediate and extended family members, was associated with both family and community, but not individual protective factors. The Connections to Elders and the Density components both approached significance in their relation to family protective factors, and confidence intervals suggested these components might have attained significance with larger sample sizes.
We found minimal effects of social network on individual level protective factors. Social network effects appear in these data to be most pronounced upon levels of protection beyond the individual level. Previous research suggests community level variables in particular appear to have largest impact upon protective outcomes from suicide and alcohol use disorder risk for Yup’ik Alaska Native youth (Allen, Mohatt, Beehler, & Rowe, 2014; Allen, Mohatt, Fok, Henry, & Burkett, 2014). The current findings suggest change in specific network characteristic variables through intervention may comprise important change mechanisms by which to influence protective factor outcomes on these levels. Additional study is needed to better understand how social networks contribute to protection against suicide and alcohol use disorder for these youth.
Current results also describe structural and network composition variables in rural Yup’ik Alaska Native youth social networks. The mean network size of 5.93 is very similar to the average size of 5.95 reported in a study of adolescents in Australia (Marshall, Parker, Ciarrochi, & Heaven, 2013). However, network variables showed that variation in overall Yup’ik youth social network size is mainly influenced by peer connections, as most youth reported family networks of similar size. This points to an inherent strength of Alaska Native community life and culture, with family providing for young people a consistently strong social support network.
Network composition variables of Yup’ik youth social networks suggest these connections to adults are strong and influential. While few descriptive studies of Yup’ik social networks exist, there is available an ethnographic literature similarly describing the characteristics of Yup’ik social life and family systems. This literature verifies the critical importance of family to survival and well-being in Alaska Native communities, with key roles for parents as well as highly specific roles in the culture for extended kinship adult figures such as aunts, uncles and cousins (Fienup-Riordan, 1994; Jolles, 2002; Krupnik & Chlenov, 2013).
The importance of elders in Alaska Native culture and community life has also been described in other studies (Lewis, 2011). Trends in the data in this exploratory study are also suggestive of an important role for elders in the lives of youth, and fostering youth relations with elders is a central component of this intervention and its theory of change. In addition to limitations posed by sample size in the Connection to elders findings, there may also be culture specific attributes of the elder relationship and types of elders in protection that we are not capturing in our current assessment of network structure.
Trends in the data in the current results are also suggestive of a role for Density. The Density component in this study is composed of effective size, efficiency, and betweenness centrality reverse-coded, and network density and mean closeness not reverse-coded. Together, this is suggestive that fewer structural holes and less betweenness, coupled with more network density and increased closeness may have a positive impact on family protective factors. This is compatible with Durkheimian theory that posits both social integration and social regulation are protective from suicide (Durkheim, 1951). Heightened betweenness and structural holes may convey increased conflicting norms, resulting in inefficient social regulation, which is also compatible with findings of increased suicide risk associated with intransitivity (Bearman & Moody, 2004).
Key variables that explain the majority of the variance in a network's composition includes overall tie satisfaction, support type “We help each other out”, and connection among peers. For Yup’ik Alaska Native communities the relatively recent social transition from a mobile hunting and gathering way of life to a sedentary, Western wage-based system has resulted in an increase in opportunities for social connection among unrelated families and generational peers (Krupnik & Chlenov, 2013; Oswalt, 1990). Yup’ik youth social networks reflect this transition in being still consistently grounded in family social networks, while at the same time exhibiting variability in the peer networks reported, suggestive of recent increases in the influence of peer connections. Other studies have shown that Yup’ik youth peer relationships are among the most commonly cited sources of both stress and strength in rural Alaska Native community contexts (Rasmus, Allen, & Ford, 2014).
Finally, this study, through its use of PCA to identify important network variables and their structure, and of PLS-PM to identify linkages to outcome variables important in prevention, advances social networks in intervention research in three ways. First, the general analytic approach demonstrates one potentially useful methodology for identifying social network variables that can serve as targets for intervention, through study of social network relationships with intervention outcome variables of interest. Second, the specific approach provides workable small samples analysis procedures for use in several other areas of health disparity research where small sample analyses are a necessity (Srinivasan et al., 2015). Finally, this study provides an example of the utility of protective factors as alternative to risk factor reduction approaches. Together, the approach is a promising avenue for social network intervention research in general, and for small smaples health disparities intervention research in particular.
Could the inverse causal pathway relation be the case? That is, could protective factors to some degree instead influence network structure? This is likely, and equally likely, the relationship between social network and protection may be reciprocal and bidirectional. However, from the perspective of intervention science, we seek to identify change mechanisms as points of access through which to intervene. These data suggest key elements of social network are promising intervention targets through which to promote growth in protective factors from suicide and alcohol use disorder risk in this population. Intervention science, as distinguished from more applied outcomes research, seeks to use intervention to provide a test of theory. By impacting through intervention the specific network variables identified in these data as intermediate variables, and then by testing for their downstream effects on ultimate variables of protective factors from suicide and alcohol use disorder risk as an outcome of intervention, researchers can provide an empirical test of this causal question.
Despite establishing a relationship between social networks and measures of Yup’ik protective factors, the study is limited in several key ways. First, small sample size creates uncertainty regarding stability of these results, and two of the relationships under study would have likely attained significance with a larger sample, suggesting the value of further research. Second, Alaska Native communities are small, kinship-based and remote communities, where most people know one another, and interrelatedness creates a situation of limited variability in global density indicators, which were near uniformly high. This implies a need to be very specific in the type of relationships elicited, and to use network composition characteristics of specific culturally significant relationships to achieve results. A similar situation likely exists regarding a need for greater specificity in how network characteristics of the elder relationships are assessed. Research is needed in more complete elaboration of culture specific elements of these network variables; studies aimed at refining density measures would be particularly useful and likely generalizable across other populations. Third, the PLS-PM methods used to analyze these data, though used widely in economics, are underutilized in behavioral science research. However, the method shows promise in future research when the assumptions of SEM cannot be met because of small sample size. Finally, findings from this study may be specific to rural Yup’ik Alaska Native youth, which utilized measures developed specifically for this population. Findings may not be generalizable to other Indigenous groups and to non-Indigenous populations; further research is needed.
In conclusion, results establish that selected social network characteristics function as predictors of protective factors from suicide and alcohol use disorders among rural Yup’ik Alaska Native youth. These findings provide empirical grounding for specific social network variables as targets for the Qungasvik intervention, constituting intermediate variables for prevention research and, potentially, are important elements in the process of change from intervention. Our findings also suggest that additional research that focused on the role of social networks in improving Alaska Native and American Indian health and well-being is critically needed.
Conflict of interestThe authors have no conflict of interest to declare.
The following are the supplementary data to this article:
This research was supported by grants R01AA11446, R21AA015541, R21AA0016098, R01AA023754 National Institute on Alcohol Abuse and Alcoholism, R24MD001626 National Institute on Minority Health and Health Disparities, T32 DA037183 National Institute on Drug Abuse, 5P20RR016430 National Center for Research Resources, and 1P30GM103325 National Institute of General Medical Sciences.
