


This article empirically studies the impact of perseverance and passion for long term goals (GRIT) on educational achievements. Specifically, the study compares GRIT levels between migrants and native school students, and tests the role of GRIT in explaining school achievements of migrants. Based on regression analysis and using a sample of 2,003 ninth graders, including 178 migrants from the Republic of Tatarstan, Russia, the results did not suggest an educational gap between native students and first generation migrants, ethnic Tatar migrants, and those from Central Asia. In addition, GRIT has significant effects in explaining the educational achievements of these migrant groups. On the contrary, the findings suggest that native students outperform their ethnic Russian migrant peers.
Empíricamente se estudia el impacto de la perseverancia y pasión por las metas de largo plazo (GRIT) sobre los éxitos educativos. Específicamente, se comparan los niveles de GRIT entre escolares migrantes y nativos y se analiza el papel que juega GRIT en la explicación de los éxitos escolares de los migrantes. Con base en el análisis de regresión y una muestra de 2.003 escolares en el noveno grado, de los cuales 178 son migrantes en la Republica de Tartaristán, Rusia, los resultados no sugieren la existencia de una brecha educativa entre los estudiantes nativos y los migrantes de primera generación migrantes tártaros y con aquellos provenientes de Asia Central. Además, GRIT tiene efectos significativos para explicar los éxitos educativos de estos grupos de migrantes. Por el contrario, los hallazgos sugieren que los estudiantes nativos superan a sus compañeros migrantes rusos.
As a result of the dissolution of the Union of Soviet Socialist Republics (USSR) and the ending of the communism system in Central and Eastern Europe, many of the inhabitants of this area decided to migrate in search of better life conditions. Since then, the economic conditions of Russia have been fluctuating, but the Russian economy outperforms many economies in this region. Because of this, partially, Russia has been attracting millions of international migrants. From 2003 to 2007 the net migration flow to Russia was around 2.3 million and from 2008 to 2012 it was around 1.1 million as a five-year average (World Development Indicators, World Bank). Thus, the migration flow to Russia has been decreasing, yet Russia accepted the third largest number of international migrants in the world, around 11.6 million in 2015. Roughly 50% of these migrants are ethnic Russians or Slavic people, and the majority of these migrants are from the Commonwealth of Independent States (United Nations Department of Economic and Social Affairs/Population Division, 2016). For instance, 3 million migrants from Ukraine and 3 million from Kazakhstan were estimated in 2015.
Many of these migrants arrived with their children, and the Federal Migration Service estimated 70 thousand migrant children in Moscow alone (Zayonchkovskaya, Florinskaya, Poletaev, & Doronina, 2014). These children have to endure discrimination, intolerance, racism, and in many cases they have poor skills in the Russian language. However, the empirical evidence suggests that they are able to achieve high educational outcomes, and compared to native school students they do not perform poorly at school, once such variables are controlled for socioeconomic status, social capital, and cultural capital (Alexandrov, Baranova, & Ivaniushina, 2012; Kamaev & Tovar-García, 2016; Tovar-García, in press).
In the USA, a few empirical studies suggest that migrant children outperform their native peers (Hao & Woo, 2012; Kao, 2004; Kao & Tienda, 1995). Migrants are optimistic and strongly believe that the host country will allow them to achieve better life conditions, and this optimism is transmitted to their children, and as a result they will study hard and will be able to reach success in school (Kao, 2004; Kao & Tienda, 1995). In the literature, this result is known as the immigrant paradox hypothesis. Nevertheless, around the world, most of the empirical results support the downward assimilation hypothesis, which states that migrant children can achieve only low educational outcomes, such as low school grades, high school drop-out rates, and low rates of school enrolment. Migrant children have poor family resources, low levels of economic, social and cultural capital, and consequently, they perform poorly at school (Suárez-Orozco et al., 2010; Tovar-García, in press; Vaquera & Kao, 2012).
However, it is unclear why students should obtain better educational outcomes due to optimism. In the psychological literature, other aspects explain educational achievements, for instance, motivation, obedience, and self-regulation (Robbins et al., 2004; Tovar-García, 2012). Specifically, the empirical results suggest that the most relevant psychological explanatory variable is perseverance and passion for long-term goals, usually known as GRIT (Duckworth, Peterson, Matthews, & Kelly, 2007). Therefore, this research is motivated by the following questions: do migrant schoolchildren have higher levels of GRIT than their native peers? And is this a key variable in explaining migrants’ school success?
In Russia, previous studies focused on the impact of family background (including cultural and social capital) on educational outcomes, where students with high levels of family resources obtain better results (Roshchina, 2010; Tovar-García, 2013, 2014). GRIT has been used as a predictor, but mainly it was a control variable in regression analysis, where the results showed the positive effects of GRIT on educational outcomes (Tovar-García, 2013, 2014). Previous studies on educational outcomes of migrants in Russia, and around the world, did not consider the role of GRIT (Kamaev & Tovar-García, 2016; Tovar-García, in press). Therefore, this article focuses on the relationship between GRIT and educational achievements of migrant children using a sample of 2,003 ninth graders in the year 2010 from Tatarstan, 178 of them being migrants. The core data are taken from Tovar-García (2014), who detected a gender gap in that school girls outperform boys, and also that Tatar students outperform their Russian peers.
Determinants of Educational OutcomesTovar-García (2012) highlights the need for a multidisciplinary approach in the study of the determinants of educational outcomes, and identified six major approaches from the economics of education, the sociology of education, educational research, and educational psychology. Economists pay particular attention to the human capital theory, where individuals decide the amount of education they want to achieve considering future returns in the labor market. Sociologists underline the role of socioeconomic status (usually operationalized with parental education, professional status, and family income), the role of social capital (networks, contacts, friends, etc. in the society and in the family), and the role of cultural capital (operationalized with indicators of high-brow culture). Educational research emphasizes the importance of educational resources, such as school characteristics and the quality of teachers and students.
Psychologists argue that non-cognitive skills play a major role in shaping educational outcomes, particularly when cognitive skills seem to lose explanatory power. However, in the past, the contributions from educational psychology were ignored by other social scientists and only recently the literature has stressed the role of psychological variables and the need for establishing connections between the psychological approach and the above mentioned approaches (Farkas, 2003; Robbins et al., 2004; Tovar-García, 2012).
In many cases the empirical evidence suggests that intelligence, cognitive skills, or other socioeconomic factors are unable to predict educational outcomes, because for academic success it is necessary to know the correct behavior (Tovar-García, 2012). Thus, psychologists explain educational outcomes using different indicators about students’ skills, habits, and manners, such as diligence, discipline, attendance, participation, sociability, enthusiasm, self-confidence, impetuosity, and disruptiveness (Farkas, 2003). Many studies showed that motivation and educational expectation are among the most relevant predictors of educational outcomes (Robbins et al., 2004). In addition to students’ behavior, parents’ behavior and the transmission of proper conduct are also relevant. Parents should not only provide their children with economic resources, but also motivate their children, encourage high educational expectations, and teach the correct behavior.
Therefore, different psychological variables affect educational outcomes, yet the most recent theoretical discussions and empirical results claim that students’ perseverance and passion for long term goals (GRIT) is the most important psychological predictor. Intelligence explains most of the variation in each successful outcome, but GRIT does not correlate with intelligence and explains a significant proportion of these outcomes (Duckworth et al., 2007). For successful outcomes in the educational system it is necessary to wait many years, in other words, education is a long-term goal and requires perseverance and passion, for example, to achieving the higher education.
Migrants’ Educational Achievements: The Role of GRITAll theories mentioned above also apply to migrant children, yet their effects on educational outcomes are not totally clear for them. The downward assimilation hypothesis asserts that children of migrants have low levels of socioeconomic status, social, and cultural capital. In other words, their parents have low levels of education, low professional status, low family income, few networks and contacts, and low levels of high-brow culture. These children usually attend low quality schools with few financial resources and poor quality staff. In addition, migrant children endure intolerance, discrimination, racism, stress, and are often not fluent in the dominant language of the host country. Consequently, migrant children cannot achieve high educational outcomes, as most of the empirical literature suggests (Suárez-Orozco et al., 2010; Tovar-García, in press; Vaquera & Kao, 2012).
However, migration can be selective, that is, in some cases migrants actually have a high socioeconomic status, a high-brow culture, they already know the language of the host country, and so on. Empirical studies also demonstrate that the typical explanatory variables of educational outcomes, for instance socioeconomic status, have weaker effects depending on migrant groups, and sometimes the explanatory power of these variables does not exist (Conger, Schwartz, & Stiefel, 2011; Hao & Woo, 2012; Luthra, 2010; Pong & Landale, 2012). Moreover, the empirical literature describes several cases where migrant children outperform their native peers; this result is known as the immigrant paradox hypothesis (Conger et al., 2011; Fuligni, 1997; Hao & Woo, 2012; Kao, 2004; Kao & Tienda, 1995; Plunkett, Behnke, Sands, & Choi, 2009; Zhou, 1997).
In the USA, children of migrants from Asia have high educational achievements and perform at school better than their native peers (Kao & Tienda, 1995). In the very beginning, of course, they have troubles because of poor skills in the language of instruction, but in a few years they are fluent in the dominant language, and can maintain their heritage language. In other words, they are bilinguals and this fact has positive impacts on educational outcomes (Alòs i Font & Tovar-García, 2015; Tovar-García & Alòs i Font, 2016; Tovar-García & Podmazin, in press). Migrant children suffer discrimination, racism, etc., but have life experiences, know the best educational practices from their countries of origin and can use the best practices from the host country. Thus, they can develop different strategies for school success. Furthermore, and the most relevant, migrants are optimistic and parents transmit this optimism to their children, orienting them towards high educational goals. Children feel obligated to study hard, and as a result they will achieve high educational outcomes (Kao, 2004; Kao & Tienda, 1995).
Nevertheless, Kao and Tienda (1995), and the subsequent studies based on their work, did not use explanatory variables approaching and measuring the optimism of migrants. Actually, the empirical evidence mainly suggests that migrant students are good students and can even outperform their native peers, but without any specific test on the role of optimism. Moreover, in educational psychology there is not a clear theory on optimism and educational outcomes. On this concern, as mentioned above, the psychological approach highlights the role of GRIT. Therefore, if migrant children outperform their native peers it should be a consequence of their higher GRIT levels, once the tests are controlling for other factors. Thus, the first hypothesis to be tasted is:H1 Children of migrants have higher GRIT levels than their native peers.
Despite the relevance of GRIT in explaining practically each successful outcome, this hypothesis has not been tested before. However, GRIT was already used as independent variable of educational outcomes in the Russian literature, in the cases of Yaroslavl (Tovar-García, 2013) and Tatarstan (Tovar-García, 2014). For both regions a GRIT index was build, which was computed using 15 items, and the regression analysis showed positive impacts of GRIT on educational outcomes. Yet, GRIT has not used before to predict educational outcomes of migrant children.
Russia is an interesting case to study GRIT levels of migrant children, because some empirical results demonstrate that migrant children in Russia have high educational achievements; at least, they perform at school as well as their native peers. In Saint Petersburg, migrants from minority ethnic groups are highly motivated and perform at school as well as their native peers (Alexandrov et al., 2012). Using a representative sample for Russia and quantitative methods, mainly logit regressions for panel data, Tovar-García (in press) did not find statistically significant differences in the academic achievements between migrant and native schoolchildren, and very similar results were found in Moscow (Kamaev & Tovar-García, 2016). These findings agree with a third hypothesis on educational outcomes of migrant children: migration status does not affect educational outcomes. The socioeconomic characteristics of migrants explain their educational outcomes, but the migration status per se does not have an impact (Lin & Lu, 2016). Given this, the second hypothesis to be tested is:H2 Controlling for socioeconomic factors, in Russia, GRIT explains the absence of the educational gap between migrants and natives school students.
To test the above mentioned hypotheses I use data from the Republic of Tatarstan, which is one of the most dynamic regions of Russia, economically speaking. Many international migrants arrived to Tatarstan in the last two decades. In 2013, the Migration Service registered around 70 thousand international migrants, most of them from Uzbekistan, Tajikistan, Azerbaijan, and Kirghizstan. The total population of Tatarstan is around 3.8 million (2010 Census) and it is basically a bi-ethnic society – 53.2% of its population are ethnic Tatars and 39.7% are Russians, and the major religion is Islam. Accordingly, Muslim migrants may find facilities for their adaptation.
This research uses data and indexes developed by Tovar-García (2014), who used a sample of 2003 school students, aged 15-16, in the ninth grade in 2010. The surveyed students were selected using a multi-stage and stratified cluster sampling strategy. Fifty-nine schools, mainly using Russian as the language of instruction, were randomly selected from the total population; then, within each sampled school, all students in 9th grade were surveyed (exclusions consisted of not available students).
The questionnaire and the sampling strategy were designed using the experience of the OECD Programme for International Student Assessment (PISA). Schools were selected considering location (city, town, and village) and type of school (general public school, boarding school, gymnasium, and lyceum). The survey was designed to study educational outcomes and trajectories, such as grades by subject, participation in academic activities, and study plans. It also provides information on economic, social, cultural, and psychological characteristics of students and their relatives. For the present research, it is particularly relevant that the survey provides information on migration status of parents and students allowing identification of migrants of first and second generation.
Particularly, this research uses four indexes build with the method of principle components (Tovar-García, 2014):
- 1)
The educational achievement index (EDACHIEVE), which includes school grades of eight subjects (algebra, geometry, Russian language, literature, history, physics, chemistry, and biology) and information about students’ participation in school activities, as Olympiads, and prizes and educational rewards due to school performance. The minimal value of the index is -3.2 and the maximum is 2.35; higher values of the index indicate higher educational achievements.
- 2)
The family background index (FAMILY), which consists of 12 variables about students’ socioeconomic status (parental education, professional status, and family income), and their cultural and social capital (number and types of books at home, familiar relationships, and other related indicators). The minimal value of the index is -3.37 and the maximum is 2.85; higher values of the index indicate more resources for school success.
- 3)
The school quality index (SCHOOLQUAL), which sums up information about school characteristics, such as participation in school Olympiads, specialization in particular subjects, and especial educational and teaching methods. The minimal value of the index is 0 and the maximum is 3; higher values of the index indicate higher school qualities for educational achievements.
- 4)
The GRIT index, which consists of 15 items, its minimal value is -3.55 and the maximum is 2.51; higher values of the index indicate a higher perseverance and passion for long-term goals, which should facilitate school progress.
The sample includes 178 international migrant students (MIGRANT), around 8.8% of the surveyed students. Among them, 96 are first generation migrants, around 4.7% (MIGRANT1), and 82 are second generation migrants, around 4.1% (MIGRANT2). It was not possible to define the migration status of 34 students, who refused to answer where they were born or did not answer the place of birth of their parents.
In the sample, the majority of migrants are from ex-Soviet countries, around 62.5% of first generation migrants. Eighty-seven children of migrants (around 48.8%) mentioned that Russian is the mother tongue of their parents (mother or father) and 81 children of migrants (around 45.5%) mentioned that Tatar is the mother tongue of their parents (mother or father). Fifteen children (around 8%) reported a Caucasian language (Azerbaijan, Armenian, and Georgian), and 14 children (around 8%) reported a language from Central Asia (Uzbek, Kirghiz, Kazakh, and Turkmen). Only a few school students reported Ukrainian or other language. I use this information to classify and build dummy variables on the origin of migrants as: ethnic Russians (RUSSIANMIGRANT), ethnic Tatars (TATARMIGRANT), ethnic Caucasians (CAUCASIANMIGRANT), and ethnic Asians (ASIANMIGRANT). Children reporting different languages for mother and father were classified in both groups.
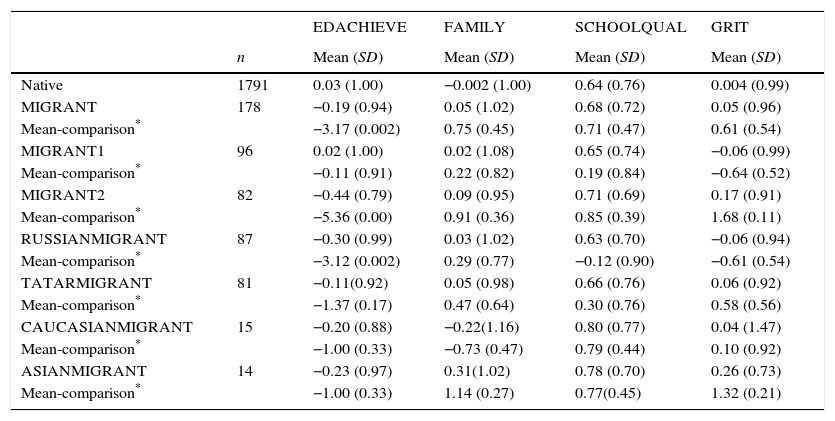
ResultsComparing GRIT between Migrants and Native StudentsTable 1 presents basic descriptive statics and mean-comparison tests for the four indexes by group of migrants. In general, migrants have lower EDACHIEVE levels, which agrees with the downward assimilation hypothesis. However, this is an unexpected result because previous empirical studies did not find statistically significant differences between migrants and native students in Saint Petersburg, Moscow, and Russia (Alexandrov et al., 2012; Kamaev & Tovar-García, 2016; Tovar-García, in press). In Tatarstan, the mean-comparisons tests, in general, suggest that native students outperform their migrant peers, yet the educational gap between first generation migrants and native students is not statistically significant. Actually, the educational gap corresponds to second generation migrants and Russian migrants. The t-tests of means reveal that there is no difference in the EDACHIEVE values between native students and Tatar, Caucasian, or Asian migrants.
Descriptive Statistics by Index and Mean-comparison Tests.
| EDACHIEVE | FAMILY | SCHOOLQUAL | GRIT | ||
|---|---|---|---|---|---|
| n | Mean (SD) | Mean (SD) | Mean (SD) | Mean (SD) | |
| Native | 1791 | 0.03 (1.00) | −0.002 (1.00) | 0.64 (0.76) | 0.004 (0.99) |
| MIGRANT | 178 | −0.19 (0.94) | 0.05 (1.02) | 0.68 (0.72) | 0.05 (0.96) |
| Mean-comparison* | −3.17 (0.002) | 0.75 (0.45) | 0.71 (0.47) | 0.61 (0.54) | |
| MIGRANT1 | 96 | 0.02 (1.00) | 0.02 (1.08) | 0.65 (0.74) | −0.06 (0.99) |
| Mean-comparison* | −0.11 (0.91) | 0.22 (0.82) | 0.19 (0.84) | −0.64 (0.52) | |
| MIGRANT2 | 82 | −0.44 (0.79) | 0.09 (0.95) | 0.71 (0.69) | 0.17 (0.91) |
| Mean-comparison* | −5.36 (0.00) | 0.91 (0.36) | 0.85 (0.39) | 1.68 (0.11) | |
| RUSSIANMIGRANT | 87 | −0.30 (0.99) | 0.03 (1.02) | 0.63 (0.70) | −0.06 (0.94) |
| Mean-comparison* | −3.12 (0.002) | 0.29 (0.77) | −0.12 (0.90) | −0.61 (0.54) | |
| TATARMIGRANT | 81 | −0.11(0.92) | 0.05 (0.98) | 0.66 (0.76) | 0.06 (0.92) |
| Mean-comparison* | −1.37 (0.17) | 0.47 (0.64) | 0.30 (0.76) | 0.58 (0.56) | |
| CAUCASIANMIGRANT | 15 | −0.20 (0.88) | −0.22(1.16) | 0.80 (0.77) | 0.04 (1.47) |
| Mean-comparison* | −1.00 (0.33) | −0.73 (0.47) | 0.79 (0.44) | 0.10 (0.92) | |
| ASIANMIGRANT | 14 | −0.23 (0.97) | 0.31(1.02) | 0.78 (0.70) | 0.26 (0.73) |
| Mean-comparison* | −1.00 (0.33) | 1.14 (0.27) | 0.77(0.45) | 1.32 (0.21) |
Note. *t-tests of means (comparisons with native students).
With regard to the indexes FAMILY and SCHOOLQUAL, the t-tests of means do not reveal differences in the values between native students and migrants, even by groups of migrants. Thus, it seems that migrants do not come from low-income families, which call into question the downward assimilation hypothesis. Followers of this hypothesis argue that migrants come from families with low socioeconomic status, and usually they study in low quality schools. This is not the case in Tatarstan; therefore, if native students outperform migrants, the reasons should be others. The following section continues this discussion.
The t-tests of means do not reveal differences in the GRIT values between native students and migrants. Thus, these results do not support the H1: in Tatarstan migrants do not have higher levels of GRIT than native students, and vice versa.
For a better description of the GRIT levels between migrants and native students it is necessary to have a shared vision on each item used in making-up the GRIT index. In the questionnaire, the school students reported how much they agree with 15 items (judgments). The students chose values from 1 (disagree strongly) to 5 (agree strongly), and some items with a negative meaning were reverse scored in the database for statistical manipulation. The reliability analysis did not show serious concerns–Cronbach's alpha equals .67. In addition, the accuracy of the translation of the items into Russian and the confirmatory factor analysis have been verified for the Russian version of the GRIT scale (Tyumeneva, Kuzmina, & Kardanova, 2014). The items are:
- 1)
As a rule, I carefully finish everything I do [Kak pravilo, ya staratel’no vypolnyayu vse, chem mne prikhoditsya zanimat'sya].
- 2)
I often set a goal but later choose to pursue a different one [Kak pravilo, ya stavlyu kakuyu-to tsel’, no potom menyayu ee na kakuyu-to druguyu].
- 3)
I am a hard worker [Ne ironiziruya, ya mogu nazvat’ sebya truzhennikom].
- 4)
New ideas and new projects sometimes distract me from previous ones [Novye idei i novye proekty, inogda uvodyat menya v stronu ot prezhnikh].
- 5)
I have achieved a goal that took years of work [Ya dobivalsya(as’) tseley, radi kotorykh rabotal(a) mnogo mesyatsev].
- 6)
I become interested in new pursuits every few months [Kazhdye neskol’ko mesyatsev ya nachinayu interesovat'sya kakimi-to novymi delami].
- 7)
I have overcome setbacks to conquer an important challenge [Obychno ya prodolzhal(a) reshat’ stoyashchuyu zadachu posle neudachnykh popytok].
- 8)
My interests change from year to year [Moi interesy menyayutsya god ot goda].
- 9)
Setbacks don’t discourage me [Neudachi obychno ostanavlivayut menya].
- 10)
I have been obsessed with a certain idea or project for a short time but later lost interest [Kakaya-to opredelennaya ideya vladeet mnoy korotkoe vremya, a potom ya teryayu interes k ney].
- 11)
As a rule, other people consider me goal-oriented person [Kak pravilo, obo mne otzyvayutsya kak o tseleustremlennom cheloveke].
- 12)
I have difficulty maintaining my focus on projects that take more than a few months to complete [Ya ne v ladakh s proektami, kotorye tyanutsya mnogo mesyatsev, naprimer, bol'she goda].
- 13)
I finish whatever I begin [Ya zakanchivayu, vse chto nachinayu].
- 14)
I have been practicing my hobbies for years [U menya est’ uvlecheniya (khobbi, zanyatie), kotorymi ya zanimayus’ godami].
- 15)
I am diligent [V rabote ya uporen(a)]
Figure 1 shows the frequencies of answers (percentages) by migrants and native students. It is not possible to identify significant differences between these two groups; the distribution of answers is very similar in almost all items. Nevertheless, in several items, the percentage of answers with the maximum value 5 is slightly higher for migrants, but the percentage of answers with the minimum value 1 is also slightly higher for migrants. Consequently, once more, there is no evidence in favor of the H1.
The Impact of GRIT on Educational Achievements of Migrant and Native Students.")
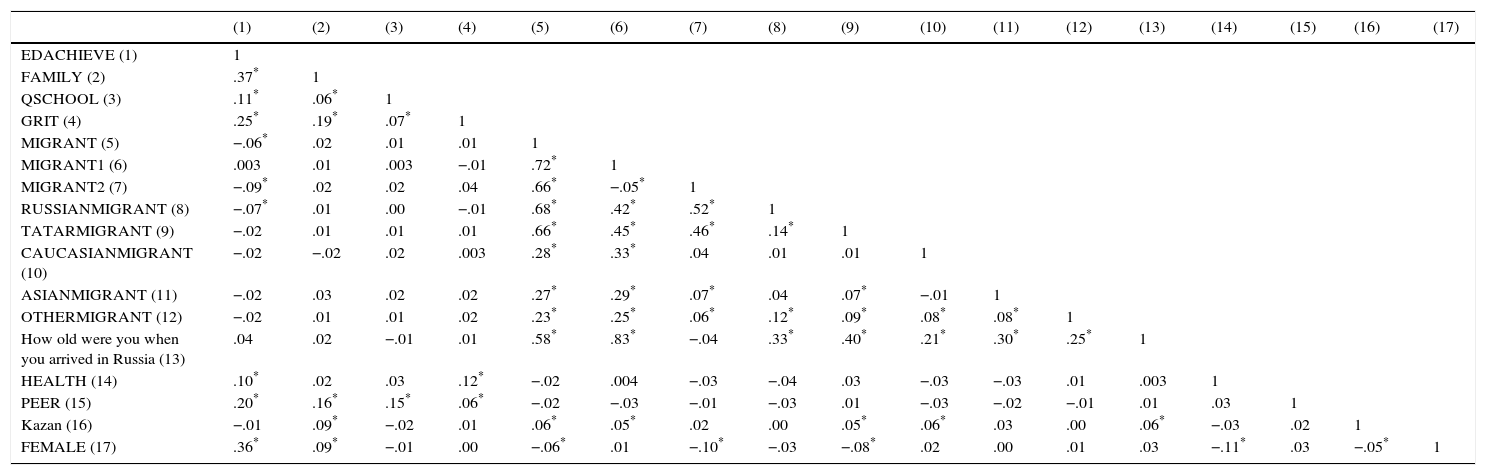
The tests of means indicate that native students outperform second generation migrants and Russian migrants. Moreover, the correlation coefficients (see Table 2) between educational achievements and second generation migrants and Russian migrants are negative and statistically significant at the 5% level, also suggesting a gap between these groups of migrants and native students. However, the migration origin is not correlated with the typical explanatory variables of educational outcomes, such as socioeconomic status and school quality.
Pairwise Correlation Coefficients.
| (1) | (2) | (3) | (4) | (5) | (6) | (7) | (8) | (9) | (10) | (11) | (12) | (13) | (14) | (15) | (16) | (17) | |
|---|---|---|---|---|---|---|---|---|---|---|---|---|---|---|---|---|---|
| EDACHIEVE (1) | 1 | ||||||||||||||||
| FAMILY (2) | .37* | 1 | |||||||||||||||
| QSCHOOL (3) | .11* | .06* | 1 | ||||||||||||||
| GRIT (4) | .25* | .19* | .07* | 1 | |||||||||||||
| MIGRANT (5) | −.06* | .02 | .01 | .01 | 1 | ||||||||||||
| MIGRANT1 (6) | .003 | .01 | .003 | −.01 | .72* | 1 | |||||||||||
| MIGRANT2 (7) | −.09* | .02 | .02 | .04 | .66* | −.05* | 1 | ||||||||||
| RUSSIANMIGRANT (8) | −.07* | .01 | .00 | −.01 | .68* | .42* | .52* | 1 | |||||||||
| TATARMIGRANT (9) | −.02 | .01 | .01 | .01 | .66* | .45* | .46* | .14* | 1 | ||||||||
| CAUCASIANMIGRANT (10) | −.02 | −.02 | .02 | .003 | .28* | .33* | .04 | .01 | .01 | 1 | |||||||
| ASIANMIGRANT (11) | −.02 | .03 | .02 | .02 | .27* | .29* | .07* | .04 | .07* | −.01 | 1 | ||||||
| OTHERMIGRANT (12) | −.02 | .01 | .01 | .02 | .23* | .25* | .06* | .12* | .09* | .08* | .08* | 1 | |||||
| How old were you when you arrived in Russia (13) | .04 | .02 | −.01 | .01 | .58* | .83* | −.04 | .33* | .40* | .21* | .30* | .25* | 1 | ||||
| HEALTH (14) | .10* | .02 | .03 | .12* | −.02 | .004 | −.03 | −.04 | .03 | −.03 | −.03 | .01 | .003 | 1 | |||
| PEER (15) | .20* | .16* | .15* | .06* | −.02 | −.03 | −.01 | −.03 | .01 | −.03 | −.02 | −.01 | .01 | .03 | 1 | ||
| Kazan (16) | −.01 | .09* | −.02 | .01 | .06* | .05* | .02 | .00 | .05* | .06* | .03 | .00 | .06* | −.03 | .02 | 1 | |
| FEMALE (17) | .36* | .09* | −.01 | .00 | −.06* | .01 | −.10* | −.03 | −.08* | .02 | .00 | .01 | .03 | −.11* | .03 | −.05* | 1 |
Thus, for a deeper understanding of this apparent gap, it is necessary to test whether these differences are significantly controlling the impacts of other explanatory variables. Accordingly, to test the H2 I use regression analysis, first, to verify the presence of the educational gap between some migrant groups and native students, and second, to describe and to test the impact of GRIT on educational achievements by migrant groups.
In quality of dependent variable I use EDACHIEVE and in quality of independent variables I use the indexes FAMILY, SCHOOLQUAL, and GRIT; I also use dummy variables by migrant groups and their interaction terms. The baseline model is given by the equation (1); the regression coefficients are estimated through least squares with robust standards errors, controlling possible heteroscedasticity concerns.
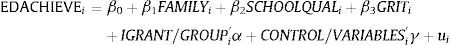
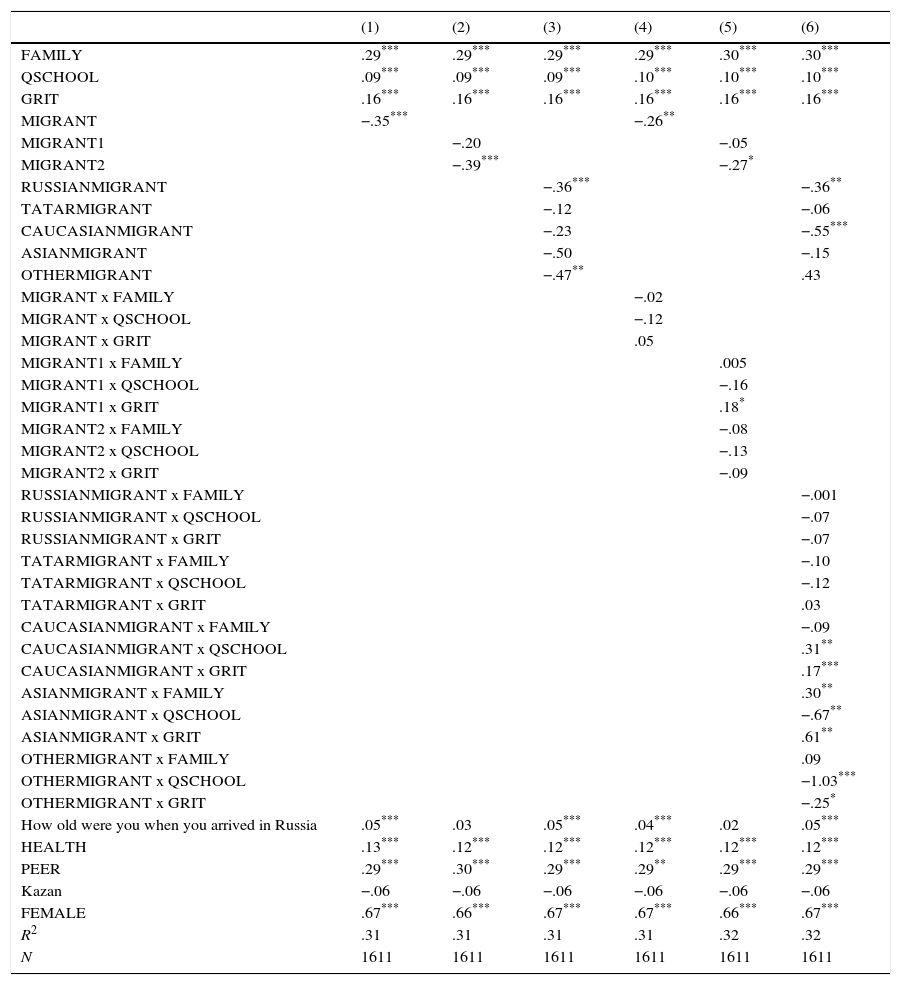
Table 3 shows the major results of the regression analysis. The regression coefficients by specification are in columns–the column 1 is the most simple model and the subsequent regressions include dummy variables by migrant groups and their interaction terms.
Regression Coefficients.
| (1) | (2) | (3) | (4) | (5) | (6) | |
|---|---|---|---|---|---|---|
| FAMILY | .29*** | .29*** | .29*** | .29*** | .30*** | .30*** |
| QSCHOOL | .09*** | .09*** | .09*** | .10*** | .10*** | .10*** |
| GRIT | .16*** | .16*** | .16*** | .16*** | .16*** | .16*** |
| MIGRANT | −.35*** | −.26** | ||||
| MIGRANT1 | −.20 | −.05 | ||||
| MIGRANT2 | −.39*** | −.27* | ||||
| RUSSIANMIGRANT | −.36*** | −.36** | ||||
| TATARMIGRANT | −.12 | −.06 | ||||
| CAUCASIANMIGRANT | −.23 | −.55*** | ||||
| ASIANMIGRANT | −.50 | −.15 | ||||
| OTHERMIGRANT | −.47** | .43 | ||||
| MIGRANT x FAMILY | −.02 | |||||
| MIGRANT x QSCHOOL | −.12 | |||||
| MIGRANT x GRIT | .05 | |||||
| MIGRANT1 x FAMILY | .005 | |||||
| MIGRANT1 x QSCHOOL | −.16 | |||||
| MIGRANT1 x GRIT | .18* | |||||
| MIGRANT2 x FAMILY | −.08 | |||||
| MIGRANT2 x QSCHOOL | −.13 | |||||
| MIGRANT2 x GRIT | −.09 | |||||
| RUSSIANMIGRANT x FAMILY | −.001 | |||||
| RUSSIANMIGRANT x QSCHOOL | −.07 | |||||
| RUSSIANMIGRANT x GRIT | −.07 | |||||
| TATARMIGRANT x FAMILY | −.10 | |||||
| TATARMIGRANT x QSCHOOL | −.12 | |||||
| TATARMIGRANT x GRIT | .03 | |||||
| CAUCASIANMIGRANT x FAMILY | −.09 | |||||
| CAUCASIANMIGRANT x QSCHOOL | .31** | |||||
| CAUCASIANMIGRANT x GRIT | .17*** | |||||
| ASIANMIGRANT x FAMILY | .30** | |||||
| ASIANMIGRANT x QSCHOOL | −.67** | |||||
| ASIANMIGRANT x GRIT | .61** | |||||
| OTHERMIGRANT x FAMILY | .09 | |||||
| OTHERMIGRANT x QSCHOOL | −1.03*** | |||||
| OTHERMIGRANT x GRIT | −.25* | |||||
| How old were you when you arrived in Russia | .05*** | .03 | .05*** | .04*** | .02 | .05*** |
| HEALTH | .13*** | .12*** | .12*** | .12*** | .12*** | .12*** |
| PEER | .29*** | .30*** | .29*** | .29** | .29*** | .29*** |
| Kazan | −.06 | −.06 | −.06 | −.06 | −.06 | −.06 |
| FEMALE | .67*** | .66*** | .67*** | .67*** | .66*** | .67*** |
| R2 | .31 | .31 | .31 | .31 | .32 | .32 |
| N | 1611 | 1611 | 1611 | 1611 | 1611 | 1611 |
The coefficients of MIGRANT, MIGRANT2, and RUSSIANMIGRANT are negative and statistically significant at the traditional levels of confidence. In other words, native students achieve better educational outcomes than their migrant peers, which agrees with the results in the tests of means and with the downward assimilation hypothesis. However, the coefficients of MIGRANT1, TATARMIGRANT, and ASIANMIGRANT are not statistically significant, suggesting the absence of the educational gap between native students and first generation migrants, Tatar migrants, and Central Asian migrants. This result agrees with previous findings in Russia, and also suggests that the case of Tatarstan differs from Saint Petersburg, Moscow, and Russia. In addition, in the case of Caucasian migrants the regression results are mixed and inconclusive, with statistical significance only in one specification (see column 6). Similarly, the results are inconclusive for other migrants, mainly from Ukraine or with ethnicities of the neighboring regions, such as Maria El and the Republic of Bashkortostan. There are only 10 students classified as other migrants; consequently, it does not make sense to discuss findings for this group.
Previous studies found that bilingualism has positive impacts on educational outcomes, and in the particular case of Tatarstan the evidence suggests that Tatar speakers outperform their peers using the Russian language at home (Tovar-García, 2014; Tovar-García & Alòs i Font, 2016). Consequently, the bilingual environment of Tatarstan may affect the educational achievements of migrants. Although Russian is the dominant language, the language policy and education policy promoting the Tatar language and bilingual education may complicate the educational performance of migrants, in general, and particularly of Russian migrants. On the contrary, Tatar migrants should find comfortable this bilingual atmosphere, or at least they should demonstrate a positive attitude to the Tatar language and its role in the school system. Migrants from Central Asia or Caucasian republics, usually speaking their own mother tongues, may find the Tatar society less aggressive due to Islam-based culture and the knowledge of other languages. Accordingly, there is no educational gap between native students and Tatar and Asian migrants. Moreover, newcomers perform at the school as well as their native peers, as prior findings suggest in Russia.
The coefficients of FAMILY are positive and statistically significant at the 1% level in all regressions, as the theory and previous studies predict (Tovar-García, 2014). Earlier studies also suggest that socioeconomic status has lower correlations with educational outcomes in the case of migrants (Luthra, 2010; Pong & Landale, 2012). Accordingly, the coefficients of the interaction terms between FAMILY and migrant groups are not statistically significant, excluding the interaction between FAMILY and Asian migrants (positive and significant at the 5% level). Therefore, in general, the socioeconomic status, cultural capital, and social capital do not play a especial role in the case of migrants. In other words, high-income migrants do not have advantages.
Similarly, in general, the school's quality (SCHOOLQUAL) does not have additional impacts for migrants’ educational achievements. As it was expected, the coefficients of SCHOOLQUAL are positive and statistically significant at the 1% level in all regressions, but the coefficients of the interaction terms between SCHOOLQUAL and migrant groups are not statistically significant, excluding the interaction between SCHOOLQUAL and Caucasian migrants (positive and significant at the 5% level). That is, the quality of school only improves the educational achievements of Caucasian migrants.
More interesting for the present research, the coefficients of GRIT are positive and statistically significant at the 1% level in all regressions, as the theory and previous studies predict (Duckworth et al., 2007; Tovar-García, 2013, 2014). In addition, the coefficients of the interaction terms between GRIT and migrant groups are statistically significant in specific cases. First, the interaction term between GRIT and MIGRANT1 is positive and statistically significant at the 6% level (see column 5); that is, in the case of newcomers GRIT has an additional positive impact to their educational achievements. This partially explains the absence of the educational gap between native students and newcomers, in favor of the H2. Furthermore, the interaction term between GRIT and CAUCASIANMIGRANT is positive and statistically significant at the 1% level, and between GRIT and ASIANMIGRANT the coefficient is positive and statistically significant at the 2% level (see column 6). Thus, although first generation migrants, Caucasian, and Asian migrants do not have higher levels of GRIT in comparison with native students (against the H1), the regression results suggest that GRIT has a significant role in explaining their educational achievements (in favor of the H2). As a result, at least partially, these migrant groups perform at school as well as their native peers due to GRIT.
In addition, these findings do not depend on the age of migrants when they arrived in Russia. It is expected that migrants arriving in the host country at early ages will perform better at school, because their adaptation is easier: for instance, they have less troubles learning the host language. However, some regression results suggest that migrants who arrived at older ages achieve better educational outcomes. Nevertheless, this result should be taken with caution, because in our sample 53% of migrants arrived in Russia when they were less than 7 years old and 20% of migrants arrived at an age between 11 and 14. In other words, the majority arrived on time to course the first years of school in Tatarstan. Thus, for a better understanding of the impact of arriving age it is necessary a sample with a larger distribution on this issue, in our case, students are concentrated in early ages.
The regression model includes several control variables, all them with statistical significance, excluding the dummy variable for the capital city (Kazan), which is not statistically significant in all regressions. Therefore, our results do not depend on particularities in Kazan, and school students living in Kazan do not have advantages or disadvantages in comparison with students living in other settlements (most of them in urban localities). Our results also suggest that healthier students (HEALTH) and students with friends planning to continue studying (PEER) achieve better educational outcomes. In addition, girls outperform boys (FEMALE is positive and statistically significant). These results have already been reported in the literature (Tovar-García, 2014).
DiscussionTatarstan is a bilingual society with two major ethnic groups: Tatars and Russians. In this context, the typical explanatory variables of educational outcomes play a minor role (Tovar-García, 2014). Subsequently, other variables should explain the educational gap or the lack of this gap between native students and some migrant groups. From the psychological point of view, the perseverance and passion for long-term goals (GRIT) is the most relevant explanatory variable (Duckworth et al., 2007). Thus, this research has focused on the role of GRIT in explaining the educational gap between native and migrant students.
The descriptive statistics and t-tests of means suggested that there are no differences in the levels of GRIT between migrant and native students. Nevertheless, the results in the regression analysis showed that GRIT has positive impacts on the educational outcomes of first generation migrants, Caucasian migrants, and Central Asian migrants. In the case of Tatar migrants, the coefficient of the interaction term with GRIT was positive, but the effect was not statistically significant. Therefore, GRIT partially explains the absence of the educational gap between native students and these migrant groups. That is, GRIT reduce the distance between native students and some migrant groups, excluding Russian migrants for whom the coefficient of the interaction term with GRIT was negative, but the effect was not statistically significant.
In Tatarstan, the findings suggested that migrants, mostly ethnic Russian migrants, perform poorly at school in comparison with their native peers, by contrast with the case of Saint Petersburg, Moscow, and Russia, where the empirical evidence does not suggest advantages or disadvantages in the educational outcomes achieved by migrant school students (Alexandrov et al., 2012; Kamaev & Tovar-García, 2016; Tovar-García, in press). Thus, for Russian migrants in Tatarstan, the findings agreed with the downward assimilation hypothesis, which states that migrants have a low socioeconomic status and low levels of social and cultural capital, and as a result they achieve low educational outcomes.
However, in Tatarstan the results suggested that the family resources of migrants do not play a major role in shaping their educational achievements. Moreover, the results also indicated the absence of the educational gap between native students and first generation migrants, ethnic Tatar migrants, and Central Asian migrants. These findings do not completely support the immigrant paradox hypothesis, which claims that migrants can even outperform their native peers (Kao, 2004; Kao & Tienda, 1995), yet the findings partially support the normative hypothesis: migration background per se does not affect educational outcomes.
GRIT showed to be a key variable in explaining the educational outcomes of school students, with an additional positive impact on educational achievements of the mentioned migrant groups. These findings provide empirical evidence to develop an additional explanation of the immigrant paradox hypothesis. That is, migration implies a long-term goal and migrants with high levels of GRIT should be able to achieve successful outcomes. If this perseverance and passion is transmitted to their children, then they may even outperform native students.
Prior studies found that Tatar speakers outperform their peers speaking Russian (Tovar-García, 2014; Tovar-García & Alòs i Font, 2016). Accordingly, it is also important to mention that the educational gap between Russian migrants and natives may be due to the bilingual atmosphere of Tatarstan. Tatar migrants should not be affected by this bilingual atmosphere, and probably Central Asian migrants, who usually speak their heritage languages and are Muslims, can find easier ways for their adaptation in a bilingual society with Islam as major religion. On the other hand, Russian migrants may find this bilingual atmosphere more aggressive. These are assumptions for a future research on the impact of bilingualism on educational outcomes of migrants. This is also a limitation of this study, because the findings might not be extended to monolingual societies where the usual policy is one language for all. For bilingual societies, as many other regions in Russia or in Europe, for instance Catalonia and the Basque Country in Spain, it is expected that bilingualism play a relevant role, and migrants’ GRIT levels will correctly predict their probabilities of success in achieving high educational outcomes.
Thus, in Tatarstan, the focus of the education policy should be on Russian school students, particularly on those with a migration background. Actually, many migrants arriving in Russia are ethnic Russians. In regions with a strong presence of other ethnicities, for instance Caucasian regions, their educational concerns may be similar to those reported in Tatarstan. Consequently, GRIT should be a key variable in the psychological support that they could receive. In general, the school should also teach students not to give up when things get difficult, and help them to understand the importance of perseverance and passion for long-term goals.
Conflict of InterestThe author of this article declares no conflict of interest.
Financial SupportThe article was prepared within the framework of the Basic Research Program at the National Research University Higher School of Economics (HSE) and supported within the framework of a subsidy granted to the HSE by the Government of the Russian Federation for the implementation of the Global Competitiveness Program.
The author would like to thank the anonymous reviewer, Carlos Carrasco, and Osiel González for their helpful and constructive comments that greatly contributed to improving the final version of this article.
