The World Health Organization (WHO) established in 2021 an annual health limit of 5μg/m3 for outdoor PM2.5 concentrations (cPM2.5). Our objective was to evaluate the health impact of cPM2.5 in two locations of a large city during 2023. In the first study (South; more socially vulnerable), the 5μg/m3 limit was exceeded 70% of the time. Additionally, 26% of the values were above 15μg/m3. In the second study (Central), this limit (5μg/m3) was exceeded 99% of the time, and 64% of the values were above 15μg/m3. Based on data from both locations (1,149,930 inhabitants over the age of 25), annual lung cancer mortality ranged from 23 to 38 cases (6.7%–8.7%), while mortality from non-communicable diseases ranged from 700 to 854 cases (10.7%–12.3%). The avoidable burden of mortality attributable to annual PM2.5 concentrations justifies the urgent need for their drastic reduction as a public health policy.
La WHO estableció en 2021 un límite anual sanitario de concentración de PM2.5 (cPM2.5) en el ambiente de 5μg/m3. Nuestro objetivo es el evaluar el impacto en salud de cPM2.5 en 2 localizaciones de una gran ciudad durante 2023. En el primer estudio (Sur, más vulnerable socialmente) el 70% del tiempo excedía el límite de 5μg/m3. Además, el 26% de los valores estaban por encima de los 15μg/m3. En el segundo estudio (Central) el 99% del tiempo excedía el límite de 5μg/m3, y el 64% de los valores estaban por encima de los 15μg/m3. Con los datos de ambas localizaciones (1.149.930 habitantes con edad superior a 25 años), la mortalidad anual por cáncer de pulmón oscila entre 23 y 38 casos (6,7-8,7%), mientras que la mortalidad por enfermedades no comunicables oscila entre 700 y 854 casos (10,7-12,3%). La carga de mortalidad evitable atribuible a las concentraciones anuales de PM2.5 justifica la necesidad urgente de su drástica reducción como política de salud pública.
Exposure to fine air particles measuring 2.5μm or less (PM2.5) is associated with various health conditions, including respiratory and cardiac diseases, lung cancer (LC), diabetes, and dementia, among others.1 Although PM2.5 levels have decreased in Europe and Spain in recent decades, the levels recommended by the WHO are frequently exceeded.
The World Health Organization (WHO) established in 2021 an annual health limit of 5μg/m3 for outdoor PM2.5 concentrations (cPM2.5).2,3 Starting in 2024, Europe has approved a reduction of this limit to an annual average of 10μg/m3, though the evaluation threshold for health protection, based on annual averages, is estimated at 5μg/m3.4
The objective of this study is to collect cPM2.5 data throughout the entire year 2023 from two locations within a large city to assess the health impact of exceeding the WHO limits.
Data were obtained from municipal stations located at Plaza Elíptica (South) and Paseo de la Castellana (Central) (Madrid, Spain).5 These data were validated according to international standards.
The health impact of these concentrations and their long-term effects were estimated with the AirQ+ software6 (Supplement A).
To estimate the mortality rates due to COPD, LC, acute lower respiratory infection and non-communicable diseases (ALRI+NCD), data from the Global Burden of Disease (GBD) in the 2021 report by the Institute for Health Metrics and Evaluation (IHME)7 were used. The software used calculates the mortality rate and its confidence intervals (Supplement A).
For cPM2.5, the theoretical minimum risk exposure level was estimated using a uniform distribution with lower and upper bounds set at 2.4 and 5.9μg/m3, respectively (Supplement A).
Population data for the areas – districts near the cPM2.5 measurement sites – were obtained from the Madrid City Council and included individuals aged 25 and older.8 The different steps for this type of calculation are detailed separately (Supplement A).
In the first study (South; more socially vulnerable), the population aged 25 years or older in this area was 640,857 inhabitants (77% over the total population). The mean PM2.5 concentration was 12.4μg/m3 (SD 8.5). The 5μg/m3 limit was exceeded 70% of the time. Additionally, 26% of the values were above 15μg/m3. In total, for 253 days (70%), cPM2.5 levels surpassed the threshold of 5μg/m3. Moreover, 100% of the values were above 2.4μg/m3.
In the second study (Central), the population aged 25 years or older in this area was 509,073 inhabitants (77% of the total population). The mean PM2.5 concentration was 10.2μg/m3 (SD 8.6). In total, during 298 of the 346 days (85.6%), cPM2.5 values were equal to or exceeded 10μg/m3. Additionally, for 342 days (100%), cPM2.5 values surpassed the WHO's health threshold of 5μg/m3.
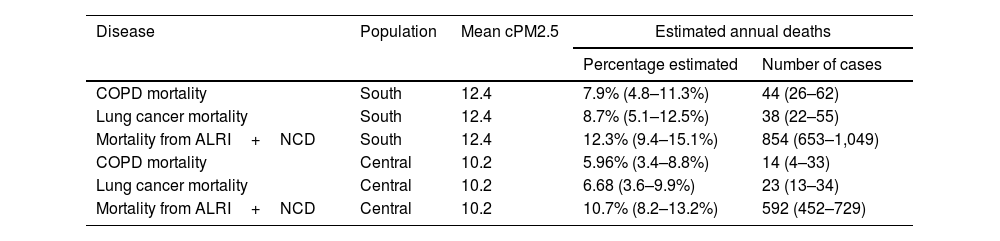
The estimated health impacts of cPM2.5 levels are summarized in Table 1. Based on data from both locations (1,149,930 inhabitants over the age of 25), annual lung cancer mortality ranged from 23 to 38 cases (6.7%–8.7%), while mortality from non-communicable diseases ranged from 700 to 854 cases (10.7%–12.3%).
Estimated health impacts based on the annual averages of cPM2.5 at different locations in the population over 25 years of age.
| Disease | Population | Mean cPM2.5 | Estimated annual deaths | |
|---|---|---|---|---|
| Percentage estimated | Number of cases | |||
| COPD mortality | South | 12.4 | 7.9% (4.8–11.3%) | 44 (26–62) |
| Lung cancer mortality | South | 12.4 | 8.7% (5.1–12.5%) | 38 (22–55) |
| Mortality from ALRI+NCD | South | 12.4 | 12.3% (9.4–15.1%) | 854 (653–1,049) |
| COPD mortality | Central | 10.2 | 5.96% (3.4–8.8%) | 14 (4–33) |
| Lung cancer mortality | Central | 10.2 | 6.68 (3.6–9.9%) | 23 (13–34) |
| Mortality from ALRI+NCD | Central | 10.2 | 10.7% (8.2–13.2%) | 592 (452–729) |
ALRI+NCD: acute lower respiratory infection+non-communicable diseases. Between parentheses, 95% CI.
It has been reported that 99.0% of the mortality burden is due to non-accidental causes, and 99.0% of the mortality burden from non-communicable diseases is associated with cPM2.5 levels below the current U.S. guidelines of 12μg/m3 (more information in Supplement B1).9
The weight of death associated with PM2.5 was disproportionally borne by socioeconomically disadvantaged communities.10 Socially disadvantaged individuals are at greater risk for simultaneously being exposed to adverse social and environmental conditions.
Those who had low socioeconomic status had a higher estimated risk of death from any cause in association with cPM2.5 exposure than the general population. One example of this is when individuals born into social disadvantage experience stress early in life and develop a sensitivity to air pollution characterized by a pro-inflammatory phenotype, while also being more likely to experience higher exposure to air pollution across the lifespan.11
There is a population vulnerability index for different districts of Madrid, which includes their income level.12 The southern districts included in our study rank among the highest (greater vulnerability), while the Central districts rank among the lowest. The districts in the South of Madrid appear to be lower-income areas with high exposure to pollution.
A constant increase in daily mortality was observed as cPM2.5 levels rose, with steeper slopes at lower cPM2.5 concentrations. And this work does not even consider the clinical effects of increases in 1μg/m3 (Supplement B2).
In computerized clinical record databases, it is common to record active, past, or passive smoking habits and occupational risks, but it is not frequent to document the risk of air pollution near high-traffic roads. Clinicians should always inquire about ambient air exposures near their usual residence and engage with the multidimensional issue of climate change.
The WHO encourages the involvement of doctors and professional health organizations to raise awareness among patients, social or political organizations, and social workers regarding adequate levels of air pollutants.2 Especially for individuals or groups more vulnerable due to chronic illness, occupational exposure, smoking, or socioeconomic status. All social determinants of health are included here, highlighting the “invisible” problem of air pollution.
This study has some limitations. An aspect that deserves mention is that if other sensors were placed in other areas within the same districts assigned to the cPM2.5 data, they might yield different, higher, or lower values. The data on the impact on mortality are estimates made using formulas already established by the WHO and IHME. They should be interpreted accordingly (Supplement A). Additionally, they do not include socioeconomic status as a factor to consider. The use of modelled estimates, absence of individual-level data, and possible exposure misclassification should be acknowledged.
In conclusion, there is scientific evidence that exposure to cPM2.5 negatively impacts population health. Overall, the growing body of evidence supports the conclusion that no clearly safe threshold has been established (Supplement B1 and B2).
The avoidable burden of mortality attributable to annual PM2.5 concentrations justifies the urgent need for their drastic reduction as a public health policy.
Declaration of generative AI and AI-assisted technologies in the writing processThe entire manuscript and supplementary material have not been, neither completely nor partially, produced with the help of any generative artificial intelligence software or tool.
FundingThe only funding has been the acquisition of the AIRBEAM3 device by the Coordinadora Vecinal Distrito Latina (COVELA) and the Asociación Madres por el Clima Lourdes. This research did not receive any specific grant from funding agencies in the public, commercial, or not-for-profit sectors.
Authors’ contributionsAll authors have contributed equally to the concept, revision, writing and editing of this work.
Conflicts of interestThe authors declare not to have any conflicts of interest that may be considered to influence directly or indirectly the content of the manuscript.
The following are the supplementary data to this article: