


The United States is the biggest energy consumer in the world, accentuating its energy security priorities in twenty-first century geopolitics. As an alternative to oil, shale gas has modified today’s economic and global political scenario, providing Washington with new capabilities for redesigning its national and foreign energy policies toward innovative, self-sufficient development. The U.S. economy is highly dependent on energy resources; however, in the last decade, the shale revolution has aided it in gaining relative economic stability in a volatile global economy. Shale gas has encouraged economic development in the North American region, while raising important environmental concerns about the extraction process called hydraulic fracturing or “fracking.”
Estados Unidos es el mayor consumidor de energía en el mundo, lo que recalca sus prioridades de seguridad energética en la geopolítica del siglo xxi. El gas de lutita, como un recurso alternativo al petróleo, ha modificado los escenarios político y económico actuales. Le ha dado a Washington nuevas posibilidades de rediseñar sus políticas energéticas exteriores y nacionales para que se enfoquen en un desarrollo innovador y autosuficiente. La economía estadounidense es muy dependiente de los recursos energéticos; sin embargo, la revolución del gas de lutitas ha ayudado a Estados Unidos a adquirir una estabilidad económica relativa dentro de una economía global volátil. El gas lutitas ha estimulado el desarrollo económico en la región norteamericana, mientras que aumenta inquietudes importantes respecto a su proceso de extracción, llamado fractura hidráulica o fracking.
We’re proving that it is possible to grow our economy robustly while at the same time doing the right thing for our environment and tackling climate change in a serious way.
The world’s largest consumer of natural gas has found a way to deal with energy security and self-sufficiency in the first part of the twenty-first century by enhancing a new energy option in the United States: shale gas. Although oil continues to play a central role in the international energy market, the United States has doubled its production over the last six years and is now importing less (The Economist, 2014). This has, in part, affected the international price of oil as it has dropped to less than half from June 2014 at US$115 a barrel to US$53 in April 2015, almost to levels of the 2009 recession (The Economist, 2014; Bloomberg Business, 2015). The U.S. has increased its energy portfolio by using shale gas as a wildcard in the global energy game to offset geopolitical scenarios and it’s challenging the rules by transforming part of the world’s energy production and consumption.
As the United States positions itself in the global energy market, it also faces the task of overcoming environmental issues linked to the generation of electricity, energy, and fossil fuels. Since 2008, the Obama administration has increased energy efficiency by adopting an environmental policy to combat climate change. A highly efficient energy policy requires not only economic support, but also a sustainable long-term plan to achieve energy security. “This has been a team effort to make sure that we are doing everything we can to boost the energy efficiency of the American economy” (Obama, 2015). Even though renewable energy sources are still financially inefficient, the combination of conventional and renewable energy sources such as solar and wind, has had an impact on U.S. American environmental policy. In order to achieve ambitious environmental goals, the administration has instituted cutting greenhouse gas emissions 40 percent from the 2008 levels over the next decade and a 30-percent increase of federal renewable energy sources within the next 10 years (Obama, 2015).
Due to the low permeability of the shale rock formation, the extraction of this unconventional gas employs hydraulic fracturing of the rocks, or “fracking,” a combined process of vertical and horizontal drilling, which injects liquids at high pressure and induces seismicity to break the formation and releases the gas. In the past few years, it has become a controversial topic in countries that are rich in the resource. Supporters of shale gas production argue that it diminishes CO2 greenhouse gas emissions in the long term compared to other fossil fuels. Others (David Hughes, Robert Howarth, Robert Jackson) point out that this practice creates a great demand for water, produces sizable quantities of wastewater, induces seismicity, releases methane greenhouse gas emissions, and pollutes groundwater.
President Barack Obama launched several bills regarding sustainability including the 2011 Blueprint, which outlined striving for sustainable development through clean, affordable, abundant, diverse, and secure energy sources; and the 2015 Department of the Interior (doi) drilling rules on federal lands, which requires companies to ensure that the wells are safe and to disclose the chemicals used in the process. To regulate the environmental impact caused by fracking, the doi rules represent an important standardization of the shale gas extraction technique: “The oil and natural gas industry has played a critical role in reviving [U.S.] America’s economy and hydraulic fracturing has been the key to this revival” (Warrick, 2015). Obama’s 2015 energy policy highlights the relevance of the shale gas revolution as a transitional energy resource, or a bridge, to a renewable energy portfolio.
Blueprinting North America’s Energy SecurityIn 2011, President Barack Obama launched the U.S. Blueprint for a Secure Energy Future and stated: “Our best opportunities to enhance our energy security can be found in our own backyard —because we boast one critical, renewable resource that the rest of the world can’t match: American ingenuity, American know-how.” Shale gas is currently leading the United States toward a “golden age of gas” as it aims to become a net exporter of energy by the year 2020, according to the Energy Information Administration (eia).1 The shale gas boom is currently changing the rules of the game by transforming energy security in the North American region and by turning toward a new extractable resource.
Some authors go as far as to state that “shale gas will revolutionize the industry –and change the world– in the coming decades. It will prevent the rise of any new cartels. It will alter geopolitics” (Myers and Hartley, 2011). The combined unconventional energy resources of the three North American countries (the United States, Canada, and Mexico) outweigh by far those of any other country, positioning the region as the number one energy powerhouse of the twenty-first century. “North America is on its way to being a net exporter of energy. The implications for geopolitical developments are vast. North America will have security of supply no matter what happens in the Middle East or elsewhere” (Shultz, 2013).
The United States and Canada are the only major producers of commercially viable natural gas from shale formations in the world; shale gas as a share of total natural gas production in 2012 was 39 percent in the U.S. and 15 percent in Canada (eia, 2013). Mexico started to push shale gas development more actively in light of the initial eia assessment in 2011 that suggested a resource base of 19 272.3 billion cubic meters, a volume approximately 57 times larger than the country’s proved reserves of natural gas in 2010 (Lozano Maya, 2013).2 Mexican shale is now a sought-after commodity as basins have reached 15 423.5 billion cubic meters in 2014; Mexico has an estimated 545 trillion cubic feet of technically recoverable shale gas resources (eia, 2014d). Although Mexico’s shale gas industry faces important challenges such as lack of infrastructure, insecurity, and uncertainty about the shale formations, technological advances in the hydraulic fracturing extraction process provide the country with the opportunity to match the regional energy perspectives, to create new jobs, to attract investment, and to increase competitiveness in the energy sector.
National deposits will provide the U.S. with a constant energy supply for the next 100 years (Obama, 2011). By 2035, the eia projects that shale gas production will rise to 384.9 billion cubic meters (bcm), representing nearly half of all U.S. natural gas production. In 2012, capital expenditure on unconventional oil and gas activity in the United States surpassed US$87 billion, providing 1.7 million jobs; it is projected to reach US$172.5 billion in 2020, representing 3 million jobs, and more than US$353 billion in 2035 (3.5 million jobs) (IHS Global Insight, 2012). The shale gas revolution is changing the energy balance in favor of shale-rich and technologically advanced countries and will continue to build on future financial projections as energy becomes the most valuable resource in the twenty-first century.
The Economic Giant: The United States“For some time, many people at home and abroad have bought into the myth of American decline, and increasing dependence on energy imports was often cited as evidence” (Nye, 2014). Despite numerous authors who argue the decline of the United States as a superpower (Eland, 2004; Chomsky, 2006; Johnson, 2007; Pollina, 2010; Buchanan, 2011; Ferguson, 2012), it is far from a weakening economic power. The U.S. is the biggest single-country economy in the world with a gdp of US$16.8 trillion in 2013 and a purchasing power parity (ppp)3 of 18.6 percent of the global total, only below the European Union as a whole (World Bank, 2014a). It is the world’s third largest country in size and population, with almost 319 million people (United States Census Bureau, 2014 estimate) and holds the number one place in military expenditure with US$640 billion in 2013 (sipri, 2013). The U.S. economy grew 2.8 percent in 2012, 1.9 percent in 2013, and is projected to reach 1.7 percent in 2014 and 3 percent by 2015 (International Monetary Fund, 2013).
The United States is ranked third –behind only Japan and Germany– in the United Nations Competitive Industrial Performance Report 2013, which measures a country’s ability to produce and export manufactured goods competitively and shows the impact of its industrial production on the world market (unido, 2013). It is the nation with the highest research and development tax incentives, direct support, and business research and development intensity. “Cheaper energy makes industry more competitive internationally, particularly energy-intensive industries like petrochemicals, aluminum, steel, and others” (Nye, 2014). The U.S. remains the world’s richest large country, with an estimated per capita gdp of US$45 000, while the richest European nations manage only around a US$40 000 gdp per capita (The Economist, 2010).
Being on the top of global economic growth translates into consuming large quantities of energy resources. “We consume about 25 percent of the world’s oil. We only have 2 percent of the reserves. So the only way for America’s energy supply to be truly secure is by permanently reducing our dependence on oil” (Obama, 2011). The United States has approximately 2.3 percent of the world population and consumes almost 20 percent of the world’s energy (eia, 2013). Its consumption is more than that of the UK, Germany, China, Iran, Japan, and Canada combined (Enerdata, 2014b). By 2035, shale gas production will rise to 385.1 million cubic meters, representing nearly half of all U.S. natural gas production. Just 28.3 billion cubic meters of natural gas is enough to heat 15 million homes for one year, generate 100 billion kilowatt hours of electricity, or fuel 12 million natural-gas-fired vehicles for one year (U.S. Department of Energy, 2012).
While energy statistics continue to show negative outputs, Washington continues to strive toward energy efficiency. President Barack Obama pointed out in the launching of the United States 2011 Energy Blueprint, “America’s oil and natural gas supplies are critical components of our nation’s energy portfolio. Their development enhances our energy security and fuels our nation’s economy” (Obama, 2011). The United States is the number one natural gas consumer in the world, absorbing 735 billion cubic meters (bcm) in 2013, compared to Russia’s 464 bcm and China’s 160 bcm (Enerdata, 2014a). The Obama administration recognizes that consumption of these fuels will continue despite environmental concerns, and that alternative energy sources are needed to meet the demand.
Shale gas is still, after all, a hydrocarbon. The climate change debate on the environmental impact of hydraulic fracturing on greenhouse gas emissions is a major issue (see Casler, 2014). On the one hand, traditional fossil fuel consumption such as oil emits CO2 into the air. Yet, shale gas extraction releases methane, an aggressive heat-trapping agent, into the atmosphere. Issues of wastewater management and induced seismicity in the extraction process have also been raised.
The Geopolitical Importance of Shale GasWith an established industry in the United States and Canada and growing markets in other nations such as Australia, Argentina, China, and European countries (see Figure 1), the shale gas market will see a capital expenditure of US$41.43 billion in 2014 (Visiongain, 2014).4 The main issue, however, is not only having the resource but being able to extract the supply with the corresponding technology and know-how. For example, 70 percent of Chinese energy consumption comes from coal; however, shale gas extraction across its territory could dramatically reduce this percentage (David, 2013). Taking into account the size of China’s economy, the global energy markets could rapidly be influenced when China starts extracting shale gas.

2013 Basins with Assessed Shale Oil and Shale Gas Formations55 Basins with assessed shale oil and gas formations are a bounded area where the rock boundaries dip inward toward the center and have an official estimate amount of shale oil and/or gas.
China and Russia have also signed a 30-year, US$400-billion gas deal for 38 billion cubic meters in May 2014, giving Moscow a mega-market for its leading export and linking two major powers that, despite a rocky history of alliances and rivalries, have drawn closer to counterbalance the clout of the United States and Europe (Perlez, 2014). President Vladimir Putin is boosting diplomatic and bilateral relations with Beijing in order to secure one of the biggest energy regions in the world. Despite recent U.S. foreign policy efforts to shift toward the Asia Pacific region, Russia continues its energy agreements not only with China but also with countries such as Uzbekistan and Turkmenistan. While Russia and China are aiming to achieve Eurasian energy security, a North American regional energy agreement could rapidly have a positive impact for U.S. foreign policy (Jacoby, O’Sullivan, and Paltsev, 2012:190).
Foreseeing the twenty-first century demand around the world, President Barack Obama launched an energy approach to deal with energy security and global economic stability by 2020 (White House, 2011). This document analyzed the United States’ energy past in order to build its future, concluding that global market tendencies are unstoppable as is its move toward world leadership. Washington confirms U.S. America’s continued world presence to ensure global economic and political stability (White House, 2011). U.S. foreign policy has been adapting to these new energy alternatives by decreasing its military presence in certain regions like the Middle East, while the shale gas boom sustains the idea of creating a North American region that satisfies both green development and energy security.
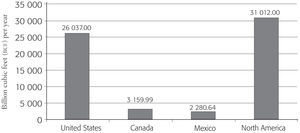
In an economically volatile world, the U.S. has turned to its natural neighbors and allies in North America: Canada and Mexico. Canada and the U.S. possess 54 percent of viable natural gas in the region,6 which could increase if efficient shale gas extraction becomes a reality. North American shale represents an opportunity for U.S. economic leadership in the world (Fitterling, 2013). The regional impact of this unconventional gas across Mexico, Canada, and the United States may be the first step toward the integration of North America as a single energy power zone (Fitterling, 2013:4-6). Table 1 shows the countries with technically recoverable shale gas resources, and the United States, Canada, and Mexico make up 50 4589 billion cubic meters (bcm), more than Russia and China combined.
Top 10 Countries with Technically Recoverable Shale Gas Resources (2013)*
| Rank | Country | Shale gas (billion cubic meters) | Shale gas (trillion cubic feet) |
|---|---|---|---|
| 1 | China | 31 554.5 | 1 115 |
| 2 | Argentina | 22 696.6 | 802 |
| 3 | Algeria | 20 008.1 | 707 |
| 4 | U.S. | 18 819.5 | 665 |
| 5 | Canada | 16 215.9 | 573 |
| 6 | Mexico | 15 423.5 | 545 |
| 7 | Australia | 12 367.1 | 437 |
| 8 | South Africa | 11 037 | 390 |
| 9 | Russia | 8 065.5 | 285 |
| 10 | Brazil | 6 933.5 | 245 |
| World Total | 163 121.2 | 7 299 | |
| North American Total | 50 458.90 | 1 783 |
According to the Energy Information Administration (2013), when considering the market implications of abundant shale resources, it is important to distinguish between a technically recoverable resource and an economically recoverable resource. Technically recoverable resources represent the volumes of oil and natural gas that could be produced with current technology, regardless of oil and natural gas prices and production costs.
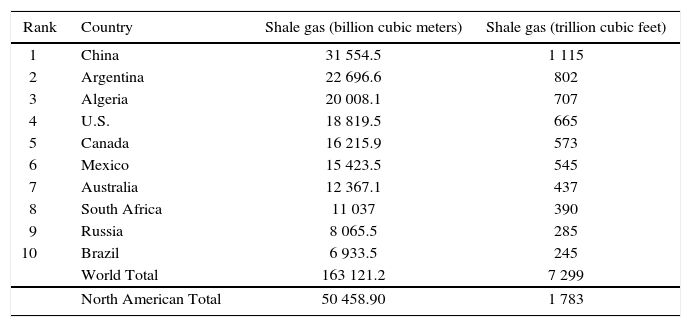
Since natural gas markets are considerably less internationally integrated than global oil markets, the fast growth in shale gas production since 2006 has pointedly lowered natural gas prices in the U.S. and Canada compared to prices elsewhere, according to the eia. In 2013, the production of natural gas in the U.S. was 24 282 billion cubic feet (bcf) (see Graph 1), yet consumption still shows a deficit with an average consumption of 26 037 billion cubic feet (bcf) (see Graph 2) (Enerdata, 2014b). With the exception of 2009, gas consumption increased for the twelfth year in a row in 2013. It rose at a rate of 2.8 percent per year, in line with the historical average of 2.7 percent (Forbes, 2009). This trend was mainly driven by U.S. demand, which represents one-third of G-20 consumption, with a 4.6 percent increase boosted by the use of shale gas (Enerdata, 2014a).
")
Natural Gas Production (Selected Countries, 2013)
")
Natural Gas Consumption (Selected Countries, 2013)
Canada is one of the world’s five largest energy producers and one of the top natural gas producers, with 5,128.83 billion cubic feet (bcf) in 2013, and the main source of U.S. energy imports.7 In 2011, Canada’s energy exports were valued at US$120 billion, with 90 percent going to the U.S. in natural gas exports, representing 13 percent of U.S. consumption (Government of Canada, 2013). In 1980, technological development in horizontal drilling became commercially available in Canada, increasing its productive capacity not only in shale but also in conventional resources such as natural gas and oil (Government of Canada, 2013). The bilateral relationship between Canada and the United States has changed since U.S. shale basins have now become economically recoverable, transforming the North American region from a consumption giant to a major production area. Table 5 shows a total combined production of 30 798 billion cubic feet (bcf) in 2012. The economic partnership among these nations has the power to boost the regional economy (McCallum, 2011).
In December 2013, Mexico passed several constitutional reforms mostly related to the energy sector, striding toward energy efficiency and the technology it requires. These reforms have advantages for both Mexico and the United States: with private investment in alliance with the state-owned oil company, Petróleos Mexicanos (Pemex),8 production will reinforce the notion of a North American regional powerhouse, while the Mexican energy sector will gain technological development. In coming years, the Mexican energy market has the capacity to reduce energy prices and increase its national production (Government of Mexico, 2014).
Economic Factors in Energy Security in North America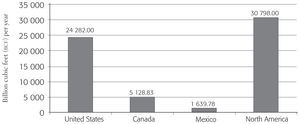
Energy plays a vital role in U.S. Americans’ lives and in the U.S. economy as a whole, particularly in the provision of electricity, transportation, heating and cooling, and industrial processing, the four main energy-consuming sectors of the economy. These four sectors consumed the equivalent of 8.4 percent of the gross domestic product (gdp) in 2010. Petroleum products power 97 percent of all air, sea, and land transportation in the United States, making it extremely dependent on energy resources (McFarlane, 2012).
Due to the complexity, uncertainty, and investment involved in shale gas production, cost reduction is vital to increasing the supply. While the cost of a vertical well is approximately US$800 000 the amount increases to US$2.5 million or more for a horizontal well (Lozano Maya, 2013). In this case, unlike other markets where monopolies often guide production or are responsible for it, the U.S. oil extraction industry is owned by a large number of producers, predominantly medium-sized and small.
With a shale gas structure, producers’ decisions are less restricted and more productive and flexible, thus creating an environment that favors the development and transfer of technology. Additionally, the economic benefit from the production of shale gas is important. It could take time to create a competitive market for means of transportation, and it will entail dedicated guidance for the U.S. to put an end to oil’s virtual monopoly of transportation fuel. Making oil compete with alternative energy commodities has not only lowered its international price but has also begun to change the geopolitical balance of power in favor of net oil importers and governments with the resources to become non-petroleum fuel producers.
Price deregulation is another key element of the industry, since greater reciprocity exists between price movements and producers’ activity, transmitting market signals to agents more efficiently. In the same way that the 164-percent increase in net Henry Hub prices from 2002 to 2008 triggered the production of shale gas (Berman, 2012),9 more recently, as the gap between the price of natural gas and the price of oil tightens due to the latter’s contraction, it still encourages investors to capitalize their resources and concentrate efforts on sites with higher content of liquids.
The gas industry’s competitiveness extends to prices, which are deregulated and encourage a more effective dissemination of information amid producers and clients (Lozano Maya, 2013). Since 1980 when policies were applied to deregulate gas prices and through the ultimate creation of the Henry Hub (see Graph 5) as a reference for spot and future transactions, producers have been extremely responsive to gas prices. Consequently, shale gas production flourished in reaction to the steady growth in gas prices from 2000 despite the fall of prices starting in 2009.10
")
Shale Gas Production in the United States and the Henry Hub Price (2000–2011)
Finally, the legal system of land use that allows private ownership of hydrocarbons has accelerated the total area under production. Unlike most countries, where oil is owned by the government, in the United States, citizens who own property with shale gas resources can sell them for a profit or lease their land to gas-producing companies. Private ownership of these lands allows individuals to decide to sell in order to receive royalties for the resources.
Shale Gas as an Alternative Energy Source for the United StatesEver since the 1973 Arab oil embargo, one U.S. president after another has paid at least rhetorical attention to the need for the federal government to develop an energy independence policy (Barlas, 2012). Black gold dominated the energy scenario during the twentieth century, and natural gas production was originally forecast to decrease by 2025 (eia, 2014b). According to the eia, in 2013, U.S. energy production supplied 84 percent of its total consumption due primarily to oil restraints, an extremely important figure to consider at the microeconomic level. Shale gas as an unconventional natural resource increased the energy power of the U.S. vis-à-vis its local consumption and U.S. American world leadership. According to the Massachusetts Institute of Technology Emissions Prediction and Policy Analysis (mit-eppa), shale gas has the strength to modify more than one policy inside the U.S. government as it has the power to build new outstanding links to the environment, the economy, and foreign policy (see Graph 6).
")
Impact of Shale Gas on Estimates of U.S. Resources and Proved Reserves (2003–2010)
The North American region has one of the biggest shale gas formations in the world, just under the size of the Siberian-Chinese gas reserves (eia, 2013). It is transforming the entire region into a new energy power giving the three countries financial and economic strength. The main fields in the U.S. are the Barnett, Haynesville, Fayetteville, and Woodford shale in Texas, Louisiana, Arkansas, and Oklahoma, along with the Marcellus Play under parts of the states of Pennsylvania, West Virginia, and New York (see Figure 2).

The Marcellus Play is the largest producing shale gas basin in the United States (see Figure 3 and Graph 7), exceeding 15 billion cubic feet per day (bcf/d) in July 2014, thus accounting for 40 percent of U.S. production (eia, 2014e). It has developed infrastructure and, therefore, the capacity to sustain well drilling and pipeline network construction beyond those built in recent years (eia, 2014e). This will provide natural gas to highly populated areas in the United States such as New Jersey, New York, and New England.

Shale Gas Plays in the United States*
 (2013 and 2014)")
U.S. Natural Gas Production by Play (Million Cubic Feet/Day) (2013 and 2014)
The economic dimension lies in how Marcellus Play productivity helps boost local economies. Thus, the country’s reliance on importing natural gas from other international producers decreases. At the same time, Marcellus meets the economic approach via pipeline construction. Each time pipelines intersect, a new market hub has to be established and price rate changes (Standard and Poor’s, 2012). Finally the key role of the Marcellus Play addresses two major issues: the first is its ability to drive local companies in reaching transnational operations; and second, it helps strengthen the transnational impact of U.S. oil and gas companies.
“Fracking” in the United StatesThe two extraction methods for shale gas are horizontal drilling and hydraulic fracturing, known as “fracking.” Due to the geological heterogeneity of the shale deposits,11 optimization of production in the United States has relied on applying specific methods depending on the complexity of the basins and sites with different depths and recovery factors (see Figure 4). This indicates the level of uncertainty in shale exploitation, in that the risk of not producing gas is higher compared to conventional reservoirs because it requires greater technological and human capacity.

Schematic Geology of Natural Gas Resources
The “fracking” process consists of injecting fluids (mainly water), sand, and chemical agents into the layer formation at high pressure, causing fissures that allow resources to move freely from the rock pores where they are trapped. Conventional extraction of fossil fuels uses coal resources over several drilling pads, with a negative impact on the environment and global warming. Shale gas drilling, on the other hand, is done through a single pad site, thus reducing the surface presence of access roads, trucks, and pipelines (Energy from Shale, 2013). Since coal fuel use decreases in the process of hydraulic fracturing, the CO2 footprint is also reduced.
A major point of contention in the current “fracking” debate is the issue of leaked methane gas, CH4 (Jackson et al., 2011). Shale gas contains around 90 percent of methane gas, which is odorless, colorless, and tasteless. Methane has a global warming potential (gwp) 21 times higher per metric ton than CO2,12 causing a resistant and very powerful radiation trap in the atmosphere, creating a much higher impact on the greenhouse effect (epa, 2014). “Burn natural gas and it warms your house. But let it leak, from fracked wells or the melting Arctic, and it warms the whole planet” (Lavalle, 2012).
Another environmental impact associated with the development of shale gas is related to water; first, the possibility of the use, treatment, and recycling of the water, or “flow-back” water, containing among other products the fluids injected into the well to fracture the rock. The water is mixed with approximately 70 chemicals, some considered toxic, mutagenic, and carcinogenic (Schmidt, 2011: 350). According to the U.S. Environmental Protection Agency (epa, 2014), only 15 percent to 80 percent of the flow-back water is recovered, creating additional concerns. Secondly, the process requires considerable volumes of water and varies depending on the geological characteristics of the deposit. It is estimated that 35 000 wells are fractured in the United States annually, representing approximately the amount of water used by some five million people (Schmidt, 2011: 352). There is also environmental concern about the contamination of groundwater, or aquifers, in the extraction process as methane is liberated from the shale formations through induced fracturing (see Figure 5).

Other factors to consider in the exploitation and extraction of shale gas are the intensive transfer of supplies and equipment to battery production, emissions from mobile sources, the levels of road traffic noise, disruption in the environment, and seismicity due to the fracking technique. It is fundamental, therefore, to establish adequate protection and control of the drilling sites. Since the useful life of the wells is shorter, it is necessary to maintain more intensive production-level drilling, which involves greater delivery capacity. This approach has been favored in the United States due to the availability of comprehensive infrastructure for natural gas including an extensive network of pipelines, underground storage, and liquefied natural gas. U.S. companies use intensive infrastructure for the production of this resource, which facilitates the exploitation, transformation, and transportation of shale gas resources.
The Energy Information Administration defines economically recoverable resources as those “that can be profitably produced under current market conditions” (eia, 2013). The economic recoverability of oil and gas resources rest on three factors: the expense of drilling and completing wells, the quantity of oil or natural gas obtained from an average well over its lifetime, and the prices recovered from oil and gas production. Current experience with shale gas in the U.S. and other countries shows that economic recoverability may be considerably influenced by above-ground aspects along with geology. The main positive above-ground benefits in the United States and Canada include private ownership of sub-surface rights, which provide solid encouragement for development; obtainability of numerous independent operators and supporting contractors with relevant expertise and appropriate drilling rigs; pre-existent gathering and pipeline infrastructure; and the availability of water resources for use in hydraulic fracturing.
Also, the oil industry has been able to meet the specific needs of shale gas production in the field of logistics and support services, such as horizontal drilling equipment, pumping equipment, water treatment, trucking for freight and equipment, and water and injected fluids (see Graph 8). According to Enerdata’s Global Energy Statistical Yearbook 2014, the United States ranks third in crude oil production, followed by Canada in sixth place, and Mexico in tenth.
")
U.S. Rotary Drilling Rig Count for Oil and Gas Production by Type (2000-2011)
In the United States, production of shale gas and, more specifically, the environmental effects of hydraulic fracturing, had not been subject to federal regulation until the March 2015 Department of the Interior drilling rules for federal lands were published. Environmental issues and controversies about water, however, are confined mainly to local authorities.13 This, coupled with producers’ cooperation with the communities where they operate and royalty and pumping payments to citizens whose property they rent, have helped reduce the social resistance compared to other countries –Canada being in one of them– where the environmental factor or social impacts represent the main obstacles to producing shale gas.
ConclusionsGlobalization embeds new environmental challenges as global warming and its repercussions have created economic and political concerns with major impacts on energy policies around the world. The United States’ economy has adapted to and survived global disruptions in great part due to its ability to innovate. While Russia and China use oil and gas to negotiate geopolitically, the U.S. has turned to shale gas as its twenty-first-century tool of empowerment in energy security. “There has been a tectonic shift in the geopolitics of energy, but it was not the Russia-China gas pipeline deal” (Nye, 2014).
The Obama administration has indicated that shale gas reduces carbon emissions thus helping the environment, yet major concerns exist about methane emissions and water contamination, putting it still a long way from reaching complete green energy development. “With more research and incentives, we can break our dependence on oil with biofuels, and become the first country to have a million electric vehicles on the road by 2015” (White House, 2011:15). It is important to emphasize, nonetheless, that the 2015 regulation of the fracking method in the United States is part of the legitimization of this technique. Despite pressure by environmentalists, shale gas is seen by the U.S. government as an important bridge between conventional energy resources and sustainable development for achieving a greener future in the long run.
The twenty-first-century environmental paradigm has modified international concern regarding the energy industry; even though shale gas is a fossil fuel, U.S. technological developments and regulations allow for a more controlled extraction. President Barack Obama has pointed out with regard to U.S. energy needs, “We have [found] natural gas. But … we’ve got to make sure that we’re extracting natural gas safely, without polluting our water supply” (2011). United States industry has improved its performance by using shale gas efficiently, while local shale transportation reduces financial costs, as in the case of the Marcellus Play. Shale gas has become an important contributor to U.S. American economic industrial growth.
A North American energy alliance may increase the level of engagement among Mexico, Canada, and the United States. Geography and economic treaties like nafta already bind these countries together; more importantly, shale gas is found across the North American region. While the three countries have very different legal structures regarding the energy sector, a strategic alliance would transform them into the world’s biggest energy region with vast resources and the technology to extract, process, and transport shale gas.
Energy security and shale gas do not represent the end of U.S. involvement in regions like the Middle East or with opec nations, but rather imply a broader range of action on a global scale. Having found a new fossil fuel to complement its energy consumption without being constrained to foreign energy diplomacy, the United States continues to defend its energy position and sustain its values in the international arena. However, it is not a final solution in the U.S. American security portfolio. The importance of shale gas lies in providing the United States enough time to develop and affordable, sustainable strategy. Attaining energy security is not an isolated goal for the U.S.; it is an important part of its geopolitical strategy in the twenty-first century.
Finally, although it might not be the ultimate solution to U.S. energy security, shale gas has provided the country with more time to develop an affordable energy strategy and sustainable alternative technologies in the future. As Joseph Nye has outlined, achieving security is part of a bigger geopolitical shift: economically, shale gas lowers U.S. energy imports and stabilizes the financial market by boosting national energy investments; and, politically, energy independence allows Washington to extend its sphere of influence around the globe. The United States will continue to face off against other nations such as China and Russia as political contenders in the world arena as energy security becomes increasingly more critical in our time.
We gratefully acknowledge the support provided for this project by YaleGlobal at the MacMillan Center for International and Regional Studies at Yale University and the Tecnológico de Monterrey.
Basins with assessed shale oil and gas formations are a bounded area where the rock boundaries dip inward toward the center and have an official estimate amount of shale oil and/or gas.
The eia is the principal agency of the U.S. Federal Statistical System responsible for collecting, analyzing, and disseminating energy information to promote sound policymaking, efficient markets, and public understanding of energy and its interaction with the economy and the environment. The eia is part of the U.S. Department of Energy.
Proven oil and gas reserves are the quantities of oil and gas that, by analyzing geoscience and engineering data, can be estimated with reasonable certainty to be economically producible from a given date forward, from known reservoirs, and under existing economic conditions, operating methods, and government regulations (Independent Petroleum Association of America, 2014).
Gross domestic product (gdp) refers to the value of all final goods and services produced within a nation in a given year. Purchasing power parity (ppp) is the use of standardized international dollar price weights to determine the value of goods and services produced in a given economy.
Capital expenditure or “capex” refers to the money spent by a company to acquire or upgrade physical assets such as property, industrial buildings, and equipment. This tends to be a very large expense for companies with significant manufacturing facilities.
Viable natural gas from an economic perspective is the natural gas that has a long-term survival and is able to provide sustainable profits over a period of time.
A quarter of Canada’s gdp is represented by exports to the U.S., and key industries such as car and truck manufacturing are integrated across North America for all practical purposes. Canadian and U.S. capital markets are inextricably linked through institutional arrangements, fund flows, interest rates, exchange rates, and stock markets (McCallum, 2011)
Petróleos Mexicanos (Pemex) is Mexico’s largest company and one of the biggest in Latin America. In 2012, total revenues amounted to Mex$1.647 trillion (US$125 billion), earning a net operating income of Mex$905 billion (US$69 billion), and investment reached Mex$311 billion (US$24 billion) (Pemex, 2014).
The Henry Hub price refers to spot and future natural gas prices set at the Henry Hub gas distribution pipeline in the United States, denominated in $/mmbtu (millions of British thermal units) and normally seen as the primary price set for the North American natural gas market. North American unregulated wellhead prices are closely correlated to those set at Henry Hub.
During the 2008 economic crisis, oil prices dropped by over two-thirds since their peak in July of that year. Slower economic activity brought less demand for oil, and this was sufficient to completely reverse the market.
Shale gas can be found in fine-grained sedimentary rocks including sandstone, limestone, and shale.
The U.S. Environmental Protection Agency stipulates that certain greenhouse gases create more global warming than others. These are defined with two specific characteristics: 1) the global warming potential (gwp), or how well the gas absorbs energy in a 100-year lapse; 2) how long it remains in the atmosphere. For example, carbon dioxide has a gwp of 1 and methane of 21, which means that methane has 21 times the warming effect as CO2 over 100 years.
The Department of the Interior rules apply only to oil and gas drilling on federal lands, or about a quarter of the country’s current fossil-fuel output. At least four times as many fracking operations are carried out on private or state land, where they are subject to local regulations, ranging from stringent to non-existent.