


Multiple system atrophy is a rare and fatal neurodegenerative disorder, characterized by autonomic dysfunction in association with either parkinsonism or cerebellar signs. The pathologic hallmark is the presence of alpha-synuclein aggregates in oligodendrocytes, forming glial cytoplasmic inclusions. Clinically, it may be difficult to distinguish form other parkinsonisms or ataxias, particularly in the early stages of the disease. In this case series we aim to describe in detail the features of MSA patients.
Material and methodsUnified MSA Rating Scale (UMSARS) score, structural and functional imaging and cardiovascular autonomic testing, are summarized since early stages of the disease.
ResultsUMSARS proved to be useful to perform a follow-up being longitudinal examination essential to stratify risk of poor outcome. Neuropathological diagnosis showed an overlap between parkinsonian and cerebellar subtypes, with some peculiarities that could help to distinguish from other subtypes.
ConclusionA better description of MSA features with standardized test confirmed by means of neuropathological studies could help to increase sensitivity.
La atrofia multisistémica es un trastorno neurodegenerativo raro y letal que se caracteriza por una disfunción autonómica en asociación con parkinsonismo o signos cerebelosos. La marca anatomopatológica es la presencia de agregados de α-sinucleína en los oligodendrocitos, que forman inclusiones citoplasmáticas gliales. Desde un punto de vista clínico, puede ser difícil de distinguir de otros parkinsonismos o ataxias, particularmente en las primeras etapas de la enfermedad. En esta serie de casos, nuestro objetivo es describir en detalle las características de los pacientes con atrofia multisistémica.
Material y métodosSe resumen los datos objetidos de la puntuación de la Escala de calificación unificada de la atrofia multisistémica (UMSARS), imágenes estructurales y funcionales y las pruebas autonómicas cardiovasculares realizadas desde las primeras etapas de la enfermedad.
ResultadosLa escala UMSAR demostró ser útil para hacer un seguimiento: el examen longitudinal esencial fue para estratificar el riesgo de peor evolución. El diagnóstico neuropatológico mostró un solapamiento entre los subtipos parkinsoniano y cerebeloso, con algunas peculiaridades que podrían ayudar a distinguir los subtipos.
ConclusiónUna mejor descripción de las características de la atrofia multisistémica en casos confirmados mediante neuropatología podría ayudar a aumentar la sensibilidad del diagnóstico.
Multiple System Atrophy (MSA) is a rare and rapidly progressive neurodegenerative disorder that is characterized by a combination of parkinsonism, cerebellar impairment and autonomic dysfunction.1 Patients are divided into MSA-Parkinsonism (MSA-P) or MSA-Cerebellar (MSA-C) depending on the predominance of parkinsonism or cerebellar symptoms.2 The current diagnostic criteria also distinguish between levels of certainty, differentiating definite MSA for subjects with autopsy demonstration, probable MSA for patients with autonomic failure plus parkinsonism or cerebellar ataxia, and possible MSA for people with sporadic, progressive adult-onset disease including parkinsonism or cerebellar ataxia and one autonomic feature plus other clinical or neuroimaging abnormality.1
In 1969, Graham and Oppenheimer first introduced the term MSA to encompass the pathological entities of olivopontocerebellar atrophy, striatonigral degeneration, and Shy-Drager syndrome on the basis of the neuropathological findings in these disorders.3 The neuropathological hallmark of the disease is the presence of alpha-synuclein (α-synuclein) aggregates in oligodendrocytes forming glial cytoplasmic inclusions4,5 (Papp-Lantos bodies),4 observed in all types of oligodendroglia that contain aggregates of misfolded α-Synuclein, however GCIs are present not only in known atrophic areas but also in areas without atrophy such as the cortex. Hence, MSA is a oligodendroglial α-synucleinopathy. Macroscopically, MSA is characterized by striatal atrophy and depigmentation of the substantia nigra. In some cases, striatal degeneration is histological without macroscopic atrophy. These findings are associated with olivopontocerebellar atrophy, which may be macroscopically evident. The neuropathology of sporadic MSA also includes varying degrees of demyelination and atrophy, especially in the cerebellum, pons and medulla, the loss of pigmented cells in the substantia nigra pars compacta and the classic MSA microscopic oligondendroglial inclusion pathology.6 The neuronal loss is mainly present in the putamen, substantia nigra, pons, inferior olive, and cerebellum,7 which involves striatonigral or olivopontocerebellar structures. Loss of Purkinje cells affects mainly the vermis and gliosis and neurodegeneration are observed in the pons and cerebellum.
The etiology is still unknown and the origin of α-synuclein deposits and its role in the pathophysiology of the disease is still unclear. Other relevant aspects regarding the pathogenesis of MSA are neuroinflammation, mitochondrial dysfunction, oxidative stress and impaired autophagy and insulin resistance.8 The diagnosis of MSA is based on a medical history and neurological examination. Diagnostic criteria have been described1,9 and recently some of the critical issues have been reviewed in order to achieve a better sensitivity.10 Ancillary investigations help to support the diagnosis and complete the differential diagnosis, but specificity and sensitivity of current diagnostic criteria are not high enough. In this regard, biomarkers could help as to increase sensitivity and specificity.11 Although Magnetic Resonance Imaging (MRI) can be normal in MSA, especially in the early stages of the disease,12 volume measures of different regions has been performed to discriminate MSA from PD with 100% accuracy13 and some signs such as the “hot cross bun” can be suggestive.14 Due to the heterogeneity of clinical phenotype and lack of specific biomarkers, it is challenging to make a correct diagnosis of MSA.15
We here review the main features of a large retrospective series of cases with MSA, with the aim of describing clinical and neuropathological findings of MSA, to try to improve sensitivity and specificity of the current diagnostic criteria from early stages.
MethodsWe retrospectively studied 51 MSA patients, who were referred to the Movement Disorders Unit, Hospital Universitario de Cruces (Barakaldo, Vizcaya), from 2000 to 2019, with parkinsonism, ataxia, autonomic failure or multiple system atrophy diagnosis and met MSA criteria. Established MSA criteria1 were applied by senior investigators to include patients in the study. Therefore, patients with probable or possible MSA-P or MSA-C were included. We also included three definite MSA who had post-mortem confirmed diagnosis. Neuropathological study was performed following the standard protocol from the Biobank. Other cases with adult onset ataxia or parkinsonism, not meeting criteria at the end of follow-up, despite of suspicion, were excluded from the analysis. The local Ethics Committee approved the research protocol (CEIC E09/25).
Data collection from the medical records included demographic and clinical data, and assessments such as neurological examination, UMSARS (Unified Multiple System Atrophy Rating Scale), and response to Levodopa (l-Dopa). Clinical features were assessed by means of UMSARS, including functional status (UMSARS I), neurological deficits (UMSARS II), autonomic examination (UMSAR III) and disability status (UMSARS-IV). We performed UMSAR scale at baseline in all patients and at 2 years follow-up in 28 patients. The age at onset was defined as the age of the first symptom, according to medical records. In case of death, date and cause of death was obtained. At the autonomic disorders unit, we systematically assess patients with MSA diagnosis by means of the UMSARS part I (a functional subscale to score symptoms and ability to undertake activities of daily living), UMSARS II (neurological motor evaluation), Autonomic examination and UMSARS IV (global disability scale).
Conventional neuroimaging based on MRI was performed at baseline for all patients to rule out other diagnoses and complete differential diagnosis, using a 3T scan. MRI images were available in 40 patients. In 31 patients with parkinsonism 123I-metaiodobenzylguanidine (MIBG) scintigraphy was performed to establish the differential diagnosis with idiopathic Parkinson's Disease (PD). We analyzed the early (15min) and late (4h) heart-to-mediastinum uptake ratios (HMR). We selected healthy controls who had undergone MIBG scintigraphy as routine screening for suspicion of neurovascular dysautonomia, not confirmed.
Statistical analysesDemographics and clinical variables were described in order to characterize our population cohort. Survival analysis was performed in both groups separately, depending on the subtype (parkinsonian vs cerebellar form of MSA), and the Kaplan-Meier curves were used to estimate the cumulative survival probability. All statistical analyses were performed using the Statistical Package for the Social Sciences (SPSS, version 24.0, Chicago, Illinois, USA). We used Cox hazards models to calculate hazard radios for shorter survival. Data are shown as mean and standard deviation.
ResultsFifty-one patients with a clinical diagnosis of possible (n=7) or probable (n=44) MSA according to the current diagnostic criteria1 were evaluated. Regarding subtype, 32 patients (62.7%) were diagnosed as MSA-cerebellar and 19 patients (37.3%) were diagnosed as MSA-parkinsonian. The mean age for all subjects included was 62±8 years. Overall, there were 23 women, with no differences in sex distribution when analyzing all the cases, whereas by subtype there were significant differences in groups classification (p<0.05), as there were more women in the MSA-P group. Globally, disease duration was 6.9±3.9 years, from the first symptom to death. Both groups (MSA-P and MSA-C) had similar ages of disease onset (60.65±6.873 vs 62.63±8.469 years old) and similar disease duration (7.4±4.1 vs 6.6±3.8 years), with no statistically significant differences (p>0.05). As expected, all MSA-C patients had cerebellar signs and 100% of MSA-P patients had parkinsonism. Nevertheless, both groups of patients developed concomitant cerebellar and parkinsonian symptoms. In detail, 89.5% of MSA-P patients developed cerebellar signs, whilst 63% of patients from MSA-C group had at least one parkinsonian sign. l-Dopa therapy was given to all the subjects, 56% of MSA-C and 84% of MSA-P had poor response to l-Dopa treatment.
In this series of MSA patients, 54% of the subjects died during the follow-up, 10 from the MSA-P group and 17 MSA-C subjects. Mean time (months) from diagnosis to death was 68.65 (±30) (Fig. 1). Regarding causes of death, pneumonia was the most common cause of dead (66%), specifically aspiration pneumonia (33%), and other infectious diseases (22%) were the main causes of death among patients with MSA.

Patients with MSA-P and MSA-C had similar status at baseline, there were no differences in UMSARS score between MSA subtypes; mean UMSARS I 26.02 (±6.9); UMSARS II 25.49 (±7.1); UMSARS IV 3.26 (1±1.4). (Table 1). By items, only rigidity (increased tone in limbs), rapid alternating movements of hands and posture were statistically significant different (p<0.05) between both subtypes, with worse scores for MSA-P group in these items, at baseline. There were no differences between parkinsonian and cerebellar forms of MSA in terms of autonomic examination at baseline. At this stage, no correlations were observed between the magnitude of Systolic Blood Pressure Difference (ΛSBP), and Diastolic Blood Pressure Difference (ΛDBP), Heart Rate (ΛHR) supine-standing, and UMSARS-I, -II or -IV (Table 2).
UMSARS I, II, IV in both subtypes of MSA.
| Overall (N=51) | MSA-P (n=19) | MSA-C (n=32) | p-Value | |
|---|---|---|---|---|
| Sex | 0.008 | |||
| Women | 28 | 15 | 13 | |
| Men | 23 | 4 | 19 | |
| Age | 61.94±7.936 | 60.65±6.873 | 62.63±8.469 | 0.18 |
| UMSARS I | 26.02±6.991 | 25.19±7.4 | 26.52±6.82 | 0.55 |
| UMSARS II | 25.49±7.163 | 26.75±6.25 | 24.74±7.66 | 0.39 |
| UMSARS IV | 3.26±1.416 | 3.06±1.43 | 3.37±1.41 | 0.78 |
UMSARS, Unified MSA Rating Scale, section I: disease-related impairments; II: motor examination, IV global disability scale.
Descriptive analysis of autonomic examination. Data from UMSARS-III.
| n=14 | Mean±SD | Range |
|---|---|---|
| BPSSu | 141.86±26.156 | 115.701–168.013 |
| BPDSu | 83.93±12.294 | 71.634–96.013 |
| HRSu | 75.92±11.265 | 64.658–87.189 |
| BPSSt | 119.62±30.999 | 88.617–150.614 |
| BPDSt | 73.23±14.906 | 58.325–88.137 |
| HRSt | 76.31±25.273 | 51.035–101.581 |
| SBPD | 22±25.242 | −3.242–47.242 |
| DBPD | 9.92±13.931 | −4.008–23.854 |
| Dif HR Su-St | −5.42±5.534 | −10.951–0.118 |
UMSARS, Unified MSA Rating Scale, section III: autonomic examination; BPSSu, Systolic blood pressure supine; BPDSu, diastolic blood pressure supine; HRSu, heart rate supine; BPSSt, Systolic blood pressure standing; BPDSt, diastolic blood pressure standing; HRSt, heart rate standing; SBPD, Systolic blood pressure drop on standing; DBPD, Diastolic blood pressure drop on standing; Dif HR Su-St Difference of heart rate supine-standing.
During the two-years follow-up, a statistically significant worsening was observed (p<0.05) in both groups; UMSAR I 34.47 (±5.1); UMSAR II 31.69±5.7); UMSAR IV 4.53 (±0.6). By items, during follow-up, we observed worse scores in all the UMSAR I items (p<0.05) except orthostatic symptoms and bowel function. In UMSAR II there were statistically significant differences in all the items between baseline and after 24 months evaluation, except for action tremor and rigidity (Fig. 2 on Appendix A - supplementary data).
MRI resultsResults were compatible with MSA in 35/40 patients and unspecific in 5 patients. Slit like hyperintensity of the lateral putaminal border (Hyperintense Putaminal Rim Sign), hot cross bun sign, mesencephalic, putaminal or cerebellar atrophy was described in these cases. It is remarkable that findings were compatible with MSA-C in 3 patients with parkinsonian phenotype and in 1 patient with cerebellar phenotype the MRI showed parkinsonian findings.
Quantitative neuroimaging with MRI volumetry at baseline was also performed. Indices of neurodegeneration in the putamen, middle cerebellar peduncle (MCP), pons, and cerebellum were obtained. MCP atrophy was present in 25% MSA-C patients and was absent in MSA-P patients. Putamen atrophy was detected only in 12.5% MSA-P patients, whereas no MSA-C patients showed atrophy in the putamen. Pons atrophy was described in 75% patients with MSA-C but none of the MSA-P. Mesencephalic atrophy was described in 25% of MSA-P patients but none of the MSA-C patients. Cerebellar atrophy was present in all MSA-C cases and also in 2 MSA-P cases.
MIBG resultsMIBG turned out to be consistent with MSA diagnosis in 22 cases, 15 patients with MSA-C and 7 with MSA-P. MIBG analyses showed no differences between MSA patients and healthy controls (p>0.05). The mean value of late (4h) HMR MIBG uptake was 1.60±0.37. A total of 9 patients showed cardiac sympathetic denervation, 3 patients had MSA-C and 6 with MSA-P, according to 1.60 threshold for normality used in our hospital. We observed that there was less sympathetic denervation in MSA patients than in PD patients (late H/M uptake ratio: 1.75±0.3 in MSA patients vs. 1.3±0.3 in PD patients, p<0.05) (Table 3). These patients with cardiac denervation were diagnosed with MSA because they met MSA diagnostic criteria and MRI findings were compatible with MSA.
Demographic data, frequency of diabetes, disease duration and MIBG uptake ratios for early and delayed scintigraphy images in healthy controls, multisystem atrophy and idiopathic Parkinson's disease.
| HC | MSA | iPD | |
|---|---|---|---|
| n | 34 | 25 | 43 |
| Age | 66±9 | 63±7.5 | 68±5.5 |
| Sex | 17M 17W | 11M 14W | 23M 20W |
| DM | 5 | 2 | 5 |
| Disease duration | 0 | 3±2 | 7±6 |
| HMR15_LEHR | 1.8±0.2 | 1.9±0.4 | 1.45±0.3 |
| HMR4h_LEHR | 1.8±0.25 | 1.75±0.3 | 1.3±0.3 |
HC, healthy control; MSA, multiple system atrophy; iPD, idiopathic Parkinson disease. M, men; W, women; DM, diabetes mellitus; HMR15_LEHR, heart to mediastinum uptake ratios at 15min, with low-energy high-resolution collimator; HMR4h_LEHR, Heart to mediastinum uptake ratios at 4h, with low-energy high-resolution collimator.
MSA-P patient presented a rapidly progressive rigid-akinetic syndrome, with poor response to l-Dopa and marked autonomic dysfunction. DAT-SCAN showed asymmetric loss of dopamine transporter activity and MIBG uptake was normal. Both MSA-C cases presented cerebellar ataxia with parkinsonism and autonomic features and cerebellar and striatal atrophy was found. All cases had parkinsonian signs and striatonigral degeneration was observed. As expected, MSA-C phenotype had olivopontocerebellar predominant degeneration. In this regard, it is worth mentioning the fact that in MSA-P case striatonigral degeneration was isolated, without macroscopically cerebellar atrophy. Atrophy was predominant in the putamen and substantia nigra in the MSA-P case, but also observed in the reticular formation, periaqueductal gray and subthalamic nucleus. Gliosis, astrogliosis and atrophy was observed in all these areas accompanied by small iron deposits. MSA-P showed striatal atrophy and substantia nigra and locus coeruleus denervation, whereas both MSA-C cases had only slight striatal atrophy. All cases had glial cytoplasmic inclusions, observed in the cerebellum of MSA-C cases, and in the striatum and substantia nigra in MSP-P cases, with overstimulated astroglia and microglia. Glial α-synuclein inclusions were observed in subthalamic nucleus, substantia nigra, mesencephalon and lenticular nucleus, being these aggregates ubiquitin and p62 immunoreactive. Co-pathology can be present in some cases, beta-amyloid deposits in MSA-C cases, nevertheless it is important to note that both MSA-C cases were older than the MSA-P patient. Finally, in one of the MSA-C cases, α-synuclein deposits were present also in astrocytes and oligodendrocytes in the putamen and globus pallidus (Table 4).
Neuropathological findings in MSA-C and MSA-P patients.
| MSA-C | MSA-P | |
|---|---|---|
| Neuronal loss | Olivopontocerebellar | Strionigral |
| Gliosis | Cerebellum, striatum, pons and dentate nucleus | |
| Depigmentation in the ventrolateral substantia nigra | √ | √ |
| Neuronal loss and gliosis in the pontine nucleus | √ | |
| Neuronal loss with gliosis in the lateral putamen | √ | √ |
| Iron deposits in the putamen | √ | |
| Demyelination in the cerebellar white matter | √ | |
| Glial cytoplasmic inclusions | Cerebellum | Striatum and substantia nigra |
| Neuronal cytoplasmic inclusions in the hippocampus, beta-amyloid deposits | √ | |
| Hippocampal atrophy | √ | |
| α-Synuclein immunoreactivity | STN, SN, mesencephalon and lenticular nucleus | |
| TDP-43 | Negative | Negative |
STN, subthalamic nucleus; SN, substantia nigra; TDP, TAR-DNA-binding protein-43.
Multiple system atrophy is a rare, fatal, neurodegenerative disorder with symptoms of autonomic failure associated with parkinsonism, cerebellar ataxia, or both. According to the consensus criteria, in our cohort 63% of the patients were classified as cerebellar subtype. The frequencies of cerebellar and parkinsonism-predominant cases in this population are different from the European registry (Table 5), where the majority of patients have MSA-P,16 whereas the olivopontocerebellar-predominant pathology was more frequent in Japanese MSA.17 The reason for this discrepancy could be that patients with cerebellar subtype are more commonly referred to our autonomic disorders unit, whereas parkinsonian phenotype is less frequently referred. The majority of patients with MSA-P were females, whereas among MSA-C there were no differences in sex, as described in other series.
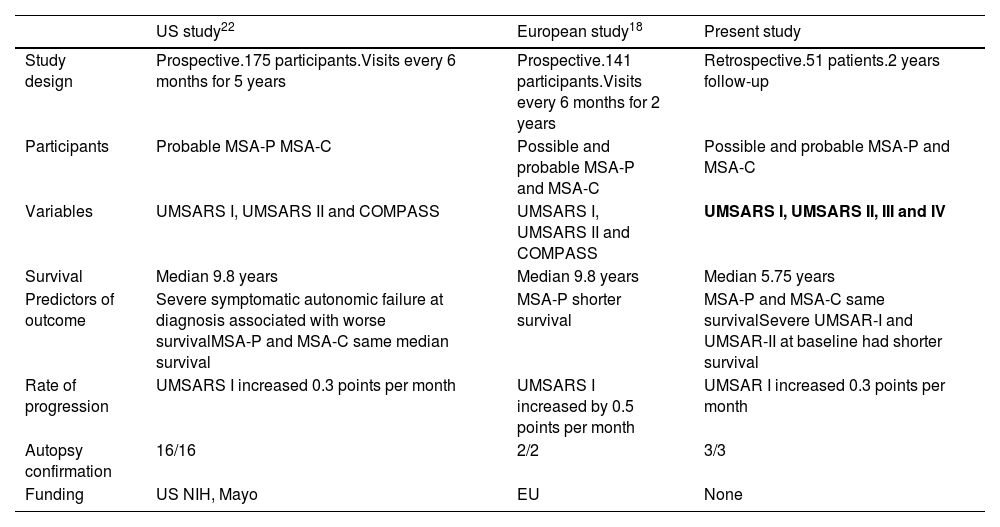
Natural history in US and European studies.
| US study22 | European study18 | Present study | |
|---|---|---|---|
| Study design | Prospective.175 participants.Visits every 6 months for 5 years | Prospective.141 participants.Visits every 6 months for 2 years | Retrospective.51 patients.2 years follow-up |
| Participants | Probable MSA-P MSA-C | Possible and probable MSA-P and MSA-C | Possible and probable MSA-P and MSA-C |
| Variables | UMSARS I, UMSARS II and COMPASS | UMSARS I, UMSARS II and COMPASS | UMSARS I, UMSARS II, III and IV |
| Survival | Median 9.8 years | Median 9.8 years | Median 5.75 years |
| Predictors of outcome | Severe symptomatic autonomic failure at diagnosis associated with worse survivalMSA-P and MSA-C same median survival | MSA-P shorter survival | MSA-P and MSA-C same survivalSevere UMSAR-I and UMSAR-II at baseline had shorter survival |
| Rate of progression | UMSARS I increased 0.3 points per month | UMSARS I increased by 0.5 points per month | UMSAR I increased 0.3 points per month |
| Autopsy confirmation | 16/16 | 2/2 | 3/3 |
| Funding | US NIH, Mayo | EU | None |
We here show that MSA-C and MSA-P patients have similar clinical characteristics, with no differences at baseline in clinical evaluation by means of UMSARS total score. At baseline, patients with MSA-P showed worse scores in parkinsonian items compared to MSA-C patients. It is interesting to highlight here that at least one parkinsonian sign was reported in 63% of MSA-C patients, being rigidity, rapid alternating movements and posture statistically significate different when comparing MSA-P with MSA-C (p<0.05). MSA-P cases showed cerebellar signs in a large number of cases, indicating that probably cerebellar features are less specific. In this line, cerebellar atrophy was present not only in MRIs from MSA-C cases but also in some MSA-P cases. The neuropathological study in MSA-P cases showed subthalamic atrophy and gliosis in the substantia nigra and locus coeruleus although volumetric MRI imaging did not show alterations.
We have found a similar natural history in both MSA-C and MSA-P, with a wide overlap in signs and symptoms between both subtypes, from baseline. As previously described and expected, parkinsonism and Cerebellar forms are characterized by a predominance of parkinsonism with striatonigral pathology and cerebellar ataxia with predominant olivopontocerebellar pathology.18 Nevertheless, due to the overlap and the clinical heterogeneity in phenotypes the neuropathological study is still essential to make an accurate diagnosis. One limitation of the study is the retrospective analyses that could have introduced some bias. To minimize bias, we have described clinical assessments based on diagnostic tests and specific neurological scales. Data from the UMSARS-III (autonomic examination) are in concordance with previous descriptions,19 highlighting the importance of autonomic tests when suspected diagnosis. The clinical assessment was performed systematically and follow-up time was similar to that in other prospective studies.20 After two years of follow up, we observed a mild, but significant worsening, indicating the fast progression of the disease in both subtypes (p<0.05). Interestingly, MSA-C patients respond poorly to l-Dopa but there was a 28% of patients with mild l-Dopa response. In the MSA-P group only one patient had a good response to l-Dopa.23 This could be explained by the fact that among MSA-C, parkinsonian signs were mild, it could be hypothesized that mild striatal atrophy among MSA-C patients would contribute to a better response to l-Dopa in this group of patients. MSA-P patients group, showed more severe parkinsonian features, accompanied by cerebellar signs in the majority of patients, without improvement after l-Dopa treatment was initiated. Another limitation of the study could be the absence of genetic studies in this cohort, in future studies it would be interesting to investigate which genes are related with the disease or predispose to the condition. In our cohort there is a subgroup of patients with initially Pure Autonomic Failure (PAF) diagnoses and progression to MSA, as previously reported approximately 8% of patients developed MSA after 4 years follow-up.21 This group could increase the heterogeneity of the cohort, but we should certainly include them in the natural history of MSA to better characterize the clinical spectrum of patients with MSA diagnosis.10
The mean time to death from diagnosis was 5.6 years (Median 5.7 years±2.5). Compared with other series,20 time to death is shorter in this study. A selection bias might be present because patients were referred when a probable diagnosis is reached. Rate of mortality was the same among both subtypes, with no differences between MSA-C and MSA-P (Fig. 1). Overall, the main cause of death was pneumonia, associated with bronco-aspiration in many cases, due to early dysphagia.2 When analyzing hazard ratios for shorter survival, we observed that patients with severe UMSAR-I and UMSAR-II score at baseline had a shorter median survival. MSA-P has been reported as more aggressive in an European cohort22 (Table 5). In our cohort median survival and clinical status were similar both in MSA-P and MSP-C, as described in other cohorts.20
Neuropsychological tests were performed, but different tests were used over the years, not being comparable. This is one important aspect that we should include in future descriptions, following a necessary general consensus. Neuropsychological assessment should be included since the beginning of the disease in future prospective studies, to better characterize this group of patients.24 Another important aspect is the lack of peripheral or fluid biomarkers, not available at the moment,25,26 that could help to differentiate MSA cases from PD cases. In the absence of other biomarkers, MIBG scintigraphy is useful in some cases, however, MRI findings seems to provide higher accuracy to distinguish between PD and MSA. In our series, 9 patients with MSA diagnosis had cardiac sympathetic denervation. In some cases MIBG did not match with clinical nor neuropathological phenotype, as we previously described.27 In fact, one of the MSA-C cases was neuropathologically confirmed and MIBG showed cardiac denervation. In this case, there was a massive loss of neurons in the substantia nigra, with reactive gliosis and the cerebellum (dentate nucleus) was massively depopulated.
ConclusionIn conclusion, in our cohort there is a substantial overlap of parkinsonian and cerebellar features, from early stages of the disease. In fact, 89.5% of MSA-P patients developed cerebellar signs, and 63% of patients with MSA-C had at least one parkinsonian sign. Existing diagnostic criteria have a low sensitivity at the early stages of the disease probably due to this overlap, which agrees with mixed neuropathological findings. Efforts should focus on early stages, to increase sensitivity and specificity.
Rigidity, alternating movements of hands and posture were significantly different between groups at baseline, while there were no differences in autonomic examination. After 2 years of follow-up there were differences in all the items between baseline and after 24 months evaluation, except for action tremor and rigidity. As we here report, UMSARS performed at baseline and follow-up could be helpful to rate prognosis from early diagnosis. Finally, UMSARS, including autonomic function testing, could be useful to differentiate between MSA-C and MSA-P.
Authors’ contributionsMCA and JGE have contributed with conception and design of the research. BT, KB, MA, IG have contributed with acquisition of data. RP, AM and MCA have contributed with the analyses. JGE supervised the manuscript. All authors discussed the results and implications and commented on the manuscript at all stages.
Standard protocol approvalPatients had been informed that their data may be used for scientific purposes and had given their informed consent.
Availability of data and materialsThe data that support the findings of this study are available from the corresponding author, upon reasonable request.
FundingNo funding has been received for this work.
Conflict of interestThe corresponding author confirms on behalf of all authors that there have been no involvements that might raise the question of bias in the work reported or in the conclusions, implications, or opinions stated.
The authors declare that they have not conflict of interest.
We acknowledge the Nuclear Medicine and Radiology Department for their support during this research.
The following are the supplementary data to this article: