


Repetitive transcranial magnetic stimulation (rTMS) has been used as a potential treatment for tinnitus; however, its effectiveness is variable and unpredictable. We hypothesized that resting-state functional connectivity before rTMS may be correlated with rTMS treatment effectiveness.
MethodsWe applied 1-Hz rTMS to the left primary auditory (A1) and dorsolateral prefrontal cortices (DLPFC) of 10 individuals with tinnitus and 10 age-matched controls. Resting-state functional magnetic resonance imaging (fMRI) studies were performed approximately one week before rTMS. Seed-based connectivity analyses were conducted for each individual, with seed regions as rTMS target areas.
ResultsCompared to controls, the left superior temporal areas showed significantly increased positive connectivity with the left A1 and negative connectivity with the left DLPFC in the tinnitus group. The left frontoparietal and right cerebellar areas showed significantly increased negative connectivity with the left A1 and positive connectivity with the left DLPFC. Seed-based hyperconnectivity was correlated with tinnitus improvement (pre-rTMS vs. 2-week post-rTMS Tinnitus Handicap Inventory scores). Tinnitus improvement was significantly correlated with left A1 hyperconnectivity; however, no correlation was observed with left DLPFC connectivity. Positive rTMS outcomes were associated with significantly increased positive connectivity in bilateral superior temporal areas and significantly increased negative connectivity in bilateral frontal areas.
ConclusionsOur results suggest that oversynchronisation of left A1 connectivity before rTMS of the left A1 and DLPFC is associated with treatment effectiveness.
La estimulación magnética transcraneal repetitiva (EMTr) se ha utilizado como posible tratamiento para los acúfenos, aunque su efectividad es variable e impredecible. Planteamos la hipótesis de que existe una correlación entre la conectividad funcional en estado de reposo antes de aplicar EMTr y la efectividad de dicho tratamiento.
MétodosAplicamos EMTr a 1 Hz sobre la corteza auditiva primaria (A1) y la corteza prefrontal dorsolateral (CPFDL) izquierdas de 10 pacientes con acúfenos y 10 controles del mismo rango de edad. Se realizaron estudios de resonancia magnética funcional (RMF) en estado de reposo de todos los pacientes aproximadamente una semana antes de la EMTr. En cada caso, se construyó un mapa de conectividad basado en las ROIs, en el que las ROIs eran las áreas que se tratarían con la EMTr.
ResultadosLa región temporal superior izquierda mostró una conectividad positiva significativamente mayor con el área A1 izquierda y mayor conectividad negativa con la CPFDL izquierda en los pacientes con acúfenos que en los controles. Además, las áreas frontoparietal izquierda y cerebelar derecha mostraron una conectividad negativa significativamente superior con el área A1 izquierda y mayor conectividad positiva con la CPFDL izquierda. La hiperconectividad de las ROIs se correlacionó con mejoría de los acúfenos según las puntuaciones pre-EMTr y 2 semanas post-EMTr en la escala Tinnitus Handicap Inventory. La mejoría de los acúfenos se correlacionó de manera significativa con la hiperconectividad del área A1 izquierda; sin embargo, no se encontró correlación con la conectividad de la CPFDL izquierda. El resultado favorable del tratamiento con EMTr se asocia con una mayor conectividad positiva en áreas temporales superiores de ambos hemisferios y con mayor conectividad negativa en áreas frontales bilaterales.
ConclusionesNuestros resultados sugieren una correlación entre la hipersincronización de la conectividad del área A1 izquierda antes de la aplicación de EMTr en la A1 y CPFDL izquierdas y la efectividad de dicho tratamiento.
Tinnitus is an auditory phantom perception, caused by enhanced neural activity due to the imbalances in the excitatory and inhibitory inputs to central auditory neurons.1 In this regard, repetitive transcranial magnetic stimulation (rTMS), which is a non-invasive brain stimulation technique, can be used as a potential treatment for tinnitus.2,3 Specifically, low frequency rTMS suppresses cortical excitability similar to long-term depression.2,4 However, the effect of rTMS in individuals is varied and cannot be predicted before treatment.
Individual differences in various domains, such as cognitive function, emotion, and even abnormal neurological or psychiatric characteristics, can be accounted for by individual resting-state functional connectivity.5 Resting-state functional connectivity has been suggested as a potential biomarker predicting therapeutic treatment outcomes in patients with major depression.6 In the previous studies, individuals with tinnitus showed greater functional connectivity between limbic and cortical regions as well as auditory and attentional processing regions compared to healthy controls.7 Hyperactivity of resting-state functional connectivity has been also revealed in tinnitus group especially in the auditory network.8 However, the question remains as to whether the pre-rTMS functional connectivity can predict rTMS effectiveness.
Based on previous studies, we hypothesized that individuals with tinnitus have significantly different resting-state functional connectivity compared to that of healthy controls. In particularly, pre-rTMS regional connections could be related to rTMS outcomes, which may facilitate appropriate treatment strategies for patients. Individuals with tinnitus who have over-synchronized functional connections before rTMS would be the best candidates for the treatment, because their greater functional connectivity would be suppressed by rTMS.
To examine the hypotheses, we applied rTMS to individuals with tinnitus and acquired resting-state fMRI data a week before rTMS. Sequential rTMS of the left A1 followed by the dorsolateral prefrontal cortex (DLPFC) was applied in this study. To inhibit auditory cortex hyperactivity, rTMS was generally delivered to the temporal or temporo-parietal cortical areas.9 Frontal cortex stimulation has been shown to enhance rTMS outcomes.10,11 In particular, the DLPFC integrates sensory information12 and is involved in the top-down control network, which is often reported as having deficits in tinnitus group.13 Seed-based functional connectivity was examined with seed regions as rTMS target areas (i.e., the left A1 and DLPFC).
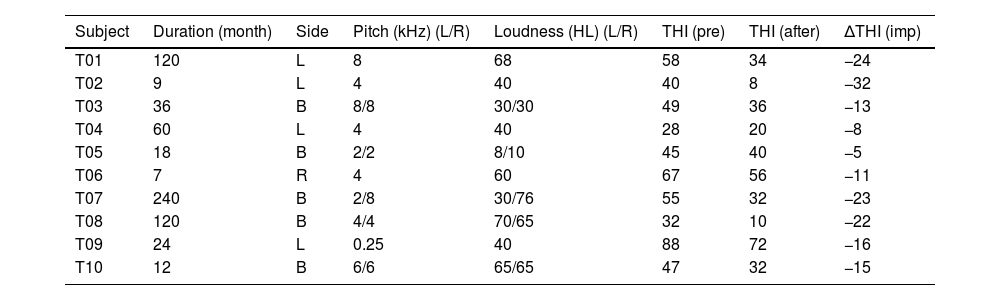
Material and methodsParticipantsTen individuals with tinnitus (5 men; mean age, 49.7±12.2 years) participated in this study. These individuals experienced chronic subjective tinnitus for more than six months and had hearing thresholds <55dB in three frequencies (500-Hz and 1- and 2-kHz) and <90dB in the 4- and 8-kHz frequencies. We excluded patients with cardiac pacemakers or other electronic implants, such as a cochlear implant. Moreover, patients with objective tinnitus or tinnitus with a treatable cause as well as those with a personal history of a central nervous system disorder, head injury, stroke, otologic disease, serious heart disease, or another unstable major medical condition were excluded from the study. Patient tinnitus handicap inventory (THI) scores were obtained before and two weeks after rTMS. Table 1 lists detailed patient information, including their tinnitus characteristics (i.e., duration, spatial lateralization, loudness, and pitch).
Demographic and clinical characteristics of individuals with tinnitus.
| Subject | Duration (month) | Side | Pitch (kHz) (L/R) | Loudness (HL) (L/R) | THI (pre) | THI (after) | ΔTHI (imp) |
|---|---|---|---|---|---|---|---|
| T01 | 120 | L | 8 | 68 | 58 | 34 | −24 |
| T02 | 9 | L | 4 | 40 | 40 | 8 | −32 |
| T03 | 36 | B | 8/8 | 30/30 | 49 | 36 | −13 |
| T04 | 60 | L | 4 | 40 | 28 | 20 | −8 |
| T05 | 18 | B | 2/2 | 8/10 | 45 | 40 | −5 |
| T06 | 7 | R | 4 | 60 | 67 | 56 | −11 |
| T07 | 240 | B | 2/8 | 30/76 | 55 | 32 | −23 |
| T08 | 120 | B | 4/4 | 70/65 | 32 | 10 | −22 |
| T09 | 24 | L | 0.25 | 40 | 88 | 72 | −16 |
| T10 | 12 | B | 6/6 | 65/65 | 47 | 32 | −15 |
T, tinnitus patient; L, left; R, right; B, bilateral; HL, hearing level; THI, tinnitus handicap inventory; pre, pre-treatment; after, after-treatment; imp, improvement; ΔTHI, THI score 2 weeks after treatment – THI scores before treatment.
Ten age-matched normal controls (4 men; mean age, 50.3±12.8 years) were also included in the study. The controls did not suffer from hearing-related diseases and had no history of neurological or psychiatric disorders. They had no issues with hearing or communicating with others.
All participants gave informed consent as required by the Hospital. The present study was approved by the local institutional review board (1212-081-451) and was conducted according to the tenets of the Declaration of Helsinki. This study was previously registered at Clinical Trials on May 28, 2013 (NCT01886092). All study procedures were performed in accordance with the approved guidelines.
Image acquisitionApproximately one week before rTMS, structural and resting-state fMRI data from the patients were obtained using a 3T scanner (Magnetom Triotim; Siemens, Erlangen, Germany) with eyes-closed condition. The participants were asked to stay awake and rest without thinking anything. Structural T1 images were acquired with a 3D Turbo-FLASH sequence, and 208 – acquired sagittal slices covered the whole brain with a matrix size of 256×256mm2 and voxel size of 1mm3. The TR was 1670ms, TE was 1.9ms, and field-of-view (FOV) was 250mm. For the fMRI data, the number of total volumes was 116. With interleaved acquisition, 35 slices covered the whole brain with a matrix size of 128×128 mm2 and voxel size of 1.88×1.88×4.20mm3. The TR was 3500ms, TE was 30ms, and flip angle was 90°. The FOV was 240mm.
The structural and fMRI data of the controls were obtained using a Siemens Biograph mMR 3T scanner (Siemens Healthcare Sector, Erlangen, Germany). Structural T1 images were acquired with a spoiled grass gradient-recalled 3D MRI sequence, and 208 – acquired sagittal slices covered the whole brain with a matrix size of 256×256mm2 and voxel size of 0.98×0.98×1mm3. The TR was 1670ms, TE was 1.89ms, and FOV was 250mm. For the fMRI data, the number of total volumes was 116, and 35 slices covered the whole brain with interleaved acquisition. The matrix size, TR, TE and flip angle were the same as those of the patients with tinnitus. The voxel size was 1.88×1.88×3.5mm3 and FOV was 240mm.
Procedure for rTMSDuring four consecutive days, 1-Hz rTMS (MagPro; Medtronic, Minneapolis, MN) was delivered with a figure-of-eight coil (MCF-B65, 90-mm outer diameter; Medtronic) to the left A1 and DLPFC with 2000 and 1000 pulses, respectively.11 The coil was navigated to the A1 by a neuronavigation system (Cybermed; In2vision, Seoul, Korea). NeuroTMS software (Cybermed) was used to co-register the head probe and structural MRI data of each patient. The structural MRI and stereotaxy-based neuronavigation system allowed the TMS coil to navigate to the surface of the skull overlaying the MRI-based A1. Previously, we located Heschl's gyrus by first finding the transverse temporal gyrus.14 The left DLPFC was based on the 10–20 EEG-coordinated F3 position.15
The stimulation intensity was set to 110% of the resting motor threshold (RMT). The RMT was defined as the lowest intensity producing motor evoked potentials ≥50μV in amplitude on at least four out of eight consecutive stimulations while the investigated muscle was at rest using the right pollicis brevis.16 The train duration and stimulation off-time were 40 and 20s, respectively.
Image preprocessingThe fMRI data were preprocessed using the FSL (v. 5.0.7, https://fsl.fmrib.ox.ac.uk/).17 The first 4 volumes were discarded to eliminate T1 relaxation effects. The remaining data were corrected for slice timing for interleaved image acquisition, and the head motion, using the first volume as the reference and six degrees-of-freedom rigid body registration.18 The non-brain voxels of the structural images were removed, and affine co-registration was done using the functional MR images and the skull-stripped brain images. The co-registered functional MR images were normalized to the standard template using linear and nonlinear transformations, and spatially smoothed with full width at half maximum 6mm. After that within-run intensity normalization was done to a whole brain median value of 1000. The whole brain median value was estimated using the images masked by the gray matter tissue prior map thresholded at probability >0.1, and whole brain tissue prior map provided in SPM12 thresholded at probability >0.3. Wavelet despiking was done to denoise the spatial and temporal motion artifacts.19 The average values of cerebrospinal fluid, white matter, and the six motion parameters were regressed out using the general linear model (GLM). A bandpass filter was set to 0.01<f<0.1Hz.
Image analysesImage analyses were conducted with Statistical Parametric Mapping (SPM8; http://www.fil.ion.ucl.ac.uk/spm/) and MATLAB (v. 7.12.0). For group comparisons of seed-based functional connectivity, the seed regions were defined as the left A1 and superior frontal cortex (i.e., the DLPFC) from the Automated Anatomical Labeling (AAL) template (http://www.cyceron.fr/web/aal__anatomical_automatic_labeling.html). These regions were the rTMS target areas. The correlation between the averaged blood oxygen level-dependent (BOLD) signal of the voxels of the left A1 or DLPFC and the whole brain were examined using a GLM. Contrast t-maps were converted to z-maps, and the z-maps were divided into positive and negative maps to test for group differences in seed-based connectivity, with age as a nuisance variable.
To identify connectivity associated with tinnitus improvement, the associations between tinnitus improvement and the functional connectivity of the left A1 or DLPFC were examined. Because of the small number of samples, the Wilcoxon signed-rank test was used to compare the THI scores before and two weeks after rTMS. The ΔTHI (i.e., two weeks post-rTMS THI score – pre-rTMS THI score) was calculated to estimate THI improvement. The beta maps of the GLM obtained by individual analyses indicated the estimated parameters corresponding to the variable of interests (i.e., the averaged BOLD signal of the seed regions). These maps were used as input data, and the ΔTHI was used as covariate, with age, tinnitus duration, laterality, and pre-rTMS THI score treated as nuisance variables. The averaged z-map of the individual seed-based functional connectivity thresholded at an absolute value of 1.96 was used as an explicit mask for this analysis. It helped to consider only the voxels which have statistically significant correlation with the seed region. The statistical significance was also set at uncorrected p<.001 with a false discovery rate of p<.05 using cluster-based multiple correction.
There may be potential confounding effect because data for tinnitus and control groups were collected in separate scanners. In order to make sure that there is no difference in image quality between the scanners, signal-to-noise ratio was estimated.20,21 The averaged signal intensity of the whole brain gray matter was divided by the standard deviation of signal intensity of the region of interest placed in the background air. The brain signal intensity was extracted from the smoothed fMRI data, and the region of interest placed in the background air was defined as a sphere with 8mm radius. Also, we estimated signal-to-noise ratio using the averaged signal intensity of the left A1. Statistical difference of signal-to-noise ratio between the scanners was tested by the Wilcoxon signed-rank test.
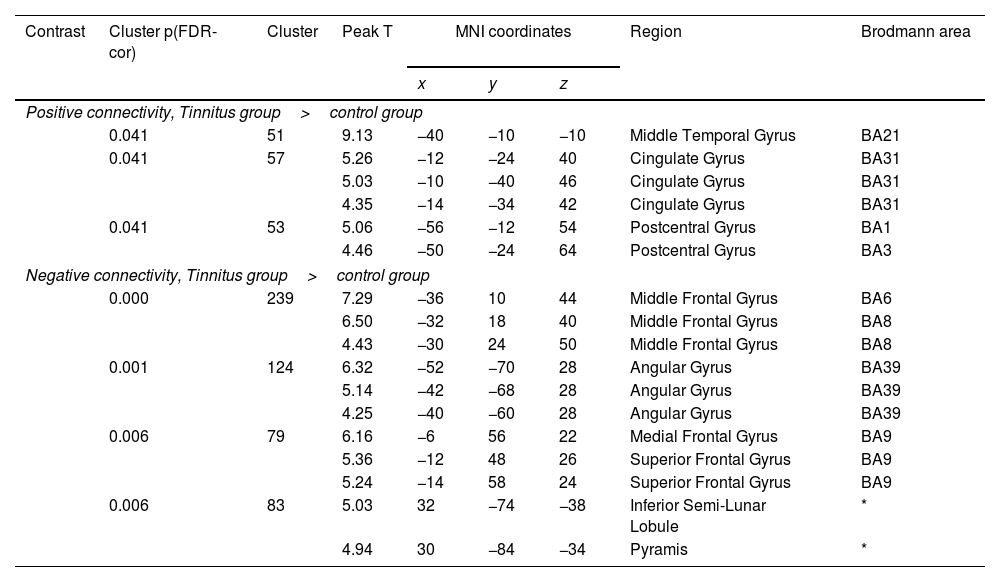
ResultsGroup comparisons of seed-based connectivityThe left A1 and DLPFC connectivity maps of the tinnitus (Fig. 1A and Fig. 2A) and control (Fig. 1B and 2B) groups were compared using a two-sample t-test. The statistical significance was set at a false discovery rate of p<.05 using cluster-based inference. Both maps showed significantly increased positive and negative connectivity in the tinnitus group compared with the control group. There was no significantly increased positive or negative connectivity in the healthy controls compared with the individuals with tinnitus. Significantly increased left A1 positive connectivity was observed with the left middle temporal (BA21), cingulate, and postcentral areas (Fig. 3A and Table 2). Significantly increased negative left A1 connectivity was observed with the left superior, middle, and medial frontal and angular (BA39) areas as well as right cerebellar areas (Fig. 3B and Table 2).
 tinnitus and (B) control groups. The first row represents the positive correlation between the left A1 and whole brain, whereas the second row represents the negative correlation between the left A1 and whole brain. The hot colormap represents the brain areas that positively correlate with the left A1, whereas the winter colormap represents the brain areas that negatively correlate with the left A1. For visualization, the left A1-based connectivity maps of all patients or all controls are averaged and thresholded by the z value of |1|. The green area indicates the seed region. The connectivity between the left A1 and bilateral superior, middle, and medial frontal areas, middle and inferior temporal areas, inferior parietal areas, and subcortical areas as well as the right inferior parietal lobule is significantly negative in the tinnitus group (winter colormap in A) and not in the control group (gray color in B). The connectivity between the left A1 and bilateral somatosensory areas (winter colormap in A and B, z=25 and 31) is positive in both groups, but stronger in patients with tinnitus.")
Averaged left A1-based functional connectivity maps of the (A) tinnitus and (B) control groups. The first row represents the positive correlation between the left A1 and whole brain, whereas the second row represents the negative correlation between the left A1 and whole brain. The hot colormap represents the brain areas that positively correlate with the left A1, whereas the winter colormap represents the brain areas that negatively correlate with the left A1. For visualization, the left A1-based connectivity maps of all patients or all controls are averaged and thresholded by the z value of |1|. The green area indicates the seed region. The connectivity between the left A1 and bilateral superior, middle, and medial frontal areas, middle and inferior temporal areas, inferior parietal areas, and subcortical areas as well as the right inferior parietal lobule is significantly negative in the tinnitus group (winter colormap in A) and not in the control group (gray color in B). The connectivity between the left A1 and bilateral somatosensory areas (winter colormap in A and B, z=25 and 31) is positive in both groups, but stronger in patients with tinnitus.
 tinnitus and (B) control groups. The first row represents the positive correlation between the left DLPFC and whole brain, whereas the second row represents the negative correlation between the left DLPFC and whole brain. The hot colormap represents the brain areas that positively correlate with the left DLPFC, whereas the winter colormap represents the brain areas that negatively correlate with the left DLPFC. For visualization, the left DLPFC-based connectivity maps of all patients or all controls are averaged and thresholded by the z value of |1|. The green area indicates the seed region. The tinnitus group (A) showed significantly positive (hot colormap in top row) and negative (winter colormap in bottom row) DLPFC connectivity with more extensive areas compared with the control group (B).")
Averaged left DLPFC-based connectivity maps of the (A) tinnitus and (B) control groups. The first row represents the positive correlation between the left DLPFC and whole brain, whereas the second row represents the negative correlation between the left DLPFC and whole brain. The hot colormap represents the brain areas that positively correlate with the left DLPFC, whereas the winter colormap represents the brain areas that negatively correlate with the left DLPFC. For visualization, the left DLPFC-based connectivity maps of all patients or all controls are averaged and thresholded by the z value of |1|. The green area indicates the seed region. The tinnitus group (A) showed significantly positive (hot colormap in top row) and negative (winter colormap in bottom row) DLPFC connectivity with more extensive areas compared with the control group (B).
 The hot colormap represents the brain areas with significantly increased positive connectivity of the left A1 in the tinnitus group compared with the control group. These regions include the left middle temporal, cingulate, and postcentral areas. (B) The winter colormap represents the brain areas with significantly increased negative connectivity of the left A1 in the tinnitus group compared with the control group. These regions include the left superior, middle, and medial frontal and angular areas and right cerebellar areas.")
Group differences between left A1-based connectivity maps. (A) The hot colormap represents the brain areas with significantly increased positive connectivity of the left A1 in the tinnitus group compared with the control group. These regions include the left middle temporal, cingulate, and postcentral areas. (B) The winter colormap represents the brain areas with significantly increased negative connectivity of the left A1 in the tinnitus group compared with the control group. These regions include the left superior, middle, and medial frontal and angular areas and right cerebellar areas.
Significantly different functional connectivity of the left primary auditory cortex between the tinnitus and control groups.
| Contrast | Cluster p(FDR-cor) | Cluster | Peak T | MNI coordinates | Region | Brodmann area | ||
|---|---|---|---|---|---|---|---|---|
| x | y | z | ||||||
| Positive connectivity, Tinnitus group>control group | ||||||||
| 0.041 | 51 | 9.13 | −40 | −10 | −10 | Middle Temporal Gyrus | BA21 | |
| 0.041 | 57 | 5.26 | −12 | −24 | 40 | Cingulate Gyrus | BA31 | |
| 5.03 | −10 | −40 | 46 | Cingulate Gyrus | BA31 | |||
| 4.35 | −14 | −34 | 42 | Cingulate Gyrus | BA31 | |||
| 0.041 | 53 | 5.06 | −56 | −12 | 54 | Postcentral Gyrus | BA1 | |
| 4.46 | −50 | −24 | 64 | Postcentral Gyrus | BA3 | |||
| Negative connectivity, Tinnitus group>control group | ||||||||
| 0.000 | 239 | 7.29 | −36 | 10 | 44 | Middle Frontal Gyrus | BA6 | |
| 6.50 | −32 | 18 | 40 | Middle Frontal Gyrus | BA8 | |||
| 4.43 | −30 | 24 | 50 | Middle Frontal Gyrus | BA8 | |||
| 0.001 | 124 | 6.32 | −52 | −70 | 28 | Angular Gyrus | BA39 | |
| 5.14 | −42 | −68 | 28 | Angular Gyrus | BA39 | |||
| 4.25 | −40 | −60 | 28 | Angular Gyrus | BA39 | |||
| 0.006 | 79 | 6.16 | −6 | 56 | 22 | Medial Frontal Gyrus | BA9 | |
| 5.36 | −12 | 48 | 26 | Superior Frontal Gyrus | BA9 | |||
| 5.24 | −14 | 58 | 24 | Superior Frontal Gyrus | BA9 | |||
| 0.006 | 83 | 5.03 | 32 | −74 | −38 | Inferior Semi-Lunar Lobule | * | |
| 4.94 | 30 | −84 | −34 | Pyramis | * | |||
We observed significantly increased left DLPFC positive connectivity with the bilateral posterior cingulate cortex, parahippocampal areas, bilateral midbrain, right cerebellum, bilateral angular areas extending to the precuneus, middle temporal area, inferior parietal lobule, bilateral inferior temporal areas, and left frontal and anterior cingulate areas (Fig. 4A and see Supplementary Material Table S1). Significantly increased left DLPFC negative connectivity was observed with the bilateral cerebral hemispheres, including the temporo-occipital, parietal (e.g., the precuneus and postcentral and inferior parietal lobules), cingulate, and cerebellar (e.g., the declive and culmen) areas (Fig. 4B and see Supplementary Material Table S1).
 The hot colormap represents the brain areas with significantly increased positive connectivity in the tinnitus group compared with the control group. The regions include the bilateral posterior cingulate cortex, parahippocampal areas, and midbrain, right cerebellum, bilateral angular areas extending to the precuneus, middle temporal area, inferior parietal lobule, and inferior temporal areas, and left frontal and anterior cingulate areas. (B) The winter colormap represents the brain areas with significantly increased negative connectivity in the tinnitus group compared with the normal group. The regions include bilateral temporo-occipital, parietal (e.g., the precuneus and postcentral and inferior parietal lobules), cingulate, and cerebellar areas.")
Group differences between the left DLPFC-based connectivity maps. (A) The hot colormap represents the brain areas with significantly increased positive connectivity in the tinnitus group compared with the control group. The regions include the bilateral posterior cingulate cortex, parahippocampal areas, and midbrain, right cerebellum, bilateral angular areas extending to the precuneus, middle temporal area, inferior parietal lobule, and inferior temporal areas, and left frontal and anterior cingulate areas. (B) The winter colormap represents the brain areas with significantly increased negative connectivity in the tinnitus group compared with the normal group. The regions include bilateral temporo-occipital, parietal (e.g., the precuneus and postcentral and inferior parietal lobules), cingulate, and cerebellar areas.
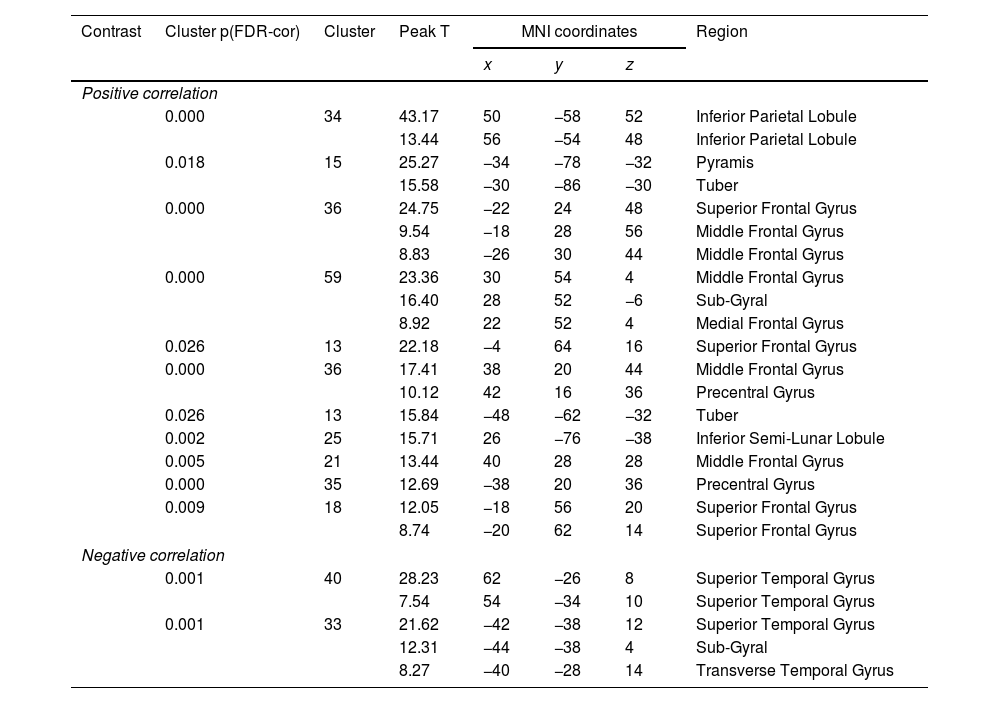
All but one individual with tinnitus exhibited significant tinnitus improvement (i.e., a score change>7 points). Statistically, tinnitus improved two weeks after rTMS (p=.002, Wilcoxon signed-rank test). Tinnitus improvement was significantly correlated with the functional connectivity of the left A1; however, it was not correlated with that of the left DLPFC. The statistical significance was set at a false discovery rate of p<.05 using cluster-based inference. A significantly positive correlation was observed between the ΔTHI and left A1 connectivity with the right inferior parietal lobule, left superior frontal, bilateral middle frontal, and right medial frontal areas including bilateral precentral regions, and bilateral cerebellar areas. A significantly negative correlation was observed between the ΔTHI and left A1 connectivity with the bilateral superior temporal areas (Fig. 5 and Table 3).
![Association between tinnitus improvement (ΔTHI) and the left A1-based connectivity maps of the tinnitus group. The hot colormap represents the positive correlation between the ΔTHI and left A1-based connectivity maps. The winter colormap represents the negative correlation between the ΔTHI and left A1-based connectivity maps. Tinnitus improvement was estimated by subtracting the pre-rTMS THI scores from the post-rTMS THI scores. Thus, a low ΔTHI (hot colormap) indicates a good rTMS outcome, whereas a high ΔTHI (winter color map) indicates a poor rTMS outcome. An rTMS outcome is poor when the connectivity between the left A1 and bilateral frontal cortices is similar to that of the control subjects (i.e., stronger connectivity [hot colormap]). An rTMS outcome is good when the connectivity between the left A1 and bilateral temporal cortices is strong (winter color map).](https://static.elsevier.es/multimedia/02134853/0000003800000007/v1_202309041924/S0213485321000232/v1_202309041924/en/main.assets/gr5.jpeg?xkr=ue/ImdikoIMrsJoerZ+w997EogCnBdOOD93cPFbanNcnxJVYM2BEAEuZ5XZLhi9imZE5uRdH9SPScI3uZvh7w3ikuKZ9RsYi/jtq/ELX/WUyJ+J+rdrmXnPEDSPhhR7YgTlRsAyO//GPQLl615fVMqSy36pMVSBNwSz6+UMn6g3DQ9599jrAiGUMhUe/whcOOJX/4UODwCkcEl19qiyfPtPn4sXmwXtYBoM2mSmVChOBmQmIey40ZjXeSjPfwJ8+A6bihVTIN+UuK4Lkbc+0Pzlo+krGksPoX35r9ObBWV0= "Association between tinnitus improvement (ΔTHI) and the left A1-based connectivity maps of the tinnitus group. The hot colormap represents the positive correlation between the ΔTHI and left A1-based connectivity maps. The winter colormap represents the negative correlation between the ΔTHI and left A1-based connectivity maps. Tinnitus improvement was estimated by subtracting the pre-rTMS THI scores from the post-rTMS THI scores. Thus, a low ΔTHI (hot colormap) indicates a good rTMS outcome, whereas a high ΔTHI (winter color map) indicates a poor rTMS outcome. An rTMS outcome is poor when the connectivity between the left A1 and bilateral frontal cortices is similar to that of the control subjects (i.e., stronger connectivity [hot colormap]). An rTMS outcome is good when the connectivity between the left A1 and bilateral temporal cortices is strong (winter color map).")
Association between tinnitus improvement (ΔTHI) and the left A1-based connectivity maps of the tinnitus group. The hot colormap represents the positive correlation between the ΔTHI and left A1-based connectivity maps. The winter colormap represents the negative correlation between the ΔTHI and left A1-based connectivity maps. Tinnitus improvement was estimated by subtracting the pre-rTMS THI scores from the post-rTMS THI scores. Thus, a low ΔTHI (hot colormap) indicates a good rTMS outcome, whereas a high ΔTHI (winter color map) indicates a poor rTMS outcome. An rTMS outcome is poor when the connectivity between the left A1 and bilateral frontal cortices is similar to that of the control subjects (i.e., stronger connectivity [hot colormap]). An rTMS outcome is good when the connectivity between the left A1 and bilateral temporal cortices is strong (winter color map).
The brain areas of individuals with tinnitus with significant correlations between tinnitus improvement and left primary auditory cortex functional connectivity.
| Contrast | Cluster p(FDR-cor) | Cluster | Peak T | MNI coordinates | Region | ||
|---|---|---|---|---|---|---|---|
| x | y | z | |||||
| Positive correlation | |||||||
| 0.000 | 34 | 43.17 | 50 | −58 | 52 | Inferior Parietal Lobule | |
| 13.44 | 56 | −54 | 48 | Inferior Parietal Lobule | |||
| 0.018 | 15 | 25.27 | −34 | −78 | −32 | Pyramis | |
| 15.58 | −30 | −86 | −30 | Tuber | |||
| 0.000 | 36 | 24.75 | −22 | 24 | 48 | Superior Frontal Gyrus | |
| 9.54 | −18 | 28 | 56 | Middle Frontal Gyrus | |||
| 8.83 | −26 | 30 | 44 | Middle Frontal Gyrus | |||
| 0.000 | 59 | 23.36 | 30 | 54 | 4 | Middle Frontal Gyrus | |
| 16.40 | 28 | 52 | −6 | Sub-Gyral | |||
| 8.92 | 22 | 52 | 4 | Medial Frontal Gyrus | |||
| 0.026 | 13 | 22.18 | −4 | 64 | 16 | Superior Frontal Gyrus | |
| 0.000 | 36 | 17.41 | 38 | 20 | 44 | Middle Frontal Gyrus | |
| 10.12 | 42 | 16 | 36 | Precentral Gyrus | |||
| 0.026 | 13 | 15.84 | −48 | −62 | −32 | Tuber | |
| 0.002 | 25 | 15.71 | 26 | −76 | −38 | Inferior Semi-Lunar Lobule | |
| 0.005 | 21 | 13.44 | 40 | 28 | 28 | Middle Frontal Gyrus | |
| 0.000 | 35 | 12.69 | −38 | 20 | 36 | Precentral Gyrus | |
| 0.009 | 18 | 12.05 | −18 | 56 | 20 | Superior Frontal Gyrus | |
| 8.74 | −20 | 62 | 14 | Superior Frontal Gyrus | |||
| Negative correlation | |||||||
| 0.001 | 40 | 28.23 | 62 | −26 | 8 | Superior Temporal Gyrus | |
| 7.54 | 54 | −34 | 10 | Superior Temporal Gyrus | |||
| 0.001 | 33 | 21.62 | −42 | −38 | 12 | Superior Temporal Gyrus | |
| 12.31 | −44 | −38 | 4 | Sub-Gyral | |||
| 8.27 | −40 | −28 | 14 | Transverse Temporal Gyrus | |||
There was no significant difference between the signal-to-noise ratio of the tinnitus group and control group, using the whole brain gray matter signal intensity (p=.791), and the left A1 (p=.970).
DiscussionIn this study, functional connectivity differences between tinnitus and control groups were examined using resting-state fMRI. Moreover, the association between pre-rTMS resting-state functional connectivity and tinnitus improvement was investigated. The results suggest that pre-rTMS auditory cortex hyper-connectivity may have a profound influence on related areas and lead to good treatment outcomes.
Altered pre-rTMS functional connectivity in individuals with tinnitusThe tinnitus patients showed significantly increased left A1-based positive and negative functional connectivity compared to that of the controls. Positive connectivity was observed in the left middle temporal and postcentral areas, which process sensory information. The results are similar to those of a previous study using independent component analysis, which suggested that left temporal and sensorimotor areas had increased auditory component connections.22 Increased connectivity between the left auditory and middle temporal areas has also been observed in previous study.23 Previous studies have suggested that the primary neural characteristics of tinnitus are auditory hyperactivity and hyper-synchronization,24,25 which may lead to increased temporal area connectivity. Increased connectivity with the postcentral area is also plausible, as tinnitus can be evoked by somatosensory stimulation of areas where neural connections linking auditory areas exist.26
In contrast, the significantly increased negative connectivity of the left A1 observed in the left fronto-parietal and right cerebellar areas may be related to the imbalance between auditory processing and top-down executive control.13,27 Negative connectivity can be thought of as an anti-correlation or as phase-reversed BOLD activity. In fact, top-down executive function issues, such as decreased cognitive speed and prolonged reaction times related to the control of attentional processes, have been observed in tinnitus patients.27,28 The frontal areas can mediate the top-down executive function,29 and the left angular area, which is involved in the inferior parietal lobule, has been suggested as part of the executive control network.30 A meta-analysis has suggested that the inferior semi-lunar lobule (VIIB) is associated with executive functions.31 Taken together, although it is not known whether the significantly different functional connectivity of the left A1 causes tinnitus or is resulted from tinnitus, these abnormal connections are associated with enhanced auditory neural activity, including that of somatosensory areas, as well as with weakened executive control of auditory processing in tinnitus patients.
Left DLPFC functional connectivity provides related evidence. For example, the brain areas which significantly increased positive connectivity was observed with the left DLPFC were the left fronto-parietal and right cerebellar areas, where significantly increased negative connectivity with the left A1 was observed. This suggests that the executive-control network encompassing fronto-parietal as well as cerebellar areas32 was internally strengthened despite weakened executive control of auditory processing in tinnitus patients. Moreover, the bilateral posterior cingulate and parahippocampal areas, midbrain, and inferior temporal areas as well as the left anterior cingulate cortex also had increased connectivity with the left DLPFC. In previous studies, the parahippocampal area was suggested to be a part of the network, mediating auditory sensory gating, including the auditory and prefrontal cortices and hippocampus.33 The anterior and posterior cingulate areas have been shown to be involved in sensory event executive or evaluative function.34,35
The significantly increased negative connectivity of the left DLPFC suggests an anti-correlation between executive control and auditory (temporal), visual (occipital), and somatic (postcentral) sensory functions. Because the connectivity between the left DLPFC and A1 is associated with auditory working memory and response control,36 the negative connectivity between these regions may suggest imbalanced auditory processing control in patients with tinnitus. Likewise, the negative connectivity observed between the left DLPFC and occipital or postcentral areas may be related to the imbalanced control of visual and somatosensory processing. This is in agreement with a previous study proposing a significant anti-correlation between visual cortex and executive control network components in a bothersome tinnitus group.37 Saccadic eye movements38 or somatic sensation can also modulate tinnitus,26 which suggests that imbalanced sensory processing control in patients with tinnitus involves not only auditory processing, but also visual or somatosensory processing. Future studies are needed to investigate the associations between frontal and non-auditory sensory areas in tinnitus.
Pre-rTMS functional connectivity correlated with tinnitus treatment effectOur results indicate that the rTMS outcome is poor when the connectivity between the left A1 and bilateral frontal cortices is similar to that of the control subjects. The rTMS outcome is good when the connectivity between the left A1 and bilateral temporal cortices is strong. Because stronger negative correlations between the left A1 and bilateral temporal cortices are characteristic features of tinnitus, tinnitus-specific stronger auditory temporal connectivity seems to be a good prognostic factor for rTMS outcome.
In general, rTMS has been used to suppress tinnitus by targeting the A1 and DLPFC.10,39 Low frequency (<1Hz) rTMS suppresses cortical excitability similar to long-term depression.2 In this study, connectivity was determined through seed-based connectivity analysis using resting fMRI data obtained before rTMS, with the left A1 and DLPFC as seed regions. Tinnitus improvement was estimated by subtracting the pre-rTMS THI scores from the post-rTMS THI scores. Thus, a low ΔTHI indicates a good rTMS outcome, whereas a high ΔTHI indicates a poor rTMS outcome.
There was a significantly positive correlation between poor rTMS outcomes and increased connectivity of the left A1 with the left superior, bilateral middle frontal, and right medial frontal areas as well as the right inferior parietal lobule. In contrast, increased connectivity between the left A1 and bilateral superior temporal areas was associated with good rTMS outcomes. Because we did not divide the positive and negative connectivity (i.e., the beta maps) for this analysis, a clear definition of “increased connectivity” is important, as it is completely different from “increased negative or positive connectivity.” Increased connectivity can be indicated in three ways, including from negative rho with the largest to smallest magnitudes, from negative to positive rho, and from positive rho with the smallest to largest magnitudes. Fig. 1A shows that the connectivity between the left A1 and bilateral superior, middle, and medial frontal areas as well as the right inferior parietal lobule was negative in the tinnitus group, and Fig. 1B shows that the connectivity between the left A1 and the above regions was relatively neutral in the control group. These results demonstrate that when the functional connectivity of tinnitus group was similar to that of the control group, the rTMS response was worse. Moreover, Fig. 1 shows that the connectivity between the left A1 and bilateral temporal areas was positive in both groups, but stronger in the tinnitus group. These results also demonstrate that similar connectivity between the tinnitus and control groups was associated with worse rTMS responses. This may be because of the inhibitory effect of low frequency rTMS. A previous study showed that low frequency rTMS over the left DLPFC led to reduced resting-state network activity within the default mode network after rTMS.40 The application of low frequency rTMS over the left A1 may have a profound effect on related areas if its connectivity was hyper-synchronized before rTMS.
In this study, we used resting-state fMRI and rTMS to examine functional connectivity differences between tinnitus and control groups. The association between tinnitus improvement and pre-treatment resting-state functional connectivity was also examined. Despite our small sample size, we used rigorous statistical criteria to support our findings. Nevertheless, the findings of this study could be considered only trends because of the small sample size so future study is necessary in large sample data. In addition, the implication of this study about the relationship between tinnitus improvement and resting-state functional connectivity of the left A1 should be carefully explained, because we did not include individuals with non-responders (all but one individual with tinnitus exhibited significant tinnitus improvement) into the analysis. Because rTMS was applied to the left A1 and DLPFC sequentially, the effect of rTMS over the left A1 could be not separated to the effect of rTMS over the left DLPFC although resting-state functional connectivity of the left DLPFC before rTMS treatment was not significantly associated with treatment effectiveness. Data for the tinnitus and control groups were collected in separate scanners. This may be one of potential confounding factors of this study but we prove that there was no significant difference in image quality between the scanners. In addition, the wavelet despiking we used in this study can reduce artifacts related with high/low frequency noise due to excessive motion, but physiological noise or motion related noise was not completely removed from the data.
Data availability statementThe data that support the findings of this study are available from the corresponding authors upon reasonable request.
Conflict of interestsThe authors declare that they have no conflict of interest.
This study was 50% supported by the Korea Health Industry Development Institute (KHDI) of Korean Ministry of Health and Welfare (HI18C0626). This research was also 40% and 10% supported by the National Research Foundation of Korea (NRF) grant funded by the Korea government (2020R1A2C2011532 and 2018R1C1B6002554), respectively.
The following are supplementary data to this article: