


The UD Interference Test measures processing speed and attention, and is based on the concept of interference of the Stroop Color and Word Test. The main purpose of the study is to provide an alternative version of the Stroop Color and Word Test that overcomes some of the limitations of previous versions in assessing individuals with daltonism or age-related reading difficulties, and to obtain normative and standardised data for the Spanish population.
MethodsThis study is part of the Normacog project. We evaluated 905 individuals (age range, 18–93 years) to analyse the test’s reliability and concurrent and construct validity. We evaluated the effect of age, sex, and level of education on UD Interference Test performance and calculated percentiles and age- and education-adjusted scaled scores.
ResultsThe test has good reliability (α = 0.875) and concurrent (r = 0.443−0.725; P < .001) and construct validity (r = 0.472–0.737; P < .001). We observed age and educational level to have a significant effect on UD Interference Test scores, explaining 12% to 40% of variance. Sex only had a significant effect on the resistance to interference index.
ConclusionsWe present an alternative version of the Stroop Color and Word Test with some advantages over previous versions. We provide standardised and normalised data for the Spanish population to correct the test according to the subject’s age and level of education.
El test UD Interferencia evalúa la velocidad de procesamiento y la atención, y está basado en el concepto de interferencia del test de Stroop. El objetivo principal de este estudio es proporcionar una versión alternativa del test de Stroop que evite algunas de las limitaciones de versiones anteriores, relacionadas con el daltonismo y las dificultades de lectura en personas mayores, y obtener datos normativos y estandarizados para este test, adaptados a población española.
MétodosEl estudio se enmarca dentro del proyecto Normacog, para el cual se evaluó a 905 participantes (18–93 años). Se analizó la fiabilidad y la validez concurrente y de constructo del test. Se analizaron el efecto de la edad, nivel educativo y sexo sobre el rendimiento en UD Interferencia y se crearon percentiles y puntuaciones escalares ajustadas por edad y nivel educativo.
ResultadosEl test muestra buena fiabilidad (α = 0,875) y validez concurrente (r de 0,443 a 0,725; P < ,001) y de constructo (r de 0,472 a 0,737; P < ,001). Se observó un efecto significativo de la edad y el nivel educativo sobre el rendimiento en UD Interferencia, explicando del 12 al 40% de la varianza. El sexo únicamente presentó un efecto significativo en la variable índice de resistencia a la interferencia.
ConclusionesSe presenta una versión alternativa del test de Stroop que presenta algunas ventajas sobre anteriores versiones. Se aportan baremos estandarizados y normalizados para población española que permiten corregir el test teniendo en cuenta la edad y educación de la persona evaluada.
The Stroop test is a widely used instrument internationally, both in the clinical and in the research spheres.1,2 This test evaluates information processing speed, selective attention, inhibition, cognitive flexibility, and resistance to interference.3–6
The test is based on a pioneering study conducted by Stroop7 in 1935, which sought to measure the inhibition or interference created by reading words and/or naming colours with another stimulus acting as a distractor, a phenomenon that subsequently came to be known as the “Stroop effect.” Stroop’s study was the first to present the 3 stimulus sheets that gave rise to the test. The Stroop paradigm compares performance in tasks with and without presence of a distractor.
Following this paradigm, different versions of the Stroop test have been developed.1,4 Although none is recognised as the standard, several versions are commercially available or easily accessible.2 The oldest versions, published in the 1960s and 1970s, were developed by Comalli,8 Golden (the Stroop Color and Word Test),9,10 and Dodrill.11 In the 1980s, new versions were developed by Regard (the Victoria Stroop Test)4,12 and Trenerry (the Stroop Neuropsychological Screening Test).13 The most recent versions are those included in the Das-Naglieri Cognitive Assessment System (CAS; Expressive Attention subtest)14 and the Delis-Kaplan Executive Function System™ (D-KEFS™; Color-Word Interference Test).15
These versions differ in several ways: a) the number of items on each sheet (ranging from 24 in the Victoria version to 176 in the Dodrill version); b) the colours included (in addition to red, green, and blue, some versions include a fourth colour, such as brown, yellow, or orange); c) the shapes used on the colour sheet (rectangles, squares, dots, or crosses); d) the number of sheets (typically 3, with the Dodrill and Trenerry versions including 2 and the D-KEFS version including 4); e) the order in which sheets are presented; f) the time allocated for each sheet (in some versions the reading of each sheet is timed, whereas in others the number of correct answers in a given time [eg, 45 s in the Golden version and 120 s in the Trenerry version) is counted; g) the way in which the interference index is calculated (from simple formulae, such as the difference between scores on 2 sheets, to more complex formulae such as that proposed by Golden9,10).
One shared characteristic is that all versions use the colours red, green, and blue. This is a hindrance in the assessment of individuals who struggle to differentiate colours, such as elderly people, who have difficulty discriminating blue and green,16 and prevents the use of the test in individuals with red/green colour-blindness.4,6 Furthermore, the large number of items per sheet and the small text size used in some versions may complicate the task due to the added difficulty of clearly distinguishing the items; this would particularly affect the performance of older people or those with vision problems.16
The Stroop test has been used extensively both in children and in adults, and to evaluate diverse groups of patients. Performance in the test has been shown to be impaired in several neurological and psychiatric disorders, including depression and anxiety disorders.1,2,4
Sociodemographic variables including age, level of education, and sex have also been shown to influence performance. Older age is associated with poorer performance,5.17–19 with a particular impact on the interference score.4,20 The slower test performance and lower scores observed have been associated both with cognitive slowing and with factors associated with cognitive processes, such as reduced inhibition17 and vision problems, both with reading the words and with discriminating between colours.16,21 Level of schooling has also been shown to affect performance in the Stroop test, with lower levels of education being associated with poorer performance5,18,21–23; furthermore, age-related decline is more pronounced in individuals with lower education levels.20 Some studies have reported that women perform better than men,7,19 whereas others observed no sex-related differences5,17,18,23 or only observed differences in some sheets.20,21
Due to its popularity, the test has been normalised for different populations and has been translated and adapted to different languages,2,4 including Spanish. Normative data are available for Spanish-speaking populations in the United States,24 Latin America,6,18,25 and Spain. In Spain, normative data have been published for paediatric populations of 6–17 years of age6 and for adult populations.5,23,24,26,27
In the light of the extensive use of the test and some of the limitations present in current versions, we created a new instrument, the UD Interference Test, which uses easily distinguishable colours, larger type, and a shorter administration time. These changes are intended to address the test’s limitations in the evaluation of elderly individuals or those with colour-blindness or other vision problems.
The present study has 2 main objectives: 1) to present a new version of the Stroop test without some of the limitations shared by previous versions, and to characterise its psychometric properties in terms of reliability and validity; and 2) to present normative data for the UD Interference Test for the Spanish adult population aged 18–93 years.
Material and methodsParticipantsThis validation, normalisation, and standardisation study for the UD Interference Test is part of the multicentre Normacog project,28 developed to normalise and standardise neuropsychological tests for the current Spanish population. This study complies with international guidelines on biomedical research with human subjects (Declaration of Helsinki; Edinburgh, 2000). Data were processed in accordance with Spanish data protection legislation (Organic Law 15-1999, of 13 December), and all participants gave written informed consent.
A minimum sample size of 500 participants was calculated for the sample to be representative of the Spanish population older than 18 years, taking into account the size of the Spanish population as reported by the National Statistics Institute (January 2019). We gathered as many participants as possible in order to increase the representativeness of the sample.
The study sample included 905 healthy participants (401 men and 504 women) aged 18–93 years (mean [standard deviation; SD], 46.77 [17.67]), with 0–25 years of schooling (mean, 13.24 [4.9]). The recruitment method and selection criteria are described elsewhere.28 Of the 905 participants, 25 were not assessed with the UD Interference Test. From this sample, we selected 373 participants (156 men and 217 women) with a mean age of 46.93 (17.38) years and a mean of 14.09 (4.88) years of schooling; 188 individuals completed a second evaluation at 1–6 months (mean, 3.45 [2.16]) and 185 at 9–24 months (mean, 16.05 [7.05]).
InstrumentsThe UD Interference Test is a new instrument included in the test battery administered as part of the Normacog project.28 The final version of the test is available at www.normacog.deusto.es.
To create the test sheets, we studied different combinations of colours and shapes for the colour sheet, taking into account the difficulties of individuals with red/green or blue/green colour-blindness, and reading difficulties in older individuals. Given the objective of using 3 easily distinguishable colours, we decided to include the colours black and blue, and conducted tests with yellow and pink as the third colour. We finally selected pink due to the similar number of letters and syllables in the word as in the previously included colours. We also enlarged the text and reduced the number of items on each sheet to avoid reading difficulties in older individuals or those with vision problems. Regarding the selection of stimuli for the second sheet, we analysed different shapes (XXX, empty circles, and filled circles) by studying the correlation with the Stroop Color and Word Test, with filled circles showing the best results. The sample included in these analyses, mostly recruited in the university setting, had a mean age of 28.18 (9.35) years and a mean of 17.43 (1.57) years of schooling.
Each sheet in the UD Interference Test includes 64 items (4 columns of 16 items each), with easily distinguishable colours (blue, black, and pink). The second sheet presents the colours as filled circles. The administration time for each sheet is 30 seconds, and sheets are scored according to the number of correct responses (words read/colours named) given in that time. The interference index is calculated according to the formula proposed by Golden9,10: WC – ([W × C] / [W + C]).
The examinee is instructed to read aloud the words in each column, and is not allowed to use a finger as a guide. The instructions given to patients are available on the website of the Normacog project. As in several of the most extensively used versions of the Stroop test,8–10,14 sheets are administered in the following order:
- 1)
Words (W): the examinee is presented a sheet of words printed in black ink, and is instructed to read them aloud as quickly as possible.
- 2)
Colours (C): the examinee is presented a sheet of circles printed in coloured ink, and is instructed to say aloud the colour of each as quickly as possible.
- 3)
Words/colours (WC): the examinee is presented the names of colours printed in ink of a different colour (for instance, the word “blue” printed in pink ink), and is instructed to say aloud the colour of the ink for each word (in the example given, the correct response would be “pink”).
As part of the evaluation, the following tests were administered: Salthouse Perceptual Comparison Test (SPCT),29 Trail-Making Test parts A and B (TMT-A and TMT-B),30 Brief Test of Attention (BTA),31 Grooved Pegboard Test (GPT),32 Calibrated Ideational Fluency Assessment (CIFA) - verbal fluency subtest,33 and Hopkins Verbal Learning Test-Revised (HVLT-R).34 These tests were administered in the same order in all evaluations.
Statistical analysisSociodemographic data were compared between groups using the χ2 test.
To analyse the reliability of the UD Interference Test, we examined: a) the internal consistency of the variables W, C, and WC, using the Cronbach α test; and b) test-retest reliability, calculating the intraclass correlation coefficient (ICC) for each variable between the first and the second evaluations.
To analyse the concurrent validity of the UD Interference Test, we analysed the correlation between the variables of this test and those of other tests of information processing speed, attention, interference, and/or flexibility (SPCT, TMT-A, TMT-B).
To analyse construct validity, we calculated 4 compound scores. Attention (α = 0.82) included the recoded TMT-A and TMT-B completion time, and BTA score. Psychomotor speed (α = 0.85) included the number of correct responses in SPCT parts 3 and 6 and the recoded GPT completion time with the dominant hand. Verbal fluency (α = 0.75) included the sum of scores for animals, ‘L’ words, and supermarket items. Learning and verbal memory (α = 0.90) included the 3 acquisition trials and the long-term memory trial from the HVLT-R.
For the normalisation and standardisation of the UD Interference Test, we conducted the following statistical analyses, which are described in detail elsewhere28:
- a)
The t test was used to compare mean cognitive performance in 8 age groups and 4 education levels, and between sexes.
- b)
We studied coefficients of correlation (r) and determination (r2) between direct scores (DS) and the sociodemographic variables age, level of schooling, and sex.
- c)
DS were assigned percentile ranks by cumulative frequency; percentiles were compared against scaled scores (SS) adjusted for age range (arSS), ranging from 2 to 18, resulting in a normal distribution (mean [SD], 10 ± 3).35–37
- d)
Finally, we conducted a multiple regression analysis to obtain education-adjusted normative data, using the following formula: normalised SS = arSS – (β × [education – 12]).35,36
Compared to the Spanish population, the total sample (n = 905) showed no statistically significant differences in age or sex, but did display a difference in level of education (χ2 = 16.83; P < .001). The sample used for this study showed no statistically significant differences in sex, age (χ2 = 4.41; P = .732), or level of education (χ2 = 2.73; P = .434).
The internal consistency of the UD Interference Test for variables W, C, and WC was α = 0.875. Test-retest correlations were significant (P < .001) for all the variables analysed, both in the group completing the second assessment at 1–6 months (ICC of 0.833 [95% CI, 0.783−0.872] for words, 0.856 [95% CI, 0.812−0.890] for colours, 0.752 [95% CI, 0.682−0.808] for words/colours, and 0.539 [95% CI, 0.429−0.633] for interference) and in the group completing the second assessment at 9–24 months (ICC of 0.835 [95% CI, 0.785−0.874] for words, 0.818 [95% CI, 0.765−0.861] for colours, 0.822 [95% CI, 0.769−0.864] for words/colours, and 0.630 [95% CI, 0.534−0.709] for interference).
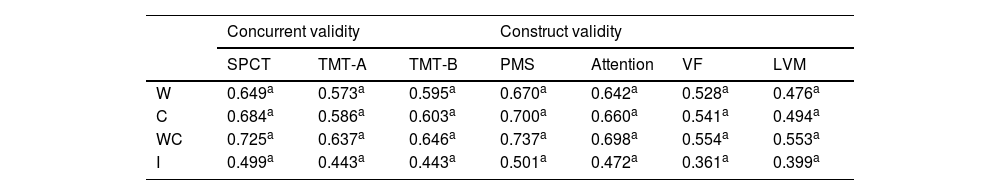
Correlations between UD Interference Test variables and performance on the SPCT, TMT-A, and TMT-B were significant (P < .001), with the correlation between SPCT and the variable words/colours being the strongest (r = 0.725) (Table 1). Moderate to strong correlations were observed between UD Interference Test variables and the different constructs analysed (P < .001). The strongest correlation was with the psychomotor speed construct (r values of 0.501−0.737), followed by attention (0.472−0.698), learning and verbal memory (0.399−0.553), and verbal fluency (0.361−0.554) (Table 1).
Concurrent and construct validity.
| Concurrent validity | Construct validity | ||||||
|---|---|---|---|---|---|---|---|
| SPCT | TMT-A | TMT-B | PMS | Attention | VF | LVM | |
| W | 0.649a | 0.573a | 0.595a | 0.670a | 0.642a | 0.528a | 0.476a |
| C | 0.684a | 0.586a | 0.603a | 0.700a | 0.660a | 0.541a | 0.494a |
| WC | 0.725a | 0.637a | 0.646a | 0.737a | 0.698a | 0.554a | 0.553a |
| I | 0.499a | 0.443a | 0.443a | 0.501a | 0.472a | 0.361a | 0.399a |
C: colours; I: interference index; LVM: learning and verbal memory; PMS: psychomotor speed; SPCT: Salthouse Perceptual Comparison Test; TMT: Trail-Making Test; VF: verbal fluency; W: words; WC: words/colours.
We compared mean scores on the 3 sheets and the interference index between age groups, levels of education, and sexes. Fig. 1 and 2 show the cognitive performance in the sample by age group and level of education. The number of words read or colours named decreased in line with age, and increased in line with level of education. The interference index also decreased with age and increased with level of education. Sex was only associated with interference index (mean [SD] of 3.9 [7.7] for men and 2.9 [6.8] for women: t [788.54] = 2.00; P = .046]).


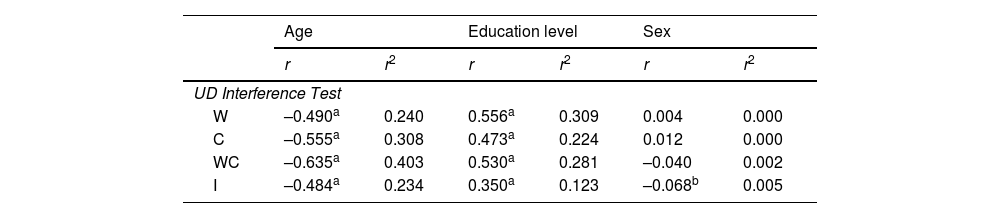
Table 2 shows the correlations and coefficients of determination between each of the sociodemographic variables and UD Interference Test variables. Age and level of education showed a significant effect for all variables analysed (P < .001). However, sex was only associated with the interference index. Age accounted for 23% to 40% of variance in the variables analysed, with education level explaining 12% to 31% and sex accounting for 0% to 0.5%.
Analysis of the correlation between UD Interference Test direct scores and demographic variables.
| Age | Education level | Sex | ||||
|---|---|---|---|---|---|---|
| r | r2 | r | r2 | r | r2 | |
| UD Interference Test | ||||||
| W | –0.490a | 0.240 | 0.556a | 0.309 | 0.004 | 0.000 |
| C | –0.555a | 0.308 | 0.473a | 0.224 | 0.012 | 0.000 |
| WC | –0.635a | 0.403 | 0.530a | 0.281 | –0.040 | 0.002 |
| I | –0.484a | 0.234 | 0.350a | 0.123 | –0.068b | 0.005 |
C: colours; I: interference index; W: words; WC: words/colours.
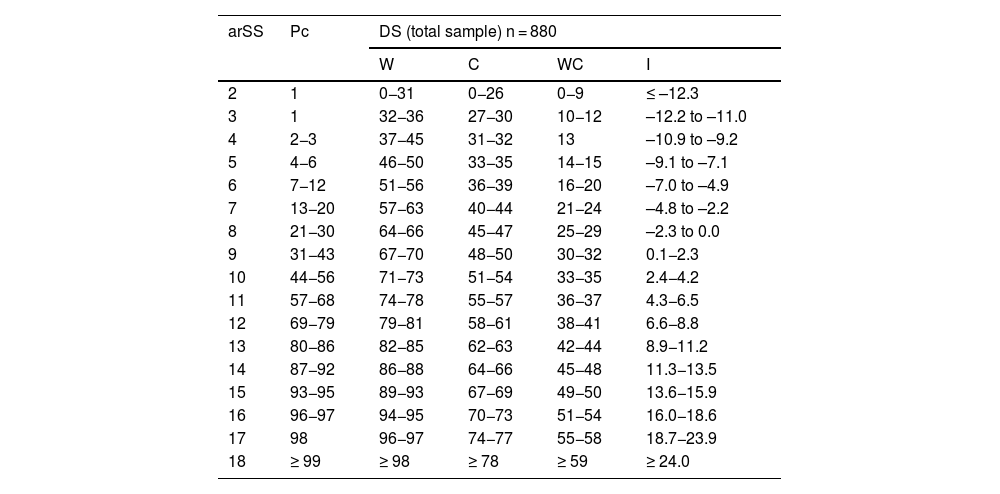
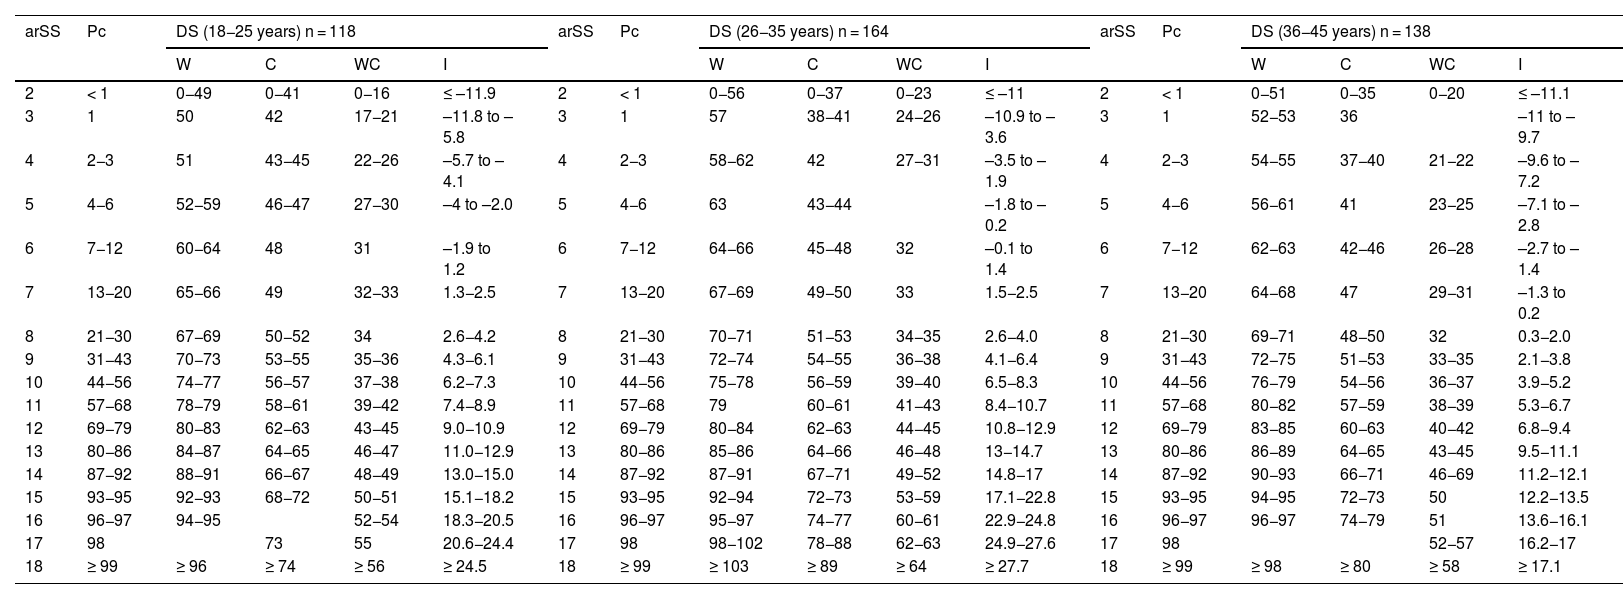
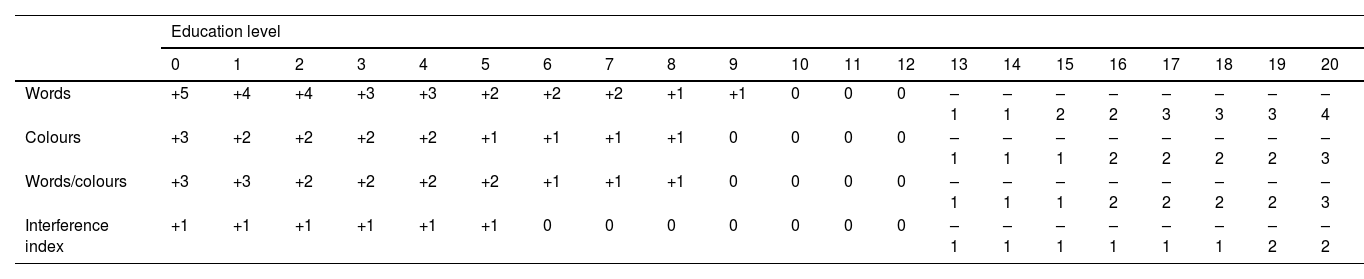
Tables 3 and 4 present the DS, arSS, and percentile ranks for each of the variables analysed, both for the total sample and for each of the pre-established age ranges. Table 5 can be used to calculate the normalised SS, adjusted for age and education. This number is obtained by selecting the variable of interest in the left column and the examinee’s years of schooling in the top row; the resulting value is the number of points to be added to or subtracted from the arSS to convert it into the normalised SS, a value between 2 and 18 points.
Scaled scores, percentile ranks, and direct scores in the UD Interference Test, for the total sample.
| arSS | Pc | DS (total sample) n = 880 | |||
|---|---|---|---|---|---|
| W | C | WC | I | ||
| 2 | 1 | 0−31 | 0−26 | 0−9 | ≤ –12.3 |
| 3 | 1 | 32−36 | 27−30 | 10−12 | –12.2 to –11.0 |
| 4 | 2−3 | 37−45 | 31−32 | 13 | –10.9 to –9.2 |
| 5 | 4−6 | 46−50 | 33−35 | 14−15 | –9.1 to –7.1 |
| 6 | 7−12 | 51−56 | 36−39 | 16−20 | –7.0 to –4.9 |
| 7 | 13−20 | 57−63 | 40−44 | 21−24 | –4.8 to –2.2 |
| 8 | 21−30 | 64−66 | 45−47 | 25−29 | –2.3 to 0.0 |
| 9 | 31−43 | 67−70 | 48−50 | 30−32 | 0.1−2.3 |
| 10 | 44−56 | 71−73 | 51−54 | 33−35 | 2.4−4.2 |
| 11 | 57−68 | 74−78 | 55−57 | 36−37 | 4.3−6.5 |
| 12 | 69−79 | 79−81 | 58−61 | 38−41 | 6.6−8.8 |
| 13 | 80−86 | 82−85 | 62−63 | 42−44 | 8.9−11.2 |
| 14 | 87−92 | 86−88 | 64−66 | 45−48 | 11.3−13.5 |
| 15 | 93−95 | 89−93 | 67−69 | 49−50 | 13.6−15.9 |
| 16 | 96−97 | 94−95 | 70−73 | 51−54 | 16.0−18.6 |
| 17 | 98 | 96−97 | 74−77 | 55−58 | 18.7−23.9 |
| 18 | ≥ 99 | ≥ 98 | ≥ 78 | ≥ 59 | ≥ 24.0 |
arSS; age range–adjusted scaled score; C: colours; DS: direct score; I: interference index; Pc: percentile rank; W: words; WC: words/colours.
Scaled scores, percentile ranks, and direct scores in the UD Interference Test, by age range (18–45 years).
| arSS | Pc | DS (18−25 years) n = 118 | arSS | Pc | DS (26−35 years) n = 164 | arSS | Pc | DS (36−45 years) n = 138 | |||||||||
|---|---|---|---|---|---|---|---|---|---|---|---|---|---|---|---|---|---|
| W | C | WC | I | W | C | WC | I | W | C | WC | I | ||||||
| 2 | < 1 | 0−49 | 0−41 | 0−16 | ≤ –11.9 | 2 | < 1 | 0−56 | 0−37 | 0−23 | ≤ –11 | 2 | < 1 | 0−51 | 0−35 | 0−20 | ≤ –11.1 |
| 3 | 1 | 50 | 42 | 17−21 | –11.8 to –5.8 | 3 | 1 | 57 | 38−41 | 24−26 | –10.9 to –3.6 | 3 | 1 | 52−53 | 36 | –11 to –9.7 | |
| 4 | 2−3 | 51 | 43−45 | 22−26 | –5.7 to –4.1 | 4 | 2−3 | 58−62 | 42 | 27−31 | –3.5 to –1.9 | 4 | 2−3 | 54−55 | 37−40 | 21−22 | –9.6 to –7.2 |
| 5 | 4−6 | 52−59 | 46−47 | 27−30 | –4 to –2.0 | 5 | 4−6 | 63 | 43−44 | –1.8 to –0.2 | 5 | 4−6 | 56−61 | 41 | 23−25 | –7.1 to –2.8 | |
| 6 | 7−12 | 60−64 | 48 | 31 | –1.9 to 1.2 | 6 | 7−12 | 64−66 | 45−48 | 32 | –0.1 to 1.4 | 6 | 7−12 | 62−63 | 42−46 | 26−28 | –2.7 to –1.4 |
| 7 | 13−20 | 65−66 | 49 | 32−33 | 1.3−2.5 | 7 | 13−20 | 67−69 | 49−50 | 33 | 1.5−2.5 | 7 | 13−20 | 64−68 | 47 | 29−31 | –1.3 to 0.2 |
| 8 | 21−30 | 67−69 | 50−52 | 34 | 2.6−4.2 | 8 | 21−30 | 70−71 | 51−53 | 34−35 | 2.6−4.0 | 8 | 21−30 | 69−71 | 48−50 | 32 | 0.3−2.0 |
| 9 | 31−43 | 70−73 | 53−55 | 35−36 | 4.3−6.1 | 9 | 31−43 | 72−74 | 54−55 | 36−38 | 4.1−6.4 | 9 | 31−43 | 72−75 | 51−53 | 33−35 | 2.1−3.8 |
| 10 | 44−56 | 74−77 | 56−57 | 37−38 | 6.2−7.3 | 10 | 44−56 | 75−78 | 56−59 | 39−40 | 6.5−8.3 | 10 | 44−56 | 76−79 | 54−56 | 36−37 | 3.9−5.2 |
| 11 | 57−68 | 78−79 | 58−61 | 39−42 | 7.4−8.9 | 11 | 57−68 | 79 | 60−61 | 41−43 | 8.4−10.7 | 11 | 57−68 | 80−82 | 57−59 | 38−39 | 5.3−6.7 |
| 12 | 69−79 | 80−83 | 62−63 | 43−45 | 9.0−10.9 | 12 | 69−79 | 80−84 | 62−63 | 44−45 | 10.8−12.9 | 12 | 69−79 | 83−85 | 60−63 | 40−42 | 6.8−9.4 |
| 13 | 80−86 | 84−87 | 64−65 | 46−47 | 11.0−12.9 | 13 | 80−86 | 85−86 | 64−66 | 46−48 | 13−14.7 | 13 | 80−86 | 86−89 | 64−65 | 43−45 | 9.5−11.1 |
| 14 | 87−92 | 88−91 | 66−67 | 48−49 | 13.0−15.0 | 14 | 87−92 | 87−91 | 67−71 | 49−52 | 14.8−17 | 14 | 87−92 | 90−93 | 66−71 | 46−69 | 11.2−12.1 |
| 15 | 93−95 | 92−93 | 68−72 | 50−51 | 15.1−18.2 | 15 | 93−95 | 92−94 | 72−73 | 53−59 | 17.1−22.8 | 15 | 93−95 | 94−95 | 72−73 | 50 | 12.2−13.5 |
| 16 | 96−97 | 94−95 | 52−54 | 18.3−20.5 | 16 | 96−97 | 95−97 | 74−77 | 60−61 | 22.9−24.8 | 16 | 96−97 | 96−97 | 74−79 | 51 | 13.6−16.1 | |
| 17 | 98 | 73 | 55 | 20.6−24.4 | 17 | 98 | 98−102 | 78−88 | 62−63 | 24.9−27.6 | 17 | 98 | 52−57 | 16.2−17 | |||
| 18 | ≥ 99 | ≥ 96 | ≥ 74 | ≥ 56 | ≥ 24.5 | 18 | ≥ 99 | ≥ 103 | ≥ 89 | ≥ 64 | ≥ 27.7 | 18 | ≥ 99 | ≥ 98 | ≥ 80 | ≥ 58 | ≥ 17.1 |
| Scaled scores, percentile ranks, and direct scores in the UD Interference Test, by age range (46−75 years) | |||||||||||||||||
|---|---|---|---|---|---|---|---|---|---|---|---|---|---|---|---|---|---|
| arSS | Pc | DS (46−55 years) n = 191 | arSS | Pc | DS (56−65 years) n = 123 | arSS | Pc | DS (66−75 years) n = 82 | |||||||||
| W | C | WC | I | W | C | WC | I | W | C | WC | I | ||||||
| 2 | < 1 | 0−41 | 0−32 | 0−13 | ≤ –12.0 | 2 | < 1 | 37 | 30 | 13 | ≤ –11.4 | 2 | < 1 | ||||
| 3 | 1 | 42−47 | 33−34 | –11.9 to –9.4 | 3 | 1 | 42 | 32 | –11.3 to –10.9 | 3 | 1 | 0−28 | 0−29 | 0−11 | ≤ –13.6 | ||
| 4 | 2−3 | 48−50 | 35 | 14−16 | –9.3 to –7.5 | 4 | 2−3 | 46−51 | 34 | 14−15 | –10.8 to –10.2 | 4 | 2−3 | 29−31 | 30 | 12 | –13.5 to –10.5 |
| 5 | 4−6 | 51−56 | 37−39 | 17−20 | –7.4 to –6.0 | 5 | 4−6 | 52−54 | 35−36 | –10.1 to –8.4 | 5 | 4−6 | 32−37 | 31 | 13 | –10.4 to –9.4 | |
| 6 | 7−12 | 57−61 | 40−41 | 21−23 | –5.9 to –4.3 | 6 | 7−12 | 55−58 | 37−38 | 16−18 | –8.3 to –7.1 | 6 | 7−12 | 38−43 | 32 | 14 | –9.3 to –7.0 |
| 7 | 13−20 | 62−63 | 42−45 | 24−25 | –4.2 to –2.3 | 7 | 13−20 | 59−62 | 39−41 | 19−22 | –7.0 to –5.0 | 7 | 13−20 | 44−47 | 33−34 | 15 | –7.1 to –5.7 |
| 8 | 21−30 | 64−67 | 46−47 | 26−29 | –2.2 to –0.1 | 8 | 21−30 | 63−64 | 42−44 | 23−24 | –4.9 to –3.0 | 8 | 21−30 | 48−54 | 35−37 | 16−18 | –5.6 to –4.2 |
| 9 | 31−43 | 68−71 | 48−51 | 30−32 | –0.2 to –2.0 | 9 | 31−43 | 65−66 | 45−47 | 25−27 | –2.9 to –1.0 | 9 | 31−43 | 55−59 | 38−40 | 19−21 | –4.1 to –1.8 |
| 10 | 44−56 | 72−75 | 52−54 | 33−34 | 2.1−3.7 | 10 | 44−56 | 67−69 | 48−50 | 28−30 | –0.9 to –1.6 | 10 | 44−56 | 60−63 | 41−44 | 22−24 | –1.7 to –0.3 |
| 11 | 57−68 | 76−78 | 55−58 | 35−36 | 3.8−5.3 | 11 | 57−68 | 70−73 | 51−52 | 31 | 1.7−2.9 | 11 | 57−68 | 64−65 | 45−46 | 25−26 | –0.2 to –0.5 |
| 12 | 69−79 | 79−83 | 59−61 | 37−38 | 5.4−7.1 | 12 | 69−79 | 74−76 | 53−54 | 32−33 | 3.0−4.5 | 12 | 69−79 | 66−69 | 47−48 | 27−29 | 0.6−2.3 |
| 13 | 80−86 | 84−86 | 62−63 | 39−43 | 7.2−10.6 | 13 | 80−86 | 77−79 | 55−58 | 34 | 4.6−6.3 | 13 | 80−86 | 70−73 | 49−51 | 30−31 | 2.4−5.6 |
| 14 | 87−92 | 86−88 | 64−65 | 44−45 | 10.7−13.2 | 14 | 87−92 | 80−81 | 59−61 | 35−38 | 6.4−7.0 | 14 | 87−92 | 52−56 | 32−35 | 5.7−7.5 | |
| 15 | 93−95 | 89−94 | 66−69 | 46−49 | 13.3−15.1 | 15 | 93−95 | 83 | 62−63 | 39−42 | 7.1−11.9 | 15 | 93−95 | 74−77 | 57 | 36−37 | 7.6−8.8 |
| 16 | 96−97 | 95−99 | 70−71 | 50−54 | 15.2−19.8 | 16 | 96−97 | 84−91 | 43−47 | 12.0−14.8 | 16 | 96−97 | 78−84 | 58−59 | 38 | 8.9−13.1 | |
| 17 | 98 | 100 | 72 | 55 | 19.9−26.4 | 17 | 98 | 92 | 64−66 | 48 | 14.9−17.6 | 17 | 98 | 85−86 | 60−61 | 39−41 | 13.2−13.5 |
| 18 | ≥ 99 | ≥ 101 | ≥ 73 | ≥ 58 | ≥ 26.5 | 18 | ≥ 99 | ≥ 96 | ≥ 67 | ≥ 49 | ≥ 17.7 | 18 | ≥ 99 | ≥ 87 | ≥ 62 | ≥ 42 | ≥ 13.6 |
| Scaled scores, percentile ranks, and direct scores in the UD Interference Test, by age range (≥ 76 years) | |||||||||||
|---|---|---|---|---|---|---|---|---|---|---|---|
| arSS | Pc | DS (76−80 years) n = 32 | arSS | Pc | DS (> 80 years) n = 32 | ||||||
| W | C | WC | I | W | C | WC | I | ||||
| 2 | < 1 | 2 | < 1 | ||||||||
| 3 | 1 | 3 | 1 | ||||||||
| 4 | 2−3 | 0−31 | 0−23 | ≤ –12.0 | 4 | 2−3 | 0−23 | 0−8 | ≤ –11.6 | ||
| 5 | 4−6 | 32−36 | 24−25 | 0−8 | –11.9 to –10.8 | 5 | 4−6 | 24 | 0−19 | –11.5 to –11.4 | |
| 6 | 7−12 | 37−47 | 26 | 9−10 | –10.7 | 6 | 7−12 | 25−31 | 20−27 | 9 | –11.3 to –8.9 |
| 7 | 13−20 | 27−31 | 11−12 | –10.6 to –10.1 | 7 | 13−20 | 28−29 | 10−11 | –8.8 to –7.1 | ||
| 8 | 21−30 | 48−49 | 32 | 13 | –10.0 to –7.9 | 8 | 21−30 | 32−39 | 30−31 | 12−15 | –7.0 to –5.9 |
| 9 | 31−43 | 50−53 | 33−36 | 14−15 | –7.8 | 9 | 31−43 | 40−48 | 32−33 | 16 | –5.8 to –5.2 |
| 10 | 44−56 | 54−56 | 37−41 | –7.7 to –3.3 | 10 | 44−56 | 49−53 | 34−35 | 17−18 | –5.1 to –3.3 | |
| 11 | 57−68 | 57−59 | 42−43 | 16−19 | –3.2 to –1.5 | 11 | 57−68 | 54−57 | 36−38 | 19−20 | –3.2 to –1.2 |
| 12 | 69−79 | 60−63 | 44 | 20−23 | –1.6 to –1.4 | 12 | 69−79 | 58−63 | 39−40 | 21−22 | 1.3−3.2 |
| 13 | 80−86 | 64−66 | 45 | 24 | –1.3 to –0.3 | 13 | 80−86 | 64−68 | 41−47 | 23−24 | 3.3−4.0 |
| 14 | 87−92 | 67−68 | 46−50 | –0.2 to –0.4 | 14 | 87−92 | 69−73 | 48−55 | 25−28 | 4.1−4.9 | |
| 15 | 93−95 | 69 | 25 | 0.5−2.1 | 15 | 93−95 | 74−75 | 5.0−8.9 | |||
| 16 | 96−97 | 71 | 51−57 | 26−31 | 2.2−4.0 | 16 | 96−97 | 76−86 | 56−65 | 29−31 | 9.0−9.2 |
| 17 | 98 | 17 | 98 | ||||||||
| 18 | ≥ 99 | ≥ 72 | ≥ 58 | ≥ 32 | ≥ 4.1 | 18 | ≥ 99 | ≥ 87 | ≥ 66 | ≥ 32 | ≥ 9.3 |
arSS; age range–adjusted scaled score; C: colours; DS: direct score; I: interference index; Pc: percentile rank; W: words; WC: words/colours.
Adjustment of scaled scores according to level of education.
| Education level | |||||||||||||||||||||
|---|---|---|---|---|---|---|---|---|---|---|---|---|---|---|---|---|---|---|---|---|---|
| 0 | 1 | 2 | 3 | 4 | 5 | 6 | 7 | 8 | 9 | 10 | 11 | 12 | 13 | 14 | 15 | 16 | 17 | 18 | 19 | 20 | |
| Words | +5 | +4 | +4 | +3 | +3 | +2 | +2 | +2 | +1 | +1 | 0 | 0 | 0 | –1 | –1 | –2 | –2 | –3 | –3 | –3 | –4 |
| Colours | +3 | +2 | +2 | +2 | +2 | +1 | +1 | +1 | +1 | 0 | 0 | 0 | 0 | –1 | –1 | –1 | –2 | –2 | –2 | –2 | –3 |
| Words/colours | +3 | +3 | +2 | +2 | +2 | +2 | +1 | +1 | +1 | 0 | 0 | 0 | 0 | –1 | –1 | –1 | –2 | –2 | –2 | –2 | –3 |
| Interference index | +1 | +1 | +1 | +1 | +1 | +1 | 0 | 0 | 0 | 0 | 0 | 0 | 0 | –1 | –1 | –1 | –1 | –1 | –1 | –2 | –2 |
We present the UD Interference Test, an alternative version of the Stroop test that solves some of the limitations of other versions in the evaluation of elderly or colour-blind individuals. We also provide reliability and validity data and the normative data for scoring and interpreting the results, adapted for the sociodemographic characteristics of the adult Spanish population.
The UD Interference Test presents very good reliability and validity. It also displays very good internal consistency and high test-retest reliability for each of the 3 sheets administered. Our results reveal a strong association between the UD Interference Test and other reference tests measuring information processing speed and attention, which suggests high concurrent validity. These results are consistent with those of similar studies, which have shown that other versions of the Stroop test are also associated with tests evaluating these domains.4 It also presents good construct validity, showing better correlation with the constructs psychomotor speed and attention than with verbal fluency or learning and verbal memory.
Unlike other versions of the Stroop test, the UD Interference Test presents items in large print with easily distinguishable colours, enabling its use for the evaluation of elderly people and individuals with colour-blindness. Other authors have accounted for the limitations of elderly people, creating a version including the colours red, green, and yellow16; however, that version is not suitable for people with difficulties distinguishing red and green. Furthermore, the UD Interference Test presents a shorter administration time than other versions of the test, facilitating its inclusion in test batteries and its use with easily fatigable patients.
Sociodemographic variables had a significant effect on performance. As in previous studies using the Stroop test,4,5,16–23 age and level of education strongly influenced test performance, with poorer performance in older individuals and those with lower levels of education. Our results show that sex only influences the interference index, with men scoring slightly better; this is consistent with the findings of other studies that report no sex-related differences in the variables W, C, or WC,5,17,18 and contradicts the findings of other studies reporting that women performed better in some sheets,7,19,21 especially with respect to the interference index.20 In the light of this, normalisation took into account both age and education level; thus, norms are individually adapted for the specific characteristics of each individual assessed.
It should be noted that direct scores should not be used to compare performance on different sheets, as they present different difficulty levels. Therefore, the optimal way of comparing performance on each sheet is by using normative data such as SS or percentile rank.38
This study presents norms for each of the 3 sheets in the UD Interference Test and for the interference index. The value of this index is that it offers a score for performance on the WC sheet that takes into account the examinee’s performance on previous sheets (with neutral stimuli). This index offers a reference, but should be interpreted with caution,39 as it is highly variable over time.
The limitations inherent to stratified sampling of participants are explained in the previous study on the Normacog project.28 Normative data are limited to the characteristics of the individuals evaluated; therefore, taking into account data from the Spanish National Statistics Institute, we sought to select a sample that is sufficiently representative of the Spanish population. Individuals with higher levels of education are more represented. Furthermore, it is challenging to access elderly individuals with high levels of education; this situation is representative of the elderly population in Spain. Despite this, our study provides data for correcting scores for age and level of education; therefore, results can be tailored to the characteristics of each examinee. One possible limitation for the validity of the test is the lack of data in other versions of the Stroop test against which to compare performance on the UD Interference Test.
Future studies should seek to obtain data for other countries, as the only normative data available for this test are for the Spanish population and the Spanish-language version. Furthermore, the norms presented are only applicable to the adult population; therefore, given the extensive use of the Stroop test in paediatric populations, it would be interesting to validate and normalise the UD Interference Test for the evaluation of children. It would also be interesting for future studies to compare the UD Interference Test to other versions of the Stroop test.
ConclusionWe present the UD Interference Test, an alternative version of the Stroop test that addresses some limitations of previous versions. It presents good reliability and validity. The normative data presented are adapted to the sociodemographic characteristics of the Spanish population; these data, adjusted for the age and level of education of each individual, provide healthcare professionals with reliable, quality information.
FundingThis study was funded by the Department of Health and Consumer Affairs of the regional government of the Basque Country, Spain [project n.∘ 2011111102]; Basic and Applied Research Project of the regional government of the Basque Country [project n.∘ PI 2014 1 43]; the University of Deusto in Bilbao, Spain (FPI-UD grant awarded to O. Sáez-Atxukarro); and Fundación Vicente Mendieta y Lambarri, Spain (2019 Research Grants programme, awarded to O. Sáez-Atxukarro).
Conflicts of interestNatalia Ojeda, Rocío del Pino, and Javier Peña are co-authors and copyright holders of the UD Interference Test.
The authors would like to thank all participants, S. Vela (Ibi-CEAM Elderly Care Centre), B. Sanchís (Centro Sejaa, department of psychology, paedagogy, and nutrition), N. Pardo (Neurodem, clinical neurology department), A. Aznar (Ateneo, Fundación de Daño Cerebral Adquirido), and L. López (Vitoria), for their collaboration and support in the Neurocog project.
