


The progressive deterioration of patients with spinocerebellar ataxia (SCA) has a major impact on their health-related quality of life (HRQOL). This study evaluates HRQOL in a sample of patients diagnosed with SCA and aims to estimate the predictive ability of a set of sociodemographic variables for the different dimensions of the General Health Questionnaire.
MethodsA total of 80 patients diagnosed with SCA were assessed using a sociodemographic questionnaire and the SF-36 General Health Questionnaire. The sociodemographic variables studied were sex, age, presence of a carer, employment status, and time elapsed from diagnosis of the disease.
ResultsThe 8 subscales of the SF-36 show positive and significant correlations to one another. Mean scores obtained on each SF-36 subscale differ between women and men, although this difference is significant only on the general health subscale, with men scoring higher than women. We found significant age differences on the vitality and social function subscales, with higher scores among younger patients (<34 years). The variable ‘presence of a carer’ accounts for most of the total variance of the questionnaire.
ConclusionsThe SF-36 is a valid and useful instrument for evaluating HRQOL in patients diagnosed with SCA. Presence of a carer seems to be a determinant of self-perceived quality of life in these patients.
El deterioro progresivo de los pacientes con ataxias espinocerebelosas (AEC) genera un gran impacto sobre su calidad de vida relacionada con la salud (CVRS). En este estudio se evalúa la CVRS en una muestra de pacientes diagnosticados de AEC y se pretende estimar la capacidad predictiva de un conjunto de variables sociodemográficas en las distintas dimensiones que conforman el cuestionario.
MétodosSe evaluó a un total de 80 pacientes diagnosticados de AEC, a través de un cuestionario sociodemográfico y del cuestionario genérico de salud SF-36. Se estudiaron variables sociodemográficas como sexo, edad, existencia de cuidador, situación laboral y tiempo desde el diagnóstico de la enfermedad.
ResultadosLas dimensiones que componen el SF-36 muestran correlaciones positivas y significativas entre ellas. Las puntuaciones medias obtenidas en cada una de las dimensiones difieren según el sexo, siendo significativa la diferencia solo en la dimensión salud general, con media más alta en los hombres. En relación con la edad, se encuentran diferencias significativas en las dimensiones vitalidad y función social, con puntuaciones mayores en el rango de menor edad (menores de 34 años). La variable que explica la mayor parte de la varianza del cuestionario es la existencia de cuidador.
ConclusionesEl Cuestionario de Salud SF-36 es un instrumento válido y fiable para medir la CVRS en pacientes con diagnóstico de AEC. Asimismo, la variable existencia de cuidador parece determinar la calidad de vida autopercibida por estos pacientes.
Spinocerebellar ataxia (SCA) comprises a group of clinically and genetically heterogeneous diseases characterised by cerebellar degeneration, including up to 17 types of SCA with an autosomal dominant inheritance pattern and 5 types of SCA with autosomal recessive inheritance.1 Overall SCA prevalence in Spain is 20.2 cases per 100000 population. The prevalence of the autosomal dominant types of SCA is 1.2 cases per 100000; prevalence of Friedreich ataxia, the most frequent autosomal recessive type of SCA, is 4.7 per 100000 population.1–4 Age at onset and symptoms vary according to the type of SCA. The disease is characterised by progressive degeneration of the cerebellum, brainstem, and spinocerebellar tracts resulting in progressive clinical deterioration of motor coordination and increasingly altered gait, manual dexterity, and speech. Life expectancy is 6 to 29 years shorter in these patients.5–8 Disease progression affects patients’ functional capacity, limits independence, and has a negative impact on quality of life, leading to the need for a carer, whether formal or informal, to complete daily living activities.9
Different tools for assessing self-perceived health status have been developed and their use has increased in the past decades; these tools have shown themselves to be valid for monitoring health status changes over time and for identifying certain factors that determine disease severity.10 In some neurodegenerative diseases, self-perceived health status depends not only on the disease itself, but also on such other factors as patients’ emotional state, coping strategies, comorbidities, and certain sociodemographic variables.8 These tools, available in the form of self-administered tests, are now used to assess health outcomes in clinical trials for therapeutic interventions and also in clinical practice and to evaluate the impact of healthcare policies.11
There is a wide range of generic and disease-specific tools available for evaluating and monitoring patients’ self-perceived health status. Disease-specific tools have been developed to assess the impact of a disease on self-perceived health-related quality of life (HRQoL); these tools display greater sensitivity and discriminant ability for the disease in question.10 Generic tools, such as the 36-Item Short Form Health Survey (SF-36),12 can be applied to both the general population and to patients with any type of disease.9,13,14 Although they are less sensitive to changes typical of a specific disease, they enable comparisons between patients with different diseases or between patients and the general population. Generic tools are therefore especially useful in health questionnaires and for healthcare policy planning.
Data on HRQoL in patients with SCA are extremely useful in patient management as indicators of disease progression and a means of assessing response to treatment. These data are also valuable at the population level: combined with other epidemiological markers, they provide information on the impact of these rare disorders, thus helping health authorities establish priorities and manage healthcare resources.
Despite the importance and potential usefulness of this information, no studies on HRQoL in the Spanish population with SCA have been published to date. In light of the above, the general purpose of this study is to provide clinicians and healthcare administrators with accurate information regarding the impact of SCA on patients’ HRQoL. The specific purposes of our study are as follows:
- –
To establish a multidimensional profile of self-perceived health status in a sample of patients with SCA.
- –
To estimate the predictive ability of certain sociodemographic variables for the different dimensions of SF-36.
We conducted a cross-sectional study including 80 patients diagnosed with SCA. Patients were recruited from the Federation of Regional Associations of Ataxia of Spain; additionally, we contacted members of the Spanish Rare Diseases Registries Research Network (SpainRDR) at the Institute of Health Carlos III, in Spain. To be included in the study, patients had to meet the diagnostic criteria for SCA and diagnosis had to be confirmed by a neurologist. Participants signed informed consent forms before they were included; the study was approved by the local clinical research ethics committees.
The study included data drawn from 2 self-administered questionnaires which were sent to patients by post. Participants who did not complete and return the questionnaires were contacted again 8 weeks after they had been sent.
The study protocol included the Spanish-language version of the SF-36 questionnaire (version 2) to assess patients’ HRQoL.15,16 SF-36 is a generic tool including 36 items that describe 8 dimensions of health status so as to provide a profile of patients’ health. Items detect both positive and negative states of health. Items in each dimension are coded; each item is assigned a numeric value on a scale of 0 (very low HRQoL status) to 100 (best health status). The SF-36 was designed as a global index of a patient's health status. The Spanish-language version has shown adequate reliability, validity, and cross-cultural equivalence.17 Likewise, several studies have published reference values for SF-36 scores in the general Spanish population, which allows us to qualitatively and quantitatively evaluate the impact of the disease and the benefits of healthcare services.18,19
Our study also included a sociodemographic questionnaire to gather the following additional data: age, sex, time since diagnosis, presence of a carer, time with carer, and employment status. Patients were divided into 3 groups by age: younger than 34, 34 to 45, and older than 45. Time since diagnosis was also classified in 3 groups: up to 7 years, 7 to 17 years, and more than 17 years. Employment status included 4 categories: active worker, homemaker, on temporary or permanent leave, and retired.
We applied descriptive and exploratory statistics to the studied variables. The t-test was used to compare means when necessary and in accordance with the aims of the study.
The Pearson correlation coefficient was used to analyse correlations between the dimensions included in the scale.
Likewise, we used stepwise linear regression to estimate the predictive ability of the sociodemographic variables studied for each of the dimensions making up SF-36. The coefficient of determination (R2) was used to assess whether the model fitted the data. Analysis of variance was used to confirm whether the adjusted regression model explained a significant part of global variability. Our study reports the confidence intervals, t-test values, and the significance level of the coefficients; linearity, homoscedasticity, and normality of data were confirmed through residual analysis. We also used the Durbin–Watson test for serial correlation and evaluated collinearity by examining tolerance and the variance inflation factor (VIF).
ResultsOur sample included 80 patients diagnosed with SCA; 56.3% of the sample were men (n=45). Patients were aged 20 to 67.8 (41.21±11.14 years). Regarding marital status, 35% were married or lived with their partners (n=28) and 62.5% (n=50) were single; 2.5% of the participants (n=2) did not answer this question. As for employment status, 43.8% of participants (n=35) were on temporary or permanent leave, 18.8% (n=15) were active workers, 11.3% (n=9) were retired, 7.5% (n=6) were homemakers, and 18.8% (n=15) did not answer this question. Regarding time since diagnosis, 31.3% of the participants (n=25) had been diagnosed less than 7 years previously, 33.8% (n=27) between 7 and 17 years previously, and 33.8% (n=27) more than 17 years previously; 1.3% of the patient sample (n=1) did not know or preferred not to answer this question. With regard to home care, 51.3% of the patients (n=41) reported being assisted by a carer for daily living activities, whereas 48.8% (n=39) did not report receiving assistance from a carer.
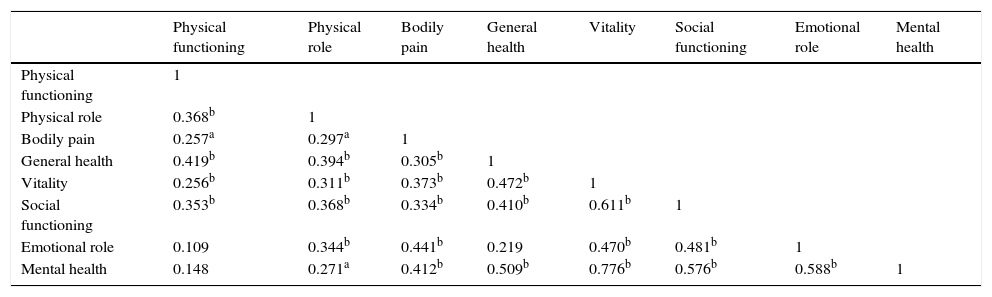
As for the correlations between the dimensions of the SF-36, the highest coefficient corresponds to mental health and vitality (0.776, significant) and the lowest, to emotional role functioning and physical functioning (0.109, non-significant). We should highlight that physical role, bodily pain, vitality, and social functioning were positively and significantly correlated with all the dimensions of the scale, whereas physical functioning and emotional role displayed the lowest number of significant correlations (Table 1).
Correlations between the dimensions of SF-36.
| Physical functioning | Physical role | Bodily pain | General health | Vitality | Social functioning | Emotional role | Mental health | |
|---|---|---|---|---|---|---|---|---|
| Physical functioning | 1 | |||||||
| Physical role | 0.368b | 1 | ||||||
| Bodily pain | 0.257a | 0.297a | 1 | |||||
| General health | 0.419b | 0.394b | 0.305b | 1 | ||||
| Vitality | 0.256b | 0.311b | 0.373b | 0.472b | 1 | |||
| Social functioning | 0.353b | 0.368b | 0.334b | 0.410b | 0.611b | 1 | ||
| Emotional role | 0.109 | 0.344b | 0.441b | 0.219 | 0.470b | 0.481b | 1 | |
| Mental health | 0.148 | 0.271a | 0.412b | 0.509b | 0.776b | 0.576b | 0.588b | 1 |
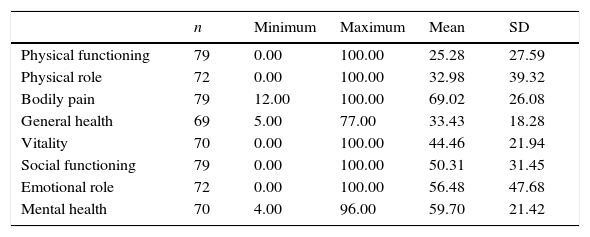
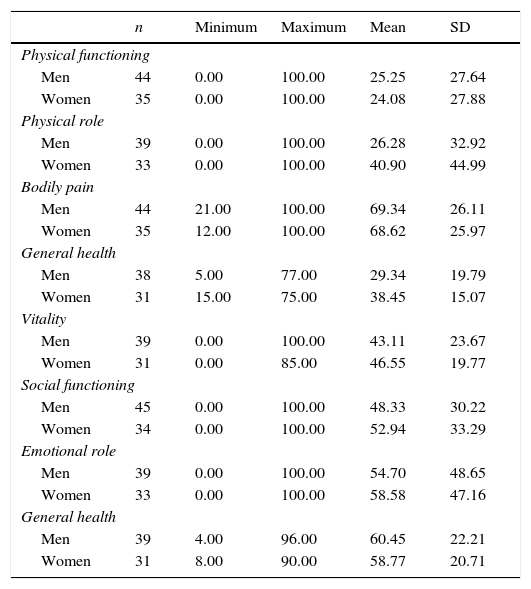
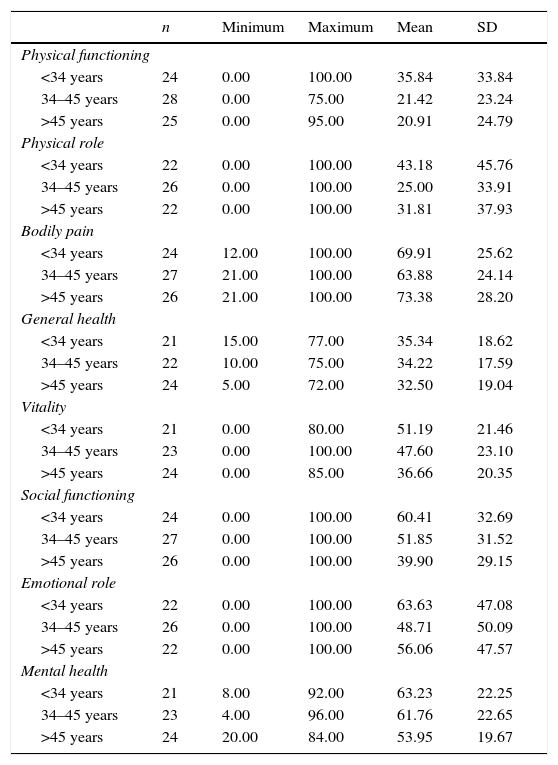
The mean descriptive results for the SF-36 dimensions are shown in Table 2. Tables 3 and 4 provide a breakdown of scores by sex and age group, respectively. Men display higher mean scores for the dimensions physical functioning, bodily pain, and mental health, whereas women display higher mean scores for physical role, general health, vitality, social functioning, and emotional role; however, differences between sexes were significant for general health only (t[67]=−9.102; P=.039). Regarding age, mean scores were higher in patients younger than 34 for all dimensions except for bodily pain; in this dimension, mean scores were higher in patients older than 45. Significant differences between age groups were only present in the dimensions vitality (t[43]=14.523; P=.025) and social functioning (t[48]=20.512; P=.023).
Minimum and maximum values, mean, and standard deviation of the dimensions of SF-36.
| n | Minimum | Maximum | Mean | SD | |
|---|---|---|---|---|---|
| Physical functioning | 79 | 0.00 | 100.00 | 25.28 | 27.59 |
| Physical role | 72 | 0.00 | 100.00 | 32.98 | 39.32 |
| Bodily pain | 79 | 12.00 | 100.00 | 69.02 | 26.08 |
| General health | 69 | 5.00 | 77.00 | 33.43 | 18.28 |
| Vitality | 70 | 0.00 | 100.00 | 44.46 | 21.94 |
| Social functioning | 79 | 0.00 | 100.00 | 50.31 | 31.45 |
| Emotional role | 72 | 0.00 | 100.00 | 56.48 | 47.68 |
| Mental health | 70 | 4.00 | 96.00 | 59.70 | 21.42 |
Minimum and maximum values, mean, and standard deviation of the dimensions of SF-36 by sex.
| n | Minimum | Maximum | Mean | SD | |
|---|---|---|---|---|---|
| Physical functioning | |||||
| Men | 44 | 0.00 | 100.00 | 25.25 | 27.64 |
| Women | 35 | 0.00 | 100.00 | 24.08 | 27.88 |
| Physical role | |||||
| Men | 39 | 0.00 | 100.00 | 26.28 | 32.92 |
| Women | 33 | 0.00 | 100.00 | 40.90 | 44.99 |
| Bodily pain | |||||
| Men | 44 | 21.00 | 100.00 | 69.34 | 26.11 |
| Women | 35 | 12.00 | 100.00 | 68.62 | 25.97 |
| General health | |||||
| Men | 38 | 5.00 | 77.00 | 29.34 | 19.79 |
| Women | 31 | 15.00 | 75.00 | 38.45 | 15.07 |
| Vitality | |||||
| Men | 39 | 0.00 | 100.00 | 43.11 | 23.67 |
| Women | 31 | 0.00 | 85.00 | 46.55 | 19.77 |
| Social functioning | |||||
| Men | 45 | 0.00 | 100.00 | 48.33 | 30.22 |
| Women | 34 | 0.00 | 100.00 | 52.94 | 33.29 |
| Emotional role | |||||
| Men | 39 | 0.00 | 100.00 | 54.70 | 48.65 |
| Women | 33 | 0.00 | 100.00 | 58.58 | 47.16 |
| General health | |||||
| Men | 39 | 4.00 | 96.00 | 60.45 | 22.21 |
| Women | 31 | 8.00 | 90.00 | 58.77 | 20.71 |
Minimum and maximum values, mean, and standard deviation of the dimensions of SF-36 by age group.
| n | Minimum | Maximum | Mean | SD | |
|---|---|---|---|---|---|
| Physical functioning | |||||
| <34 years | 24 | 0.00 | 100.00 | 35.84 | 33.84 |
| 34–45 years | 28 | 0.00 | 75.00 | 21.42 | 23.24 |
| >45 years | 25 | 0.00 | 95.00 | 20.91 | 24.79 |
| Physical role | |||||
| <34 years | 22 | 0.00 | 100.00 | 43.18 | 45.76 |
| 34–45 years | 26 | 0.00 | 100.00 | 25.00 | 33.91 |
| >45 years | 22 | 0.00 | 100.00 | 31.81 | 37.93 |
| Bodily pain | |||||
| <34 years | 24 | 12.00 | 100.00 | 69.91 | 25.62 |
| 34–45 years | 27 | 21.00 | 100.00 | 63.88 | 24.14 |
| >45 years | 26 | 21.00 | 100.00 | 73.38 | 28.20 |
| General health | |||||
| <34 years | 21 | 15.00 | 77.00 | 35.34 | 18.62 |
| 34–45 years | 22 | 10.00 | 75.00 | 34.22 | 17.59 |
| >45 years | 24 | 5.00 | 72.00 | 32.50 | 19.04 |
| Vitality | |||||
| <34 years | 21 | 0.00 | 80.00 | 51.19 | 21.46 |
| 34–45 years | 23 | 0.00 | 100.00 | 47.60 | 23.10 |
| >45 years | 24 | 0.00 | 85.00 | 36.66 | 20.35 |
| Social functioning | |||||
| <34 years | 24 | 0.00 | 100.00 | 60.41 | 32.69 |
| 34–45 years | 27 | 0.00 | 100.00 | 51.85 | 31.52 |
| >45 years | 26 | 0.00 | 100.00 | 39.90 | 29.15 |
| Emotional role | |||||
| <34 years | 22 | 0.00 | 100.00 | 63.63 | 47.08 |
| 34–45 years | 26 | 0.00 | 100.00 | 48.71 | 50.09 |
| >45 years | 22 | 0.00 | 100.00 | 56.06 | 47.57 |
| Mental health | |||||
| <34 years | 21 | 8.00 | 92.00 | 63.23 | 22.25 |
| 34–45 years | 23 | 4.00 | 96.00 | 61.76 | 22.65 |
| >45 years | 24 | 20.00 | 84.00 | 53.95 | 19.67 |
For each dimension on the scale, we analysed potential differences between the different sociodemographic variables; significant differences were found for the variables sex, presence of a carer, time since diagnosis, time with carer, and employment status.
Physical functioning: significant differences for the variables presence of a carer (t[77]=5.322; P=.000; mean scores were higher in patients reporting no carer assistance); time since diagnosis (t[49]=2.975; P=.005; mean scores were higher in patients diagnosed less than 7 years previously); and time with carer (t[58]=3.549; P=.001; mean scores were higher in patients receiving assistance for up to 3 years).
Physical role: significant differences were found for employment status (t[43]=2.518; P=.016); mean scores were higher in active workers.
Bodily pain: there were significant differences in time since diagnosis (t[49]=−2.654; P=.011); mean scores were higher for patients diagnosed with SCA between 7 and 17 years previously.
General health: significant differences were found for sex (t[67]=−2.108; P=.039; mean scores were higher in women) and presence of a carer (t[67]=2.260; P=.027; mean scores were higher in patients reporting no assistance).
Vitality: there were significant differences in age (t[43]=2.328; P=.025); mean scores were higher in patients younger than 34.
Social functioning: the variable age displayed significant differences (t[48]=2.345; P=.023); mean scores were higher in patients younger than 34.
Emotional role: significant differences were found for employment status (t[43]=2.643; P=.011); mean scores were higher in active workers.
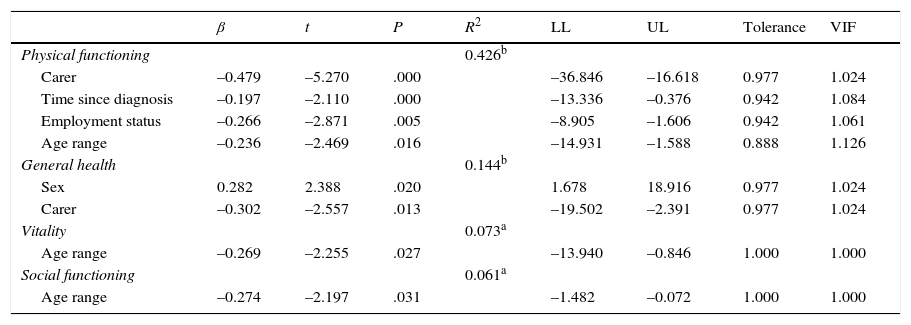
We conducted a stepwise linear regression analysis of the sociodemographic variables that had delivered significant differences in some of the dimensions of SF-36 (Table 5).
- –
In the dimension ‘physical functioning’, part of the variance is explained by the variables presence of a carer, time since diagnosis, employment status, and age (R2=0.426; F[4.71]=13.179; P=.000; Durbin–Watson statistic=2.328). Scores were higher in patients not receiving carer assistance, patients diagnosed less than 7 years previously, and patients younger than 34.
- –
In the dimension ‘general health’, part of the variance is explained by sex and presence of a carer; scores were higher in women and patients with no carers (R2=0.144; F[2.63]=5.311; P=.007; Durbin–Watson statistic=2.074).
- –
Part of the variance in the dimensions ‘vitality’ and ‘social functioning’ is explained by the age range variable (R2=0.073; F[1.65]=5.086; P=.027; Durbin–Watson statistic=1.496 and R2=0.061; F[1.74]=4.825; P=.031; Durbin–Watson statistic=1.928, respectively); in both cases, higher scores correspond to patients younger than 34.
Linear regression analysis of the sociodemographic characteristics and SF-36 scores.
| β | t | P | R2 | LL | UL | Tolerance | VIF | |
|---|---|---|---|---|---|---|---|---|
| Physical functioning | 0.426b | |||||||
| Carer | –0.479 | –5.270 | .000 | –36.846 | –16.618 | 0.977 | 1.024 | |
| Time since diagnosis | –0.197 | –2.110 | .000 | –13.336 | –0.376 | 0.942 | 1.084 | |
| Employment status | –0.266 | –2.871 | .005 | –8.905 | –1.606 | 0.942 | 1.061 | |
| Age range | –0.236 | –2.469 | .016 | –14.931 | –1.588 | 0.888 | 1.126 | |
| General health | 0.144b | |||||||
| Sex | 0.282 | 2.388 | .020 | 1.678 | 18.916 | 0.977 | 1.024 | |
| Carer | –0.302 | –2.557 | .013 | –19.502 | –2.391 | 0.977 | 1.024 | |
| Vitality | 0.073a | |||||||
| Age range | –0.269 | –2.255 | .027 | –13.940 | –0.846 | 1.000 | 1.000 | |
| Social functioning | 0.061a | |||||||
| Age range | –0.274 | –2.197 | .031 | –1.482 | –0.072 | 1.000 | 1.000 |
VIF: variance inflation factor; LL: lower limit, UL: upper limit.
The purpose of this study was to evaluate self-perceived HRQoL in a group of patients with SCA in Spain in order to provide clinicians and healthcare administrators with information on the impact of SCA on HRQoL, establish a multidimensional profile of self-perceived health status in our sample, and estimate the predictive ability of certain sociodemographic variables on the different dimensions of the SF-36.
Our results reveal significant correlations between the dimensions ‘physical role’, ‘bodily pain’, ‘vitality’, and ‘social functioning’, and all other dimensions of the SF-36. ‘Physical functioning’ and ‘emotional role’ are the dimensions displaying the weakest correlation with one another and the lowest number of significant correlations with other dimensions on the SF-36. This indicates that patients with SCA have functional dependence and relevant physical health problems that are even more marked than we might expect based on patients’ self-reported emotional and psychological assessment of their health status or physical functioning.
Regarding the sociodemographic variables analysed here, male sex displays higher mean scores in certain dimensions (‘physical functioning’, ‘bodily pain’, and ‘mental health’); however, differences between sexes were only significant for the dimension ‘general health’ (mean scores for men were higher than those for women). This suggests that, as a general rule, women with SCA have a better self-perceived health status than men.
Presence of a carer was another variable affecting the dimensions ‘physical functioning’ and ‘general health’: patients with no carers (that is, independent for daily living activities) score higher on these dimensions. We should point out that only 51.3% of the participants (n=41) reported being assisted by a carer; this figure, however, may not reflect the real presence of carer assistance since some participants may not recognise part-time assistance by a carer or any other person (self-reporting bias).
Age is a source of significant differences in the dimensions ‘vitality’ and ‘social functioning’ (mean scores are higher in patients younger than 34). None of the remaining sociodemographic variables were associated with significant differences in scores. This suggests that younger patients perceive their health problems as less likely to affect their social lives or perceptions of energy and vitality.
Regarding employment status, significant differences were found for the dimensions ‘emotional role’ and ‘physical role’ (active workers scored higher). This suggests that patients who are actively working feel that their disease has less of an impact on their physical health and emotional state.
Lastly, time since diagnosis was a variable linked to significant differences on the dimensions ‘bodily pain’ and ‘physical functioning’; mean scores were higher among patients diagnosed less than 7 years previously. The variable ‘time with carer’ was associated with significant differences in physical functioning; higher scores were associated with shorter times with a carer. These results support the idea of progressive deterioration in SCA: there seems to be a link between time from diagnosis and perception of decreased capacity, increased physical limitations, greater pain intensity, and the impact of all of these factors on daily living activities.
We would like to point out that, whereas none of the sociodemographic variables examined in our study had an impact on the dimension of mental health, previous studies of patients with other rare neurological diseases (for example, amyotrophic lateral sclerosis) showed that scores on this dimension were inversely correlated to time since diagnosis,13 an observation suggesting that the well-being paradox is not present in this case.
As we see, most SF-36 dimensions show significant differences for only one of the studied variables: ‘vitality’ and ‘social function’ for age, ‘emotional role’ and ‘physical role’ for employment status, and ‘bodily pain’ for time since diagnosis. ‘General health’ and ‘physical functioning’ were the only dimensions with significant differences in more than one sociodemographic variable; mental health, as mentioned previously, does not seem to be affected by any of the studied sociodemographic variables.
Only 4 dimensions on this questionnaire are explained by study variables; age partially explained scores on 3 dimensions (social functioning, vitality, and physical functioning) and need for carer partially explained scores on physical functioning and general health. This suggests that the studied sociodemographic variables do little to explain scores in patients with SCA; among these variables, need for carer has the greatest impact on scores, as previous studies have reported.8,13
Our study does have some limitations. We are aware that the small sample size undermines the external validity of our results. However, despite this limitation, such specific characteristics as age distribution, mean age, time since diagnosis, and disease duration in our sample are similar to those reported in previous studies, which indicates that our sample may be representative.20
SF-36 scores in our sample confirm that HRQoL is significantly lower in most patients with SCA. Although low scores on the physical dimensions of the questionnaire were to be expected due to associated motor disability, our sample also scored low on non-motor dimensions (social functioning and emotional role). These findings may be explained by poor sleep quality and frequent presence depression in these patients; according to several published studies, depression affects over 40% of patients with SCA.20,21
An important factor that seems to affect depression severity is progression of motor disability, which leads to gait impairment and need for a wheelchair. However, an endogenous origin cannot be ruled out since the neurodegeneration occurring in SCA may be linked to motor disability.22,23
Our data on HRQoL in Spanish patients with SCA differ from those reported for the general population or for patients with other chronic diseases.16,23–25 Contrary to typical observations in the general population, the HRQoL of patients with SCA in Spain is not as strongly affected by the variables age21,26 and female sex.27 However, we did find a correlation between HRQoL in these patients and disease duration (time since diagnosis), disease severity, and need for a carer to perform daily living activities. These findings are consistent with those reported by other studies of SCA using different generic tools for assessing HRQoL, such as EQ-5D.9,21,23,28
In summary, decreased HRQoL in SCA seems to be explained, at least partially, by loss of gait-related motor skills and the likely presence of depression and sleep disorders.20–22 Early detection and effective treatment of these variables may contribute to improving HRQoL in patients with SCA.21
Our findings suggests that making rehabilitation more accessible and intensive would delay and limit the physical deterioration leading to disability and loss of independence for walking and performing daily living activities. Psychotherapy, a supplementary treatment frequently requested by patients with SCA,29 may also contribute to reducing the impact of the disease on non-motor function.20 Likewise, using self-administered HRQoL questionnaires in routine clinical practice may provide useful additional information rarely obtained from conventional clinical assessment. Using SF-36 to measure HRQoL in patients with SCA in our setting would be useful not only for evaluating the results of studies and clinical trials, but also for assessing the real needs of these patients and their carers, which will result in better healthcare planning and allocation of resources.
FundingThis study received funding from the European Regional Development Fund (Institute of Health Carlos III, Spanish Ministry of Health, Social Services, and Equality).
Conflicts of interestThe authors have no conflicts of interest to declare.
We would like to thank all people, associations, and hospitals involved in this study for their invaluable support during the field work phase.
Please cite this article as: Sánchez-López CR, Perestelo-Pérez L, Escobar A, López-Bastida J, Serrano-Aguilar P. Calidad de vida relacionada con la salud en pacientes con ataxias espinocerebelosas. Neurología. 2017;32:143–151.
