


Neurological diseases explain a considerable proportion of admissions to paediatric intensive care units (PICU), and are a significant cause of morbidity and mortality. This study aims to analyse the functional progression of children with critical neurological conditions.
Material and methodsRetrospective descriptive study of children admitted to PICU with neurological diseases over a period of 3 years (2012 to 2014), assessing vital and functional prognosis at PICU discharge and at one year according to the Pediatric Cerebral and Overall Performance Category scales (PCPC-POPC) and the Functional Status Scale (FSS). The results are compared with our previous data (1990 to 1999), and those of the international multicentre PANGEA study.
Results266 children were studied. The mortality rate was 3%; the PRISM-III and PIM2 models did not show predictive ability. Clinically significant worsening was observed in functional health at discharge in 30% of the sample, according to POPC, 15% according to PCPC, and 5% according to FSS. After one year, functional performance improved according to PCPC-POPC, but not according to FSS. Children with no underlying neurological disease had a higher degree of functional impairment; this was prolonged over time. We observed a decrease in overall and neurocritical mortality compared with our previous data (5.60% vs 2.1%, P = .0003, and 8.44% vs 2.63%, P = .0014, respectively). Compared with the PANGEA study, both mortality and cerebral functional impairment in neurocritical children were lower in our study (1.05% vs 13.32%, P < .0001, and 10.47% vs 23.79%, P < .0001, respectively).
ConclusionsNearly one-third of critically ill children have neurological diseases. A significant percentage, mainly children without underlying neurological diseases, had a clinically significant functional impact at PICU discharge and after a year. Neuromonitoring and neuroprotection measures and the evaluation of functional progression are necessary to improve critical child care.
La patología neurológica representa parte importante en las unidades de cuidados intensivos pediátricos (UCIP), siendo causa de morbi-mortalidad. El objetivo es analizar la evolución funcional del niño crítico con patología neurológica.
Material y métodoEstudio retrospectivo descriptivo, de niños con patología neurológica ingresados en UCIP durante 3 años (2012-2014), valorando pronóstico vital y funcional, al alta y al año del ingreso, según las Categorías de Estado General y Cerebral Pediátrico (CEGP-CECP) y la Escala de Estado Funcional (FSS). Los resultados se comparan con nuestros datos previos (años 1990-1999), y los del estudio multicéntrico internacional PANGEA.
ResultadosSe estudian 266 niños. La mortalidad es del 3%; sin que los modelos PRISM-III y PIM2 muestren capacidad predictiva. La salud funcional refleja empeoramiento clínicamente significativo, al alta de UCIP, en 30% según CEGP, 15% según CECP, y 5% según FSS. Transcurrido un año, la funcionalidad mejora según CEGP-CECP, pero no según FSS. Los niños sin patología neurológica de base presentan afectación funcional en mayor porcentaje y mantenida. Comparado con nuestros datos previos, la mortalidad global y neurocrítica disminuye (5,60% vs 2,1%, p = 0,0003, y 8,44% vs 2,63% p = 0,0014, respectivamente). En relación con el estudio multicéntrico PANGEA, tanto la mortalidad como el empeoramiento funcional cerebral del niño neurocrítico, son menores en el estudio actual (1,05% vs 13,32%, p < 0,0001, y 10,47% vs 23,79% p < 0,0001, respectivamente).
ConclusionesAproximadamente un tercio de los niños críticos muestran patología neurológica. Un porcentaje importante, fundamentalmente de niños sin patología neurológica basal, presenta repercusión funcional clínicamente significativa, al alta de UCIP y transcurrido un año. La repercusión en el pronóstico funcional del niño crítico, apoya la importancia de la neuromonitorización y neuroprotección, medidas necesarias para mejorar la asistencia del niño crítico así cómo la valoración evolutiva de la salud funcional.
Neurological disease, whether primary or secondary to non-neurological critical illness, represents a significant problem in paediatric intensive care units (PICU) and a determinant of functional outcomes.1,2 Due to the high frequency and diversity of neurological diseases in these patients and the need to optimise neuroprotective measures, it is important to organise neurocritical care. The small size of the majority of PICUs means that establishing neurocritical care units is usually not justified. Therefore, the most appropriate model involves the creation of multidisciplinary teams coordinated by paediatric intensive care physicians and paediatric neurologists3,4; this was the strategy followed at Hospital Universitario Miguel Servet in Zaragoza, Spain.
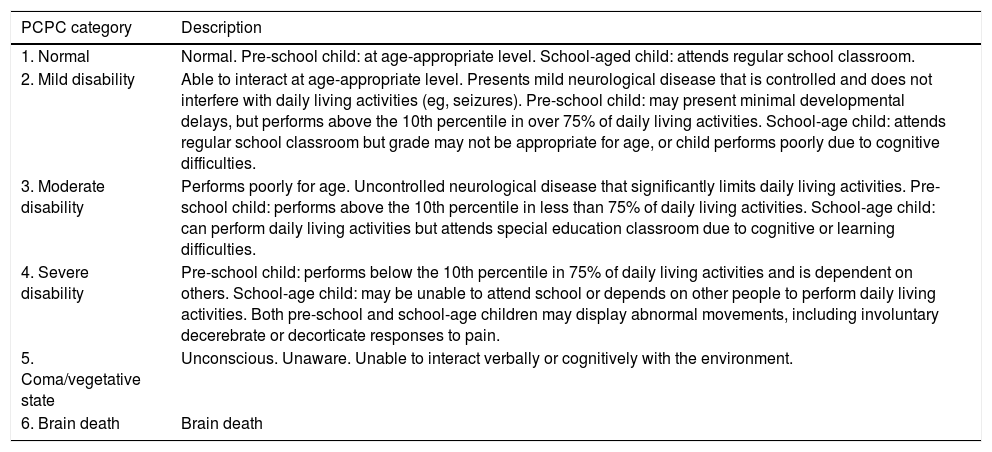
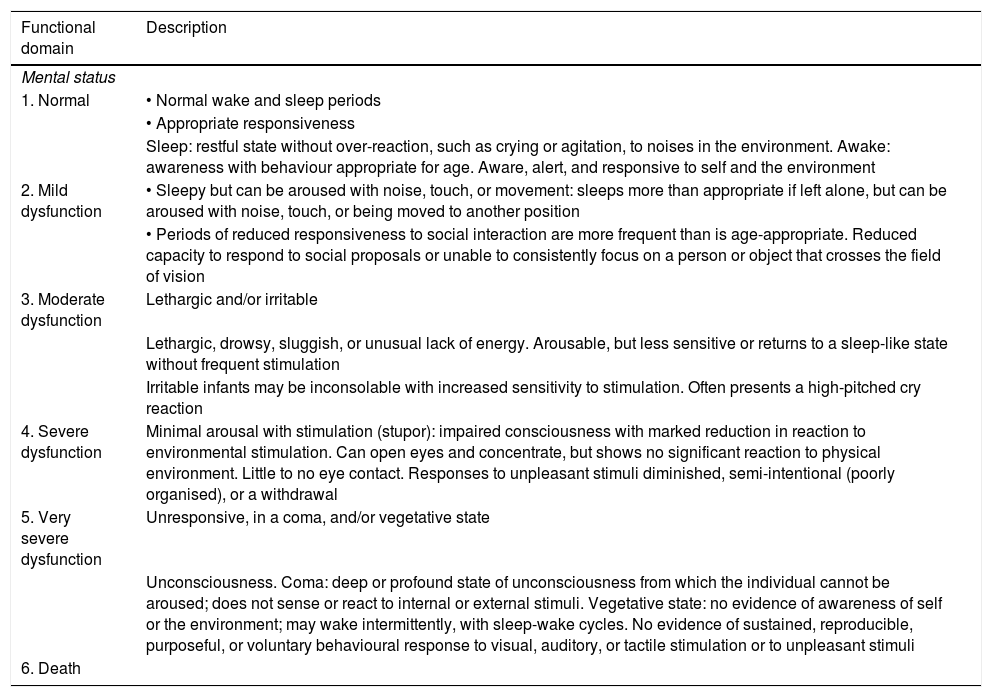
Due to the development and advances in paediatric intensive care, survival rates have increased5 and the central objective of these units has changed from “saving lives” to “saving functional lives,” aiming to achieve the best possible functional outcomes. The focus of prognostic evaluation studies has shifted from mortality to morbidity, assessing functional status and quality of life.6–8 The most appropriate concept for functional assessment in children is “functional health.” Several scales have been developed with a view to limiting the inevitable subjectivity involved in functional assessment. The Pediatric Cerebral and Overall Performance Category scales (PCPC and POPC, respectively; Table 1), based on observer impressions, constitute valid, reliable instruments and have been used in numerous paediatric studies, despite several limitations.9–12 A new instrument, the Functional Status Scale (FSS; Table 2), was published in 2009; this scale enables more disaggregated, defined, and accurate evaluation of patients of different ages, with better objectivity than the PCPC and POPC scales. The scale evaluates 6 functional domains (mental status, sensory functioning, communication, motor functioning, feeding, and respiratory status), which can be classified into 6 functional levels: 1) normal, 2) mild dysfunction, 3) moderate dysfunction, 4) severe dysfunction, 5) very severe dysfunction, and 6) death (the last category was added to the original scale to match the POPC and PCPC scales).13–15
POPC and PCPC categories of overall and cerebral functional status.9
| PCPC category | Description |
|---|---|
| 1. Normal | Normal. Pre-school child: at age-appropriate level. School-aged child: attends regular school classroom. |
| 2. Mild disability | Able to interact at age-appropriate level. Presents mild neurological disease that is controlled and does not interfere with daily living activities (eg, seizures). Pre-school child: may present minimal developmental delays, but performs above the 10th percentile in over 75% of daily living activities. School-age child: attends regular school classroom but grade may not be appropriate for age, or child performs poorly due to cognitive difficulties. |
| 3. Moderate disability | Performs poorly for age. Uncontrolled neurological disease that significantly limits daily living activities. Pre-school child: performs above the 10th percentile in less than 75% of daily living activities. School-age child: can perform daily living activities but attends special education classroom due to cognitive or learning difficulties. |
| 4. Severe disability | Pre-school child: performs below the 10th percentile in 75% of daily living activities and is dependent on others. School-age child: may be unable to attend school or depends on other people to perform daily living activities. Both pre-school and school-age children may display abnormal movements, including involuntary decerebrate or decorticate responses to pain. |
| 5. Coma/vegetative state | Unconscious. Unaware. Unable to interact verbally or cognitively with the environment. |
| 6. Brain death | Brain death |
| POPC category | Description |
|---|---|
| 1. Normal | Performs at age-appropriate level in daily living activities. Medical or physical problems do not interfere with normal activity. |
| 2. Mild disability | Mild medical or physical problems causing minor limitations that do not interfere with normal life (eg, asthma). Pre-school child: may present disabilities compatible with future independent life (eg, single amputation) and is able to perform over 75% of age-appropriate daily living activities. |
| 3. Moderate disability | Medical or physical problems interfere with normal activity. Pre-school child: unable to perform some daily living activities. School-age child: able to perform multiple daily living activities but presents physical disability (eg, cannot participate in sports competitions). |
| 4. Severe disability | Pre-school child: unable to perform most daily living activities. Pre-school child: dependent for most daily living activities. |
| 5. Coma/vegetative state | Unconscious. Unaware. Unable to interact verbally or cognitively with the environment. |
| 6. Brain death | Brain death |
Functional Status Scale.
| Functional domain | Description |
|---|---|
| Mental status | |
| 1. Normal | • Normal wake and sleep periods |
| • Appropriate responsiveness | |
| Sleep: restful state without over-reaction, such as crying or agitation, to noises in the environment. Awake: awareness with behaviour appropriate for age. Aware, alert, and responsive to self and the environment | |
| 2. Mild dysfunction | • Sleepy but can be aroused with noise, touch, or movement: sleeps more than appropriate if left alone, but can be aroused with noise, touch, or being moved to another position |
| • Periods of reduced responsiveness to social interaction are more frequent than is age-appropriate. Reduced capacity to respond to social proposals or unable to consistently focus on a person or object that crosses the field of vision | |
| 3. Moderate dysfunction | Lethargic and/or irritable |
| Lethargic, drowsy, sluggish, or unusual lack of energy. Arousable, but less sensitive or returns to a sleep-like state without frequent stimulation | |
| Irritable infants may be inconsolable with increased sensitivity to stimulation. Often presents a high-pitched cry reaction | |
| 4. Severe dysfunction | Minimal arousal with stimulation (stupor): impaired consciousness with marked reduction in reaction to environmental stimulation. Can open eyes and concentrate, but shows no significant reaction to physical environment. Little to no eye contact. Responses to unpleasant stimuli diminished, semi-intentional (poorly organised), or a withdrawal |
| 5. Very severe dysfunction | Unresponsive, in a coma, and/or vegetative state |
| Unconsciousness. Coma: deep or profound state of unconsciousness from which the individual cannot be aroused; does not sense or react to internal or external stimuli. Vegetative state: no evidence of awareness of self or the environment; may wake intermittently, with sleep-wake cycles. No evidence of sustained, reproducible, purposeful, or voluntary behavioural response to visual, auditory, or tactile stimulation or to unpleasant stimuli | |
| 6. Death | |
| Functional domain | Description |
|---|---|
| Sensory functioning | |
| 1. Normal | Intact hearing and vision |
| Intact hearing: moves eyes and/or head toward sound stimuli | |
| Intact vision: turns gaze to focus on people or objects that cross visual field | |
| 2. Mild dysfunction | Suspected hearing or vision loss |
| Suspected hearing or vision loss: inconsistently focuses on sound or movement | |
| Responsiveness to touch not impaired | |
| 3. Moderate dysfunction | Non-reactive either to auditory or to visual stimulation |
| Lack of evidence of hearing or lack of evidence of vision; does not focus or locate sounds | |
| Responsiveness to touch not impaired | |
| 4. Severe dysfunction | Non-reactive both to auditory and to visual stimulation |
| Lack of evidence of hearing and lack of evidence of vision; does not focus or locate sounds | |
| Responsiveness to touch not impaired | |
| 5. Very severe dysfunction | Does not respond normally to touch |
| Does not respond normally to touch or pain; lacks purposeful or semi-purposeful movement. May show withdrawal or spinal reflex | |
| 6. Death | |
| Functional domain | Description |
|---|---|
| Communication | |
| 1. Normal | Age-appropriate sounds and interactive facial expressions or gestures |
| Infants create sounds to make presence known. Children use words to convey needs. Interactive facial expressions and gestures are non-verbal communication, often associated with emotion | |
| 2. Mild dysfunction | Less likely to make sounds or facial expressions and show decreased social expression (facial or verbal) |
| 3. Moderate dysfunction | Does not express attention-getting behaviour |
| Does not display attention-getting behaviour, or cannot communicate needs | |
| 4. Severe dysfunction | Does not demonstrate discomfort |
| May not cry or cries very little during painful or uncomfortable procedures | |
| 5. Very severe dysfunction | Lack of communication: does not communicate using voice, body posture, or facial expression. Does not express physiological or psychological needs |
| 6. Death | |
| Functional domain | Description |
|---|---|
| Motor functioning | |
| 1. Normal | • Coordinated body movements, and |
| • Normal muscle control, and | |
| • Awareness of action | |
| Movements are coordinated with normal muscle control. Awareness of action and its purpose. Examples: can hold objects and transfer them between hands, suck thumb, write, or play with toys | |
| 2. Mild dysfunction | • One limb is functionally impaired. |
| Partial or complete loss of function in one limb | |
| May be caused by medical devices such as restraints, bandages, or casts; or by physical issues such as deformities, weakness, stiffness, spasticity, and/or movement disorders | |
| Weakness: patients cannot move a limb off a surface, against gravity, while holding an object, or against resistance. May be able to perform age-appropriate activities, but with increased effort | |
| Stiffness: at least one limb has increased resistance to passive motion, but is held in normal positions. Stimulation causes extension or arching, rather than flexion | |
| Spasticity: increased muscle tone with involuntary movement. Limb reflexes are exaggerated. Resistance to flexion, and the neck extends excessively. | |
| 3. Moderate dysfunction | • 2 or more limbs are functionally impaired |
| Partial or complete loss of function in 2 or more limbs | |
| *Ataxia is included in this category. | |
| 4. Severe dysfunction | • Poor head control/hypotonia of cervical muscles |
| Poor head control: decreased ability to hold the head upright at 90°. If the body is supported, the head falls back, to the side, or to the front. Unable to bring head to the upright position when sitting, or to the midline position when prone/supine | |
| 5. Very severe dysfunction | Paralysed/decerebrate posturing/decorticate posturing |
| Paralysis: loss of voluntary motor function, no abnormal muscle tone. Mental status may be preserved or altered. | |
| Decerebrate posturing: rigid extension of all extremities, with internal rotation; toes flex downwards. | |
| Decorticate posturing: rigid flexion of upper extremities, with clenched fists and straightening of lower extremities | |
| 6. Death | |
| Functional domain | Description |
|---|---|
| Feeding | |
| 1. Normal | Can consume all food by mouth, with age-appropriate help |
| No parenteral or gavage feeding | |
| Age-appropriate feeding methods. Energy (caloric) content is not taken into account. | |
| 2. Mild dysfunction | Specialised foods (higher energy or density) |
| No parenteral feeding or gastric or intestinal tube. Dextrose solutions of 5% or lower are not considered parenteral nutrition. | |
| Increased-density feeding with specialised formulas or additions to the diet | |
| 3. Moderate dysfunction | Age-inappropriate help with feeding is needed. |
| Feeding by a caretaker or use of a feeding aid at an age when independent feeding would be expected | |
| 4. Severe dysfunction | Feeding tube with or without parenteral nutrition |
| Parenteral nutrition includes intravenous administration through a peripheral or central vein with dextrose solution of 5% or higher. Lipids and proteins are generally included. Tube feeding includes nasogastric/orogastric tubes, transpyloric tubes, and gastrostomy/duodenostomy. | |
| 5. Very severe dysfunction | Complete parenteral nutrition |
| 6. Death | |
| Functional domain | Description |
|---|---|
| Respiratory status | |
| 1. Normal | Breathes air without increased oxygen concentration or artificial support |
| Breathes room air without artificial aid, including oxygen, suctioning, or mechanical support | |
| 2. Mild dysfunction | Oxygen is supplied through any apparatus (cannula, face mask), or suctioning of the airway is performed. |
| 3. Moderate dysfunction | Tracheostomy |
| 4. Severe dysfunction | Continuous positive airway pressure treatment for all or part of the day, provided through a mask or tracheostomy |
| Mechanical ventilator support includes positive or negative pressure or bilevel ventilation devices. | |
| 5. Very severe dysfunction | Mechanical ventilatory support required all day and night |
| 6. Death | |
This study aims to use the PCPC and POPC scales and the FSS to study the functional prognosis of paediatric intensive care patients with neurological disease, and to compare results against data from 1990 to 1999 from our hospital16 and data from the international PANGEA study,17 a cross-sectional prospective study analysing the prevalence and prognosis of acute neurological disease between 2011 and 2012 at 126 PICUs in 6 continents.
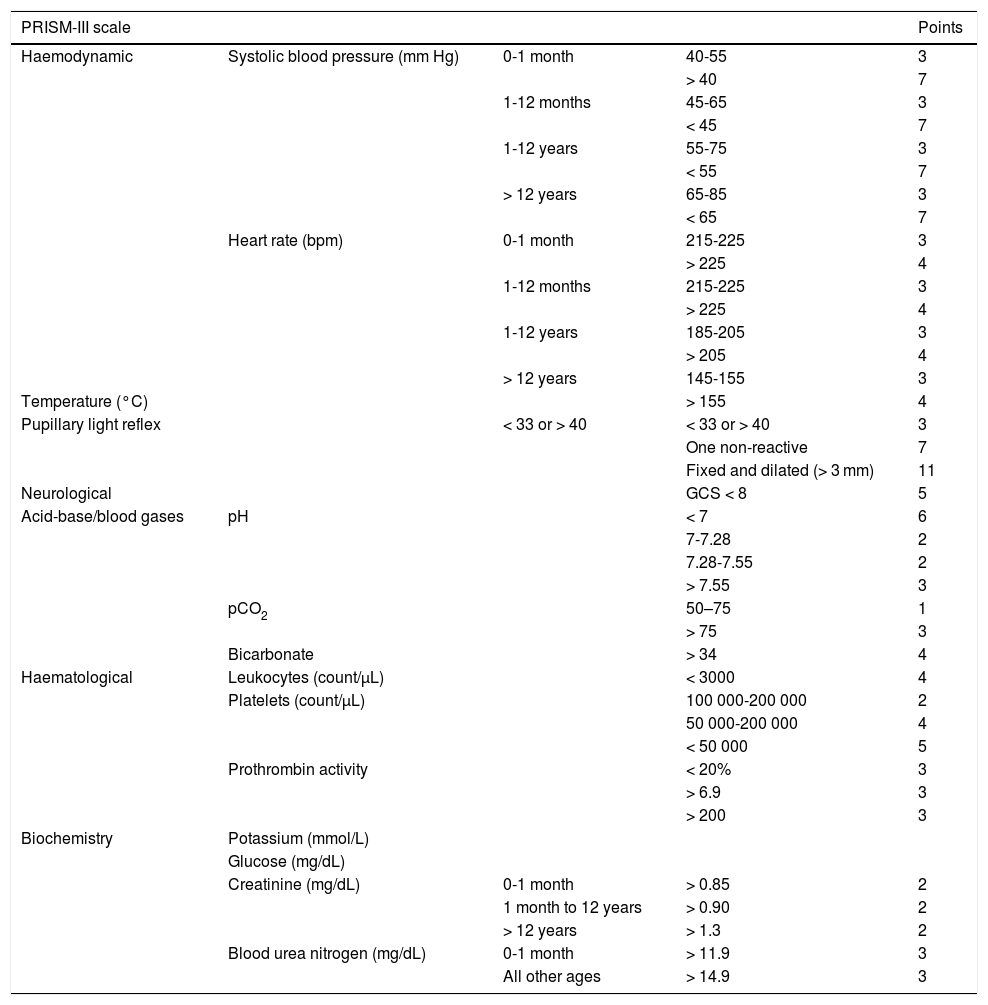
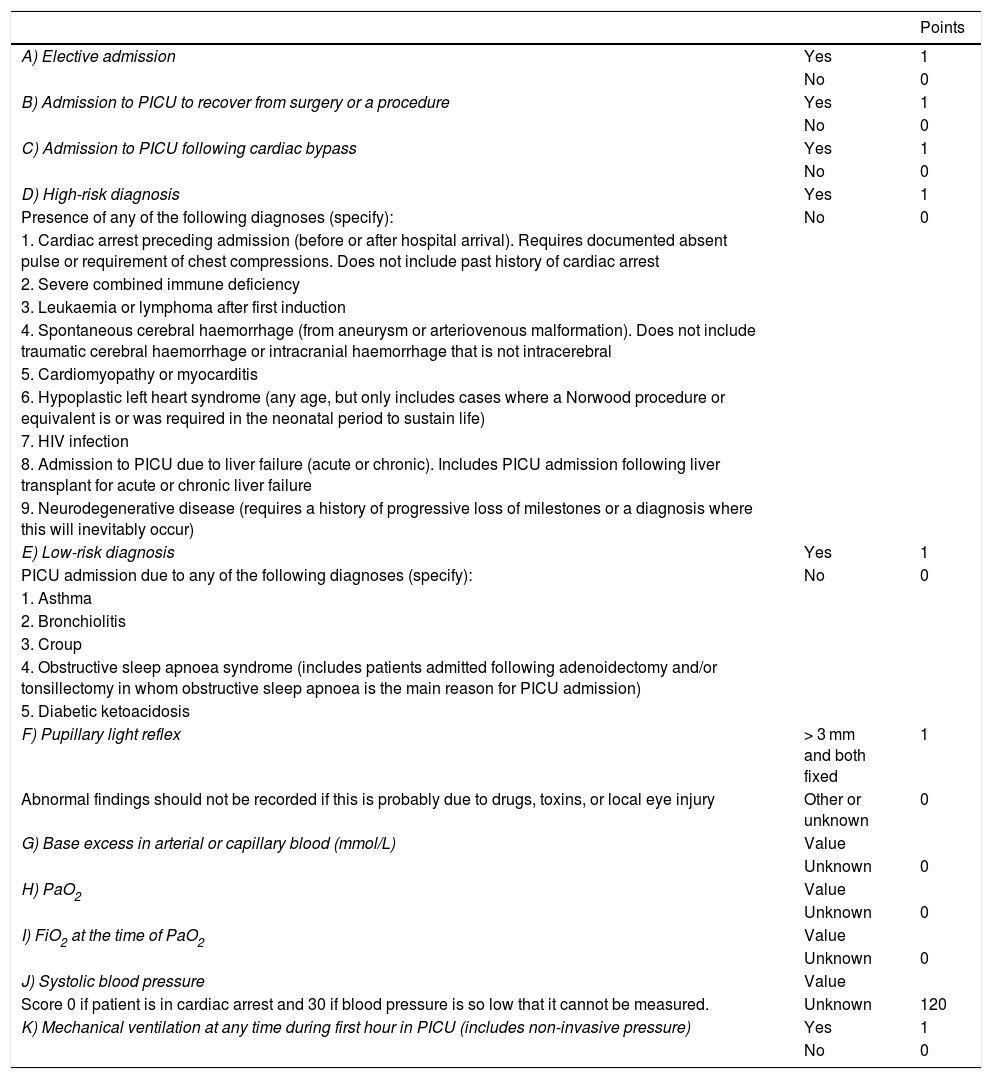
Material and methodsWe conducted a descriptive, retrospective, observational analysis of the 266 children admitted to the PICU at our tertiary hospital between January 2012 and December 2014 due to primary or secondary neurological disease. Patients were divided into 4 groups: A) children with known neurological diseases admitted to the PICU for non-neurological conditions; B) children with known neurological diseases admitted due to acute complications of the disease; C) children without known neurological diseases admitted due to acute neurological symptoms; and D) children without known neurological diseases who presented secondary neurological damage after admission due to non-neurological conditions. Patient outcomes were evaluated in terms of mortality and morbidity. We also studied the usefulness of the Pediatric Risk of Mortality calculator, version III (PRISM-III) and the Pediatric Index of Mortality, version 2 (PIM2) as predictors of mortality; these instruments are based on a series of clinical and laboratory parameters recorded at admission (Tables 2 and 3).18,19 Morbidity was evaluated by assessing functional status using the POPC and PCPC scales and the FSS one year after discharge from the PICU. The 6 items of the new FSS scale, which enable more disaggregated, objective assessment, complicate the presentation of data. Therefore, these items were recoded for our analysis. The mean score for the 6 items was calculated to create a new subscore, “overall FSS.” The mean score for items related to neurological function was calculated to establish the 2 neurological FSS subscores “neuro1 FSS,” including the first 4 FSS items, and “neuro2 FSS,” including the first 3 items, which evaluate cognitive function. Based on these scores, a patient’s functional status may be classified as favourable (normal function or mild dysfunction), or unfavourable (moderate, severe, or very severe dysfunction, or death). To analyse functional outcomes of PICU admission, we compared scores at discharge and one year after discharge against baseline scores; a change from favourable to unfavourable functional health classification was considered to indicate clinically significant worsening of functional status.
Pediatric Risk of Mortality Score III.18
| PRISM-III scale | Points | |||
|---|---|---|---|---|
| Haemodynamic | Systolic blood pressure (mm Hg) | 0-1 month | 40-55 | 3 |
| > 40 | 7 | |||
| 1-12 months | 45-65 | 3 | ||
| < 45 | 7 | |||
| 1-12 years | 55-75 | 3 | ||
| < 55 | 7 | |||
| > 12 years | 65-85 | 3 | ||
| < 65 | 7 | |||
| Heart rate (bpm) | 0-1 month | 215-225 | 3 | |
| > 225 | 4 | |||
| 1-12 months | 215-225 | 3 | ||
| > 225 | 4 | |||
| 1-12 years | 185-205 | 3 | ||
| > 205 | 4 | |||
| > 12 years | 145-155 | 3 | ||
| Temperature (°C) | > 155 | 4 | ||
| Pupillary light reflex | < 33 or > 40 | < 33 or > 40 | 3 | |
| One non-reactive | 7 | |||
| Fixed and dilated (> 3 mm) | 11 | |||
| Neurological | GCS < 8 | 5 | ||
| Acid-base/blood gases | pH | < 7 | 6 | |
| 7-7.28 | 2 | |||
| 7.28-7.55 | 2 | |||
| > 7.55 | 3 | |||
| pCO2 | 50–75 | 1 | ||
| > 75 | 3 | |||
| Bicarbonate | > 34 | 4 | ||
| Haematological | Leukocytes (count/μL) | < 3000 | 4 | |
| Platelets (count/μL) | 100 000-200 000 | 2 | ||
| 50 000-200 000 | 4 | |||
| < 50 000 | 5 | |||
| Prothrombin activity | < 20% | 3 | ||
| > 6.9 | 3 | |||
| > 200 | 3 | |||
| Biochemistry | Potassium (mmol/L) | |||
| Glucose (mg/dL) | ||||
| Creatinine (mg/dL) | 0-1 month | > 0.85 | 2 | |
| 1 month to 12 years | > 0.90 | 2 | ||
| > 12 years | > 1.3 | 2 | ||
| Blood urea nitrogen (mg/dL) | 0-1 month | > 11.9 | 3 | |
| All other ages | > 14.9 | 3 | ||
Note worst score in the first 24 hours.
Calculation of risk of death:
PRISM-III logit = (0.207 × PRISM) – (0.005 × age in months) – 0.4333 × 1 (if postsurgical) – 4.782
Risk of death = e PRISM-III logit/(1 + ePRISM-III logit), where e = 2.7183
GCS: Glasgow Coma Scale.
These results are compared against data from a previous study performed at our unit16 between 1990 and 1999 and from the international PANGEA study.17
Quantitative data were tested for normal distribution using the Kolmogorov-Smirnov test, and are presented as measures of central tendency (mean or median) and dispersion (standard deviation [SD] and interquartile range [IQR], respectively). Qualitative variables are expressed as frequencies or percentages. In the comparative statistical analysis, we determined whether the variables followed a normal distribution, using the Kolmogorov-Smirnov test if n ≥ 30 and the Shapiro-Wilk test if n < 30. As the variables did not follow a normal distribution, non-parametric tests were used for univariate statistical analysis. The non-parametric Kruskal-Wallis test was used to study the relationship between qualitative and quantitative variables. Statistical analysis was performed using the SPSS software (version 18.0). The threshold for statistical significance was set at α = .05 for all analyses. The study was approved by the Clinical Research Ethics Committee of the region of Aragon.
ResultsOur hospital’s PICU recorded 1178 admissions during the study period; 323 (27.5%) correspond to 266 children presenting neurological diseases either as the reason for admission or with onset during hospitalisation at the PICU. Patients were distributed among the groups established as follows: A) 53 (20.3%) children with known neurological diseases admitted due to non-neurological conditions; B) 84 (31.6%) children with known neurological diseases admitted due to acute symptoms of the disease; C) 107 (40.2%) children without known neurological diseases admitted due to acute neurological symptoms; and D) 22 (8.3%) children without known neurological diseases who presented secondary neurological injuries after admission due to non-neurological conditions. Statistical analysis considers the total number of patients; for patients admitted more than once, the first episode is analysed. The median age of our sample was 58 months (IQR, 94). Of the 266 patients, 163 were boys (61.3%) and 103 were girls (38.7%). Median duration of hospitalisation was 2 days (IQR, 2) (Table 4).
Pediatric Index of Mortality 2 scale.19
| Points | ||
|---|---|---|
| A) Elective admission | Yes | 1 |
| No | 0 | |
| B) Admission to PICU to recover from surgery or a procedure | Yes | 1 |
| No | 0 | |
| C) Admission to PICU following cardiac bypass | Yes | 1 |
| No | 0 | |
| D) High-risk diagnosis | Yes | 1 |
| Presence of any of the following diagnoses (specify): | No | 0 |
| 1. Cardiac arrest preceding admission (before or after hospital arrival). Requires documented absent pulse or requirement of chest compressions. Does not include past history of cardiac arrest | ||
| 2. Severe combined immune deficiency | ||
| 3. Leukaemia or lymphoma after first induction | ||
| 4. Spontaneous cerebral haemorrhage (from aneurysm or arteriovenous malformation). Does not include traumatic cerebral haemorrhage or intracranial haemorrhage that is not intracerebral | ||
| 5. Cardiomyopathy or myocarditis | ||
| 6. Hypoplastic left heart syndrome (any age, but only includes cases where a Norwood procedure or equivalent is or was required in the neonatal period to sustain life) | ||
| 7. HIV infection | ||
| 8. Admission to PICU due to liver failure (acute or chronic). Includes PICU admission following liver transplant for acute or chronic liver failure | ||
| 9. Neurodegenerative disease (requires a history of progressive loss of milestones or a diagnosis where this will inevitably occur) | ||
| E) Low-risk diagnosis | Yes | 1 |
| PICU admission due to any of the following diagnoses (specify): | No | 0 |
| 1. Asthma | ||
| 2. Bronchiolitis | ||
| 3. Croup | ||
| 4. Obstructive sleep apnoea syndrome (includes patients admitted following adenoidectomy and/or tonsillectomy in whom obstructive sleep apnoea is the main reason for PICU admission) | ||
| 5. Diabetic ketoacidosis | ||
| F) Pupillary light reflex | > 3 mm and both fixed | 1 |
| Abnormal findings should not be recorded if this is probably due to drugs, toxins, or local eye injury | Other or unknown | 0 |
| G) Base excess in arterial or capillary blood (mmol/L) | Value | |
| Unknown | 0 | |
| H) PaO2 | Value | |
| Unknown | 0 | |
| I) FiO2 at the time of PaO2 | Value | |
| Unknown | 0 | |
| J) Systolic blood pressure | Value | |
| Score 0 if patient is in cardiac arrest and 30 if blood pressure is so low that it cannot be measured. | Unknown | 120 |
| K) Mechanical ventilation at any time during first hour in PICU (includes non-invasive pressure) | Yes | 1 |
| No | 0 |
Calculation of risk of death:
PIM2 logit = [−0.9282 × A] + [−1.0244 × B] + [0.7507 × C] + [1.6829 × D] + [−1.5770 × E] + [3.0791 × F] + [0.104 × absolute value of G] + [0.2888 × (I× 100/H)] + [0.01395 × (absolute value of J – 120)] + [1.3352 × K] – 4.8841
Risk of death = ePIM2 logit/(1 + ePIM2 logit), where e = 2.7183
HIV: human immunodeficiency virus; PICU: paediatric intensive care unit.
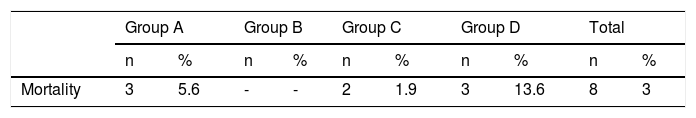
The overall mortality rate at the PICU during the study period was 2.1% (25 deaths from a total of 1178 admissions), whereas mortality in our sample was 3% of all patients and 2.5% of all admissions (Table 5). Estimated risk of mortality based on the PIM2 and PRISM-III scales was 5.99% and 24.5%, respectively. Estimated risk of mortality was 85.47% (PRISM-III) and 64.46% (PIM2) for patients who died during hospitalisation and 22.64% and 4.18% for those who survived.
At discharge, POPC scores showed either no change or clinically significant improvements in overall function in 73.7% of the sample, and worsening in 26.3%; PCPC scores showed either no change or clinically significant improvements in cerebral function in 89.5% of the sample, and worsening in 10.5%. Fig. 1 shows these changes for each patient group. FSS scores at discharge were more favourable than the results of the classic POPC and PCPC scales: at discharge, overall FSS scores showed either no change or clinically significant improvements in overall function in 96.2% of the sample, and worsening in 3.8%. Neurological and cognitive function (neuro1 and neuro2 FSS scores, respectively) at discharge showed the same progression: no change or improvement in 96.2% of patients and worsening in 3.8%. Fig. 2 shows changes in recoded FSS scores for each patient group.

Overall and cerebral functional status at discharge from the paediatric intensive care unit according to the Pediatric Cerebral and Overall Performance Category scales. Changes in each patient group. Change at discharge: no change/improvement or worsening.
Group A: n = 53; group B: n = 84; group C: n = 107; group D: n = 22.
. Changes in each patient group. Change at discharge: no change/improvement or worsening. Group A: n = 53; group B: n = 84; group C: n = 107; group D: n = 22.")
Overall and neurological functional status at discharge from the paediatric intensive care unit according to the recoded Functional Status Scale (overall, neuro1, and neuro2 FSS). Changes in each patient group. Change at discharge: no change/improvement or worsening.
Group A: n = 53; group B: n = 84; group C: n = 107; group D: n = 22.
At one year, POPC scores showed either no change or clinically significant improvements in overall function in 94.3% of the sample, and worsening in 5.6%; PCPC scores showed no change in brain function in 93.6% of the sample, clinically significant improvements in 1.5%, and worsening in 4.9%. Overall FSS scores showed either no change or clinically significant improvements in overall function in 89.5% of the sample, and worsening in 10.5%. Neurological function (neuro1 FSS) showed no change or clinically significant improvement in 89.1% of the sample and worsening in 10.9%. Cognitive function (neuro2 FSS) showed either no change or clinically significant improvements in 89.5% of the sample, and worsening in 10.5%. Figs. 3 and 4 show one-year outcomes for each patient group according to the POPC and PCPC scales and each of the 3 FSS subscores.

Overall and cerebral functional status one year after discharge from the paediatric intensive care unit according to the Pediatric Cerebral and Overall Performance Category scales. Changes in each patient group. Change at one year: no change/improvement or worsening.
Group A: n = 53; group B: n = 84; group C: n = 107; group D: n = 22.
. Changes in each patient group. Change at one year: no change/improvement or worsening. Group A: n = 53; group B: n = 84; group C: n = 107; group D: n = 22.")
Overall and neurological functional status one year after discharge from the paediatric intensive care unit according to the recoded Functional Status Scale (overall, neuro1, and neuro2 FSS). Changes in each patient group. Change at one year: no change/improvement or worsening.
Group A: n = 53; group B: n = 84; group C: n = 107; group D: n = 22.
Assessment of paediatric intensive care patients with neurological diseases at our unit, with data from series studied since 1990, enables evaluation of recent progress through comparison of data on incidence and vital and functional prognosis. Caution should be applied when comparing some results, as previous studies focused on PICU admissions, whereas the current study analyses individual patients in order to optimise results on medium- to long-term prognosis.
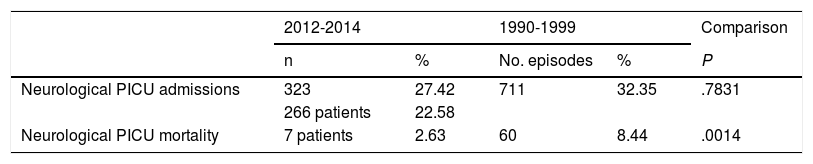
Between 15 May 1990 and 31 December 1999, 2198 patients were admitted to our PICU; 711 admissions (32.34%) involved some type of neurological condition. This is similar to the percentage recorded in the period analysed in this study (27.42%: 323 admissions of a total of 1178). Table 6 compares data from the period analysed in this study and against data from 1990 to 1999. The overall mortality rate for the unit decreased significantly (5.60% vs 2.1%, P = .0003), as did mortality among patients with neurological conditions (8.44% vs 2.63%; P = .0014).
Comparison of the period analysed in this study and data from 1990-1999.
| 2012-2014 | 1990-1999 | Comparison | |||
|---|---|---|---|---|---|
| n | % | No. episodes | % | P | |
| Neurological PICU admissions | 323 | 27.42 | 711 | 32.35 | .7831 |
| 266 patients | 22.58 | ||||
| Neurological PICU mortality | 7 patients | 2.63 | 60 | 8.44 | .0014 |
| Admissions and mortality by diagnosis | Comparison | |||||||||
|---|---|---|---|---|---|---|---|---|---|---|
| Reason for admission | Mortality | Reason for admission | Mortality | Reason for admission | Mortality | |||||
| n | % | n | % | n | % | n | % | P | P | |
| TBI | 103 | 38.72 | - | - | 255 | 35.86 | 80 | 3.64 | .41 | .000 |
| Seizures | 49 | 18.42 | - | - | 119 | 16.74 | 57 | 2.59 | .53 | .000 |
| Acute encephalopathy | 54 | 20.3 | 25 | 2.12 | 105 | 14.77 | 190 | 8.64 | .04 | .000 |
| Hydrocephalus/VPS dysfunction | 68 | 25.56 | 15 | 2.11 | .000 | |||||
| Neurosurgery (tumour) | 23 | 9.5 | - | - | 70 | 9.85 | 2 | 1.09 | .66 | .0003 |
| Neurosurgery (all) | 66 | 24.81 | - | - | 127 | 17.86 | 2 | 1.57 | .01 | .30 |
| Cardiorespiratory arrest | 11 | 4.1 | 4 | 36.36 | 24 | 3.38 | 7 | 29.17 | .57 | .92 |
PICU: paediatric intensive care unit.
TBI: traumatic brain injury; VPS: ventriculoperitoneal shunt.
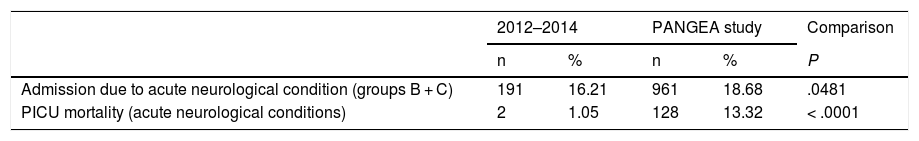
Table 7 compares data from groups B and C from our sample against data on neurocritical care patients from the PANGEA study. In a cross-sectional study with data collection on 4 dates between 29 November 2011 and 24 July 2012, a total of 5145 patients were admitted to the PICUs included in the study. Of these, 961 (18.70%) presented some acute neurological condition, compared to 191 patients in groups B and C in our study (16.21% of all admissions; P = .0481). Both mortality rates and rates of clinically significant worsening in neurological function were greater in the PANGEA study.
Comparison of data from this study and from the PANGEA study.
| 2012–2014 | PANGEA study | Comparison | |||
|---|---|---|---|---|---|
| n | % | n | % | P | |
| Admission due to acute neurological condition (groups B + C) | 191 | 16.21 | 961 | 18.68 | .0481 |
| PICU mortality (acute neurological conditions) | 2 | 1.05 | 128 | 13.32 | < .0001 |
| Neuromonitoring and treatment techniques (percentage of PICU admissions for acute neurological conditions) | |||||
|---|---|---|---|---|---|
| n | % | n | % | P | |
| ICP monitoring | 14 | 7.33 | 144 | 14.98 | .005 |
| EEG | 36 | 18.85 | 388 | 40.37 | < .0001 |
| CT | 85 | 44.50 | 578 | 60.15 | .0001 |
| MRI | 31 | 16.23 | 457 | 47.55 | < .0001 |
| Mechanical ventilation | 76 | 39.79 | 540 | 56.19 | < .0001 |
| AEDs | 42 | 21.99 | 409 | 42.56 | < .0001 |
| 1st level ICH treatment | 22 | 11.52 | 191 | 19.88 | .0066 |
| 2nd level ICH treatment | 2 | 1.05 | 90 | 9.37 | < .0001 |
| Cerebral functional status (PCPC) at baseline, at discharge from the PICU, and change between admission and discharge (improvement or no change/worsening) | |||||
|---|---|---|---|---|---|
| n | % | n | % | P | |
| Good PCPC category (1–2) at baseline | 165 | 86.39 | 637 | 75.38 | .001 |
| Good PCPC category (1–2) at discharge | 145 | 75.92 | 393 | 49 | < .0001 |
| Worsening of cerebral function at discharge | 20 | 10.47 | 201 | 23.79 | < .0001 |
AED: antiepileptic drug; CT: computed tomography; EEG: electroencephalography; ICH: intracranial hypertension; ICP: intracranial pressure; MRI: magnetic resonance imaging; PCPC: Pediatric Cerebral Performance Category; PICU: paediatric intensive care unit.
Brain injury is a highly significant factor in morbidity and mortality in paediatric intensive care patients.2 Our results provide an overview of neurological care in our hospital’s PICU during the period studied. Approximately one-third (27.5%) of PICU admissions involved neurological conditions. The overall mortality rate was approximately 2%. While clear differences were observed between patients who died and those who survived in the estimated risk of mortality calculated with the PRISM-III and PIM2 scales, these were not statistically significant. The mortality rate was particularly high after recovery from cardiorespiratory arrest (45.4%), similar to findings reported in the literature (25% to 50%)14; this demonstrates the importance of training in cardiopulmonary resuscitation. The brain is the organ with the greatest vulnerability to hypoxia and ischaemia, and plays a significant role in progression and prognosis after resuscitation.20–22
The most appropriate model of morbidity is functional status, assessed with instruments including the classic POPC and PCPC scales9,11,12 and the new FSS.13,15 This study assesses 2 possible outcomes after admission, at discharge, and at one year: no change or clinically significant improvement, and clinically significant worsening.
Although over 70% of the sample, according to the POPC, and over 85%, according to the PCPC, presented favourable functional outcomes after discharge from the PICU, efforts to optimise paediatric intensive care should focus particularly on the group of patients with clinically significant worsening of functional status, given the significant potential impact on their quality of life.23 The functional impact on patients without underlying neurological diseases, who nearly always present good functional status at baseline, is particularly important.
FSS scores at discharge were more favourable, with over 95% of patients showing good overall and neurological functional progression.
At one year after PICU discharge, POPC and PCPC scores showed functional improvements, reflecting plasticity, the ability to recover, and the importance of rehabilitation treatment. However, favourable functional progression was not observed in 100% of patients. Patients presenting secondary brain injury without underlying neurological diseases represented the group with the worst outcomes at one year, with around 20% of patients showing poor functional progression according to PCPC and POPC scores. While FSS scores were more favourable at discharge, functional progression at one year was slightly poorer, particularly in group A; this may be explained by degeneration due to the underlying disease. As with the PCPC and POPC scales, the FSS clearly shows sustained functional impact in group D.
Compared to previous data from our hospital (1990 to 1999),16 the percentage of admissions due to neurological disease has remained stable, with an increase in the total number of PICU admissions. Mortality has reduced overall and among neurocritical care patients. Crucial elements in this trend are advances in the prevention and treatment of intracranial hypertension,24 isotonic intravenous fluid therapy to reduce iatrogenic hyponatraemia,23,25 decompressive craniectomy,26–28 and early treatment with high-dose corticosteroids.29,30 As the older study did not analyse functional prognosis, we are unable to establish whether this decrease in mortality rates has led to worse functional outcomes, as has been suggested in other studies.31,32
Our sample included a similar percentage of patients with acute neurological conditions to that reported in the international PANGEA study.17 Mortality and neurological functional impact are greater in patients with acute neurological conditions from the PANGEA study than in our sample. This noteworthy difference is explained by the fact that the PANGEA study used data from units around the world, in countries with different levels of development; this also explains the less favourable neurological functional status (PCPC) at baseline in that study. Poorer status at baseline and the high percentage of patients recovering from cardiorespiratory arrest explain the higher mortality rate.
New data from the multicentre PANGEA study have recently been published,33 and show the great impact of acute neurological injury on paediatric health worldwide, given the high incidence and significant impact in terms of morbidity and mortality. This demonstrates the pressing need for future studies aiming to optimise neuromonitoring techniques and to develop new treatments.
Neurological surveillance and neuroprotection are fundamental in the management of all paediatric critical care patients23; multidisciplinary care is essential in this work. Objective, systematic evaluation of overall and neurological functional health at discharge from the PICU and follow-up of functional progression are essential tasks for these teams. Such scales as the POPC, PCPC, and FSS should be employed to ensure the objectivity of this evaluation.
At our hospital, the PICU is run by a multidisciplinary team following consensus protocols that are constantly reevaluated and updated, minimising variability and optimising the quality of care provided to paediatric neurocritical care patients, in a process of improvement with no end date.
Conflicts of interestThe authors have no conflicts of interest to declare.
Please cite this article as: Madurga Revilla P, López Pisón L, Samper Villagrasa P, García Íñiguez JP, Garcés Gómez R, Domínguez Cajal M, et al. Patología neurológica en una unidad de cuidados intensivos pediátricos de tercer nivel. Evolución funcional. Nuestra experiencia. Neurología. 2020;35:381–394.
