


Under China’s dual circulation strategy, traditional industries that are highly dependent on international supply chains face significant challenges requiring restructuring. This study develops a multi-scale analytical model that integrates the Global Trade Analysis Project (GTAP) with the enormous regional model (TERM), enhanced by sectoral decomposition techniques, to enable a detailed assessment of how free trade agreements (FTAs) influence spatial and industrial reconfigurations. Using China’s paper industry as a case study, we systematically examine how the Regional Comprehensive Economic Partnership (RCEP) reshapes domestic and global value chain dynamics. The analysis reveals three key structural changes: (1) upstream sectors exhibit material substitution, with increased imports of wood and non-wood pulp while domestic waste pulp production grows, signaling a strategic reallocation of resources; (2) midstream sectors, particularly in corrugated board and paperboard production, demonstrate geographic shifts, and coastal clusters are relocating capacity to RCEP partner countries, while inland areas see capacity growth driven by regional policy incentives; and (3) downstream industries benefit from upstream agglomeration effects, leading to a 5 % to 30 % increase in paper product output in Guangdong, Jiangsu, Zhejiang, and Anhui provinces. Quantitatively, the RCEP generates synergistic gains through international specialization and domestic clustering, contributing to a 0.33 % annualized compound growth rate in sectoral output. These findings empirically support the effectiveness of industrial transition strategies, suggesting three policy recommendations: (1) establishing strategic reserves for critical raw materials; (2) developing differentiated regional industrial roadmaps; and (3) leveraging agglomeration economies to optimize domestic production networks. Methodologically, this study advances computable general equilibrium (CGE) models in assessing the impacts of FTAs on industrial restructuring, offering actionable insights for globally dependent industries undergoing strategic transitions.
The increasing complexity of cross-border production networks and concurrent shifts in global value chain (GVC) restructuring have brought the interaction between international trade agreements and domestic industrial restructuring to the forefront of scholarly inquiry. China’s dual circulation strategy, a key macroeconomic framework, aims to enhance domestic market autonomy while simultaneously deepening international engagement. This strategy comprises two interrelated pillars: external circulation, which focuses on strengthening international integration, and internal circulation, which emphasizes domestic economic development and industrial upgrading.
The Regional Comprehensive Economic Partnership (RCEP), the world’s largest free trade agreement (FTA), primarily serves as a policy tool to promote external circulation by fostering regional integration, expanding market access, and optimizing resource allocation among member economies. However, its impact on internal circulation is also significant, albeit more indirect. The RCEP reshapes GVC dynamics and international trade patterns, which in turn drive domestic industrial restructuring and influence the trajectory of technological innovation within China (Li, 2020). Consequently, examining the role of the RCEP in reshaping international economic structures and its effect on industrial restructuring in China under the dual circulation strategy is essential.
The paper industry serves as an ideal case study for evaluating FTA-driven industrial restructuring within the context of China’s dual circulation strategy due to three key structural characteristics. First, the industry’s significant exposure to GVCs, with over half of China’s wood pulp and chemical additives reliant on imports from Brazil, Canada, Indonesia, and the United States (Jiang & Su, 2023), underscores the sector’s vulnerability to external shocks and its critical role in China’s external circulation. This reliance mirrors challenges faced by Latin America's pulp exporters and the Association of Southeast Asian Nations (ASEAN) timber sectors (Midgley et al., 2017; da Silva & Maciel, 2022), highlighting the tension between leveraging FTAs for global market access and ensuring domestic supply chain resilience, an important consideration for internal circulation.
Second, China’s paper industry exhibits pronounced spatial heterogeneity, with regional disparities in production. Coastal clusters, such as those in Guangdong and Jiangsu, demonstrate a much higher export orientation than inland provinces like Anhui and Hubei (Cheng et al., 2023). These regional disparities mirror the convergence challenges within internal circulation, similar to the patterns observed in Brazil’s pulp industry and Vietnam’s electronics sector under FTAs (He & Barr, 2004). These disparities underscore how FTAs can influence the spatial balance of domestic production.
Third, the strong relationship between policy and trade, alongside FTA-driven industrial relocation, provides a valuable opportunity to analyze the mechanisms through which the RCEP’s external circulation policies reshape internal circulation. Specifically, the tariff reductions and trade facilitation measures under the RCEP offer a natural experiment for studying how FTAs accelerate the spatial reallocation of industrial activity, similar to phenomena observed in Mexico’s automotive sector post-USMCA and Vietnam’s repositioning within the electronics GVCs (Tian et al., 2021; da Silva & Maciel, 2022). This provides evidence of the profound influence FTAs have on global production networks and domestic industrial landscapes.
This study introduces a novel multi-scale analytical framework to address the limitations of existing research, which often lacks global-domestic integration and sectoral granularity. This framework integrates the global-level Global Trade Analysis Project (GTAP) and the domestic-level computable general equilibrium (CGE) model known as the enormous regional model (TERM), providing a rigorous evaluation of how FTAs impact globally dependent industries undergoing strategic transitions within the context of China’s dual circulation strategy. Building on Horridge’s (2012) pioneering work in agricultural sector decomposition, this research extends the TERM methodology to China’s paper industry—a globally integrated yet resource-constrained sector—by introducing three key methodological advancements. First, a novel multi-scale linkage mechanism is developed through a bidirectional soft-linking protocol between GTAP and TERM. This innovative approach enables the simultaneous analysis of international trade policy shocks (such as tariff reductions under the RCEP) and their heterogeneous effects on provincial-level production adjustments within China. By explicitly connecting global trade flows and price changes with regional economic responses, this method overcomes the scale mismatch challenge that often hampers single-country CGE studies, which typically fail to adequately capture intra-national or regional heterogeneity (Cheng et al., 2023). This provides a more realistic and policy-relevant assessment of FTA impacts.
Second, sectoral granularity is significantly enhanced through the adaptation of agricultural input-output disaggregation techniques. China’s paper industry comprises 12 distinct sub-sectors (e.g., wood pulp, waste pulp, and corrugated board) based on the 2017 National Economic Industry Classification (GB/T4757-2017). This refined sectoral classification allows for the precise tracking of raw material flows, revealing crucial spatial patterns such as the concentration of imported wood pulp in coastal provinces and the clustering of waste pulp recycling in inland regions (Tian et al., 2021). This level of granularity enables a more nuanced understanding of how FTAs affect different segments of the paper industry and their interconnections.
Third, the proposed framework demonstrates universal applicability. Although it is tailored to the Chinese context, its modular design makes it easily adaptable to other national CGE models, such as Australia’s Victoria University Regional Model (VURM) and Brazil’s TERM (TERM-BR). The primary requirements for adaptation are the availability of provincial or state-level input-output data and significant GVC participation in the sectors under investigation. This adaptability broadens the potential impact of the methodology for analyzing FTA-driven industrial restructuring across diverse economies.
By integrating this multi-scale trade modeling approach with sector-specific CGE frameworks grounded in neoclassical trade theory and regional economics, this study offers a more robust and policy-relevant approach to examining the strategic transitions of globally dependent industries within the context of China’s dual circulation strategy and modern FTAs.
Previous researchThe role of FTAs in industrial restructuringFTAs fundamentally reshape global economic landscapes by driving industrial restructuring. This transformation primarily occurs through enhanced trade liberalization, facilitated capital flows, and accelerated technological exchange (Li & Wang, 2021). Existing research consistently demonstrates that FTAs play a significant role in improving supply chain efficiency, thereby enabling structural upgrades and deeper integration within GVCs.
Macro-level impacts and GVC integrationAt the macroeconomic level, FTAs play a crucial role in fostering global production fragmentation and forming intricate production networks (Aichele & Heiland, 2018). Specifically, Aichele and Heiland (2018) highlight how FTAs improve supply chain coordination and efficiency, leading to widespread industrial restructuring and optimized trade dynamics. These agreements intensify international competition and reconfigure industries, encouraging greater vertical specialization across national, regional, and global levels (Bamber et al., 2017). Consequently, FTAs reinforce global integration, facilitating the diffusion of technology, expansion of markets, and specialization of industries (Li & Wang, 2021). This integration is key to enhancing overall economic welfare and growth (Petri & Plummer, 2016).
Short-term adjustments and long-term structural shiftsThe economic effects of FTAs manifest through short-term market adjustments and long-term structural shifts (Zeng & Tan, 2021). In the short term, FTAs lead to immediate responses such as tariff reductions, capital reallocation, and improvements in supply chain efficiency, allowing firms to quickly adapt to evolving trade conditions (Boudreau et al., 2023). These immediate adjustments often include increased labor market flexibility (Davidescu et al., 2020), capital optimization (Moszoro, 2021), and efficient resource redeployment (Handfield et al., 2020). Additionally, cross-border input sourcing (Öberg & Alexander, 2019) and technology diffusion (Chiu & Lin, 2022) are crucial in enhancing short-term supply chain resilience, especially for globally integrated industries. Current research on FTA-driven industrial upgrading often focuses on quantifying these immediate impacts, particularly through analyzing changes in tariffs and trade facilitation measures (Yang et al., 2015).
In the long term, FTAs trigger more profound transformations, influencing capital investment patterns, wage structures, and industrial competitiveness, which foster innovation-driven restructuring (Maliszewska et al., 2020). These shifts contribute to enhancing domestic production capacity while simultaneously deepening integration into GVCs (Ivanov, 2022). Furthermore, FTAs provide institutional mechanisms that facilitate the transition toward circular economy models, promoting waste reduction (Yu et al., 2023), resource optimization (Gao et al., 2023), eco-friendly industrial practices, and carbon-neutral strategies (Chirumalla et al., 2024). This is particularly relevant for sectors such as paper manufacturing, where raw material dependency and production sustainability are essential for long-term competitiveness (Tian et al., 2021).
Spatial restructuring and resource-intensive industriesFTAs significantly influence the spatial distribution of industries by promoting regional economic integration and the strategic reallocation of resources (Li, 2020). This is evident in studies demonstrating that trade liberalization can lead to spatial differences in employment adjustments within countries (He & Zhou, 2019). At the sectoral level, FTAs are particularly critical in enhancing competitiveness within resource-intensive industries (Thomas and Sanil, 2019). For example, trade liberalization has been shown to improve supply chain efficiency, foster higher productivity, and expand global market access in sectors such as India’s spice industry (Thomas and Sanil, 2019) and the copper mining industries in Zambia and the Democratic Republic of Congo (Celestin et al., 2024). In resource-intensive sectors such as pulp and paper, FTAs can trigger regional industrial relocation due to shifts in comparative advantage (Tijaja & Faisal, 2014).
FTAs and China’s industrial restructuring under dual circulationWithin China’s overarching dual circulation strategy, FTAs—specifically the RCEP—play an essential role in optimizing domestic industrial structures while strengthening global trade linkages (Qi, 2024). The RCEP functions as an external circulation gripper by providing access to a vast regional market, thereby driving economies of scale and export-oriented growth (Yu, 2021). Simultaneously, it acts as a catalyst for internal circulation upgrades, exposing domestic industries to intensified competition, which drives significant restructuring and innovation to maintain competitiveness (Song et al., 2021). This dynamic aligns with China’s broader goal of enhancing its domestic market autonomy and strategic engagement in the international economy.
Research gaps in the literatureWhile existing research affirms the critical role of FTAs in driving industrial upgrading and global integration (Flaig & Greenville, 2021), a significant gap remains. Most studies focus on either the macro-level or a general sectoral level and lack the granularity of sector-specific and regionally disaggregated analysis. Few studies thoroughly explore how FTAs impact traditional, resource-dependent industries with substantial global exposure—such as paper manufacturing—especially when these industries are navigating national strategic frameworks like dual circulation (Li et al., 2023). This study seeks to address this gap by offering a granular, sector-specific analysis of how the RCEP influences industrial restructuring through detailed supply chain transformation and spatial relocation dynamics.
CGE models and economic analysis in industrial restructuringAnalyzing industrial restructuring, particularly under the influence of global trade policies, requires robust analytical frameworks that can capture complex economic inter-dependencies. Traditional input-output analysis has been widely used to assess the impacts of trade and industrial structures (Landesmann & Stöllinger, 2019; Wei & Xie, 2020; Timmer et al., 2021), mapping economic relationships between industries at domestic and international levels (Leontief, 1986). However, input-output models’ inherent static nature significantly limits their ability to account for dynamic price adjustments, supply constraints, and endogenous behavioral responses that characterize real-world economic shifts (Miller & Blair, 2009).
The economic foundations and advantages of CGE modelsCGE models effectively overcome the limitations of static input-output analysis by operating within a Walrasian general equilibrium framework, where all markets are assumed to clear (Shoven & Whalley, 1992). This allows CGE models to simulate how prices and quantities adjust across all sectors and factor markets in response to external shocks or policy interventions. The key economic advantages of CGE models, which distinguish them from input-output approaches, include the following:
- •
Endogenous adjustments and substitution effects: CGE models explicitly incorporate market mechanisms, enabling endogenous adjustments of prices and quantities to restore equilibrium after a shock. This capability captures critical substitution effects in production and consumption that are absent in static input-output models, offering a more realistic depiction of economic responses.
- •
Inter-sectoral resource reallocation: CGE models effectively track the reallocation of production factors (e.g., labor and capital) across various industries and regions in response to changes in relative returns, providing insights into dynamic structural adjustments (Shoven & Whalley, 1992).
- •
Holistic system-wide analysis: CGE models fully account for complex inter-industry input-output relationships, offering a comprehensive, system-wide view of economic impacts (Seti & Daw, 2022). This facilitates the analysis of both direct and indirect effects that propagate throughout the entire economic system, capturing feedback loops that are critical for policy evaluation.
Consequently, CGE models are superior tools for providing robust insights into both short-term market shocks and long-term structural impacts of policy changes, including those arising from trade liberalization (Shoven & Whalley, 1992).
CGE models in analyzing global trade, value chains, and China’s dual circulation strategyThe ability of CGE models to capture complex multi-country and multi-regional interactions makes them particularly well-suited for analyzing the impacts of FTAs on GVCs (Narjoko, 2011). By simulating changes in trade flows, tariffs, and non-tariff barriers across interconnected economies, CGE models can effectively project how FTAs reshape GVCs and influence industrial transformation pathways (Franco-Bedoya & Cappariello, 2020). For instance, CGE analyses have been instrumental in evaluating how regional FTAs, such as the RCEP, restructure supply chains, foster international circulation, and promote domestic economic upgrading (Ji et al., 2018). This application is directly relevant to the objectives of China’s dual circulation strategy, which seeks to optimize both domestic market dynamics and global economic engagement (Qi, 2024).
Methodological innovation and research gapsDespite the significant capabilities of CGE models in global trade analysis, several limitations persist in the existing literature, presenting opportunities for further methodological advancement. One common challenge is the scale mismatch, where studies rely on either single-country models lacking adequate regional disaggregation or global models that do not offer sufficient sub-national details. This limitation hinders a comprehensive assessment of heterogeneous spatial impacts within large and diverse economies such as China. Furthermore, few studies explicitly link macro-level trade policy changes from FTAs with sub-sectoral restructuring within traditional industries, especially those characterized by high GVC dependencies (Kanike, 2023).
To address these critical gaps, this study introduces a novel application of established CGE modeling techniques. Specifically, we employ a multi-scale analytical framework that integrates a global CGE model (GTAP) with a regionally disaggregated domestic CGE model (TERM). While the soft-linking protocol between GTAP and TERM builds upon the foundational work of Horridge and Zhai (2006), and the method for industrial sector disaggregation draws inspiration from approaches used in agricultural sector modeling (Wittwer & Horridge, 2009), our primary methodological innovation lies in the granular application and integration of these techniques to analyze specific sub-sectoral restructuring within China’s paper industry under the RCEP framework, particularly in the context of the dual circulation strategy. This unique combination and focus facilitate a more nuanced understanding of how FTA-induced trade shocks propagate from the global to the provincial level, influencing specific segments of a traditionally trade-dependent industry and contributing to both the theoretical and empirical understanding of dual circulation. Further details on the construction and calibration of this multi-scale framework, including the specific soft-linking protocol and adaptation of disaggregation techniques for the paper industry, are provided in the ‘Model construction and calibration’ portion of the next chapter.
Transforming supply chain-dependent industries: insights from the paper industryTraditional supply chain-dependent industries, such as the paper manufacturing sector, are increasingly exposed to significant vulnerabilities arising from GVC disruptions and tightening environmental regulations (Kanike, 2023; Odulaja et al., 2023). Unlike high-tech sectors, which often feature more modular and flexible production systems, traditional industries typically rely on centralized and less-flexible production processes, making them more susceptible to external shocks (Lund et al., 2019; Frederick et al., 2017; Bamber et al., 2017).
Existing literature consistently highlights the pivotal role of FTAs in facilitating industrial upgrading by lowering trade barriers, promoting capital and technology flows, and enhancing regional competitiveness (Aichele & Heiland, 2018; Flaig & Greenville, 2021). The paper industry, as a globally integrated and resource-intensive sector, serves as a compelling case study that exemplifies both the challenges and adaptive opportunities inherent in FTA-driven restructuring (Xiong & Cheng, 2018; Zhang & Hou, 2021). Notably, FTAs can trigger regional industrial relocation in resource-intensive sectors, such as pulp and paper, due to shifts in comparative advantage (Tijaja & Faisal, 2014). The sector’s substantial GVC exposure, particularly China’s dependence on imports for wood pulp and chemical additives from diverse international partners, underscores its vulnerability to external shocks and highlights its critical role in external circulation (Wang et al., 2024; Jiang & Su, 2023). Furthermore, the pronounced spatial heterogeneity within China’s paper industry, characterized by distinct coastal production clusters versus inland provinces, illustrates the regional convergence challenges inherent in internal circulation (Cheng et al., 2023). These structural characteristics make the paper industry an ideal case that facilitates the evaluation of FTA-driven industrial restructuring within the context of China’s dual circulation strategy.
However, most empirical studies on FTA impacts have predominantly focused on high-tech or export-oriented manufacturing industries, often overlooking traditional sectors such as paper manufacturing. These sectors face unique restructuring constraints, including high raw material dependence, intensive energy consumption, and limited production modularity (Song et al., 2021). Crucially, existing literature rarely addresses sub-sectoral differentiation (e.g., distinguishing between wood pulp, waste pulp, and various paper product categories) or the regionally uneven impacts of trade policy reforms within these traditional industries.
This study addresses these gaps in industrial characteristics and analytical granularity and undertakes a comprehensive analysis of China’s paper industry. By focusing on its internal value chain dynamics and spatial distribution, this research aims to track how trade policy changes, such as those induced by the RCEP, affect different segments (e.g., upstream, midstream and downstream) and how these effects vary across diverse product categories. This level of industry-specific and spatially detailed granularity is essential for a nuanced understanding of restructuring dynamics and for formulating targeted policy interventions within traditional, supply chain-dependent sectors.
Model and dataBefore exploring the impact of the RCEP on China’s paper industry’s global production scale and trade structure, we adopt a hybrid GTAP-TERM framework:
- •
GTAP is used to capture global trade dynamics and tariff changes.
- •
TERM simulates regional impacts at the provincial level within China, highlighting production shifts and supply chain restructuring.
By enhancing both models, this study establishes a solid methodological foundation for subsequent analysis, revealing the profound effects of the RCEP on the layout of China’s paper industry.
Model construction and calibrationEnhancing GTAP and TERM for GVC analysisThe standard GTAP model, while effective for conventional trade analysis, has limited applicability in GVC studies due to insufficient granularity in import sourcing dimensions. Building on the methodological framework established by Sun et al. (2022) and Li et al. (2023), we extend four key value-chain variable systems: value-added in global wholesaling (VIGW), value-added in production wholesaling (VIPW), value-added in financial wholesaling (VIFW), and value-added in transportation support services (VTSS). This extension incorporates multi-dimensional import sourcing features through an agent-based nesting framework that differentiates procurement channels across four economic actors: industrial firms, households, governments, and investors. Simultaneously, we recalibrate substitution elasticities between intermediate and final goods using the concordance standards of the Organization for Economic Co-operation and Development (OECD) Inter-Country Input–Output (ICIO) tables, ensuring methodological consistency while enhancing GVC tracking capabilities.
In contrast, TERM is a CGE model focused on China’s economy, capable of simulating domestic market responses and economic changes at the provincial level. It is based on neoclassical economic theory, emphasizing regional economic performance, particularly labor and capital flows. In this study, we optimize the spatial processing and computational efficiency of TERM (Horridge, 2012), enhancing its ability to simulate the specific impacts of the RCEP on China’s provincial economies.1
Linking GTAP and TERMTo provide a comprehensive analysis of the RCEP’s impact on China’s paper industry under industrial restructuring, this study employs a soft-linked GTAP-TERM modeling approach, following the methodology established by Horridge and Zhai (2006). Specifically, the GTAP model simulates global economic and trade changes, while TERM captures domestic market responses. This dual approach facilitates the simultaneous assessment of international trade policies and regional economic adjustments. It ensures model consistency while avoiding the complexities of hard-linking by transmitting GTAP-generated global trade flows and price changes into TERM.2
Key variables such as export elasticity and the substitution elasticity between domestic and imported products are appropriately adjusted to maintain parameter coherence (Horridge & Zhai, 2006). This method enables the study to capture RCEP’s multi-dimensional effects on China’s paper industry, particularly in terms of differential impacts across regions (e.g., coastal vs. inland). Such a comprehensive framework supports targeted policy recommendations for industrial optimization, facilitating a more nuanced understanding of regional industrial adjustments under the RCEP policies.
Data and verificationGTAP databaseSelecting an appropriate multi-regional input-output (MRIO) database is essential to accurately capture cross-country intersectoral interactions. Currently, the primary databases available for analyzing international product-level trade relationships include the Asian Development Bank’s (ADB) MRIO database, the OECD’s ICIO database, and the GTAP’s MRIO database. While both ADB-MRIO and OECD-ICIO offer more recent updates (ADB, 2023; OECD, 2022), they rely heavily on mathematical estimations over official national statistical sources, which may introduce modeling biases and data inconsistencies. In contrast, the GTAP-MRIO database is widely recognized for its superior reliability and credibility, as it directly incorporates official national input-output tables reported by member countries (Aguiar et al., 2023). Consequently, the GTAP-MRIO remains the preferred choice within economic modeling communities for conducting structural economic analyses, as it provides greater realism in capturing trade and production networks.
In this study, we utilize the GTAP-MRIO database, which is based on GTAP version 11A and was developed by Carrico et al. (2020), representing the economic conditions of 2017, the most recent database released by GTAP. A key limitation of earlier GTAP-MRIO databases was their inability to track the specific origins of goods and services, which restricted the analysis of upstream and downstream supply chain linkages. The GTAP-MRIO database resolves this issue by explicitly distinguishing between economic agents—firms, households, governments, and investors—and by tracking bilateral trade flows and tariff structures at a more detailed level. This enhancement facilitates a more precise characterization of GVCs and inter-industry trade dependencies.
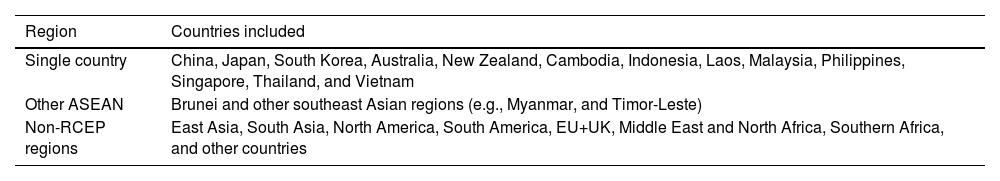
Moreover, our model framework has been adjusted to reflect the structural updates in the GTAP-MRIO database (see ‘Enhancing GTAP and TERM for GVC analysis’ within the ‘Model construction and calibration’ part of this chapter for model modifications). The GTAP-MRIO database used in this study covers 141 countries and regions, disaggregated into 65 industries, as detailed in Tables 1 and 2.
Classification of countries and regions in the GTAP-MRIO simulation.
Note: In the classification of countries and regions, a “single country” refers to an economy that is represented as an individual country or region in the GTAP-MRIO framework.
This study utilizes the TERM database to construct a provincial-level input-output database, which provides a detailed representation of regional industrial linkages. The TERM database follows a bottom-up approach, disaggregating the national input-output table into provincial tables and applying a gravity model to estimate inter-provincial trade flows (Horridge, 2012). Specifically, the 2020 national input-output table, published by the National Bureau of Statistics of China, serves as the benchmark for national industrial interdependencies. Since no official provincial-level input-output tables have been released post 2017, this study uses the 2017 provincial input-output tables to allocate the national-level 2020 data.3 In this approach, we assume that the provincial structure in 2020 remains consistent with that of 2017. Thus, the 2017 provincial data is used solely to determine the provincial shares for disaggregating the 2020 national data, ensuring that the regional distribution aligns with the proportions from 2017. This method maintains the consistency of the regional structure over time while using the 2020 national data as the primary source.
The disaggregation process applies the values from the 2020 national input-output table for production, investment, private consumption, exports, government consumption, inventories, and imports, using the 2017 provincial shares to allocate these values regionally. Discrepancies between the 2017 provincial input-output tables and the 2020 national input-output table—such as differences in classifications for equipment, construction, or civil engineering—are addressed through weighted disaggregation.4 The 2020 national table’s values are used for intermediate inputs, consumption, exports (including inter-provincial transfers), government consumption, inventories, and imports (including inter-provincial inflows). This integration results in a detailed segmentation of industries, particularly the paper industry, both at the national and regional levels, enabling a precise assessment of its geographical distribution within the value chain.
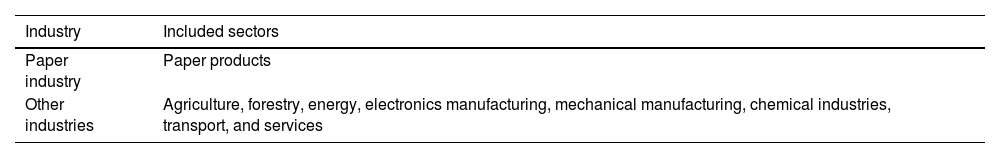
This approach provides a more accurate picture of how these sub-segments interact within both domestic and international markets under the framework of the RCEP by focusing on categories such as waste pulp, wood pulp, and non-wood pulp. Based on the research needs of the paper industry, this study further segments the paper industry within the TERM database. Given that the input-output table includes both the paper industry and the printing industry, this research focuses specifically on “22 - Paper and Paper Products Industry,” as classified under the 2017 National Economic Industry Classification (GB/T4757-2017), while retaining “23 - Printing and Reproduction of Recorded Media Industry” as a separate category. Additionally, to ensure research specificity, the study adapts the segmentation of the paper industry based on data from the China Paper Industry 2020 Annual Report. This approach helps to uncover the detailed performance of the paper industry in domestic and international markets.
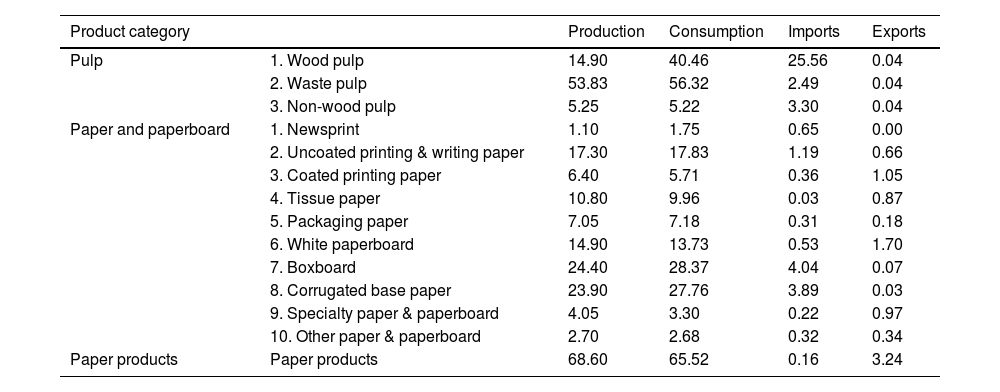
The segmentation of the paper industry in this study follows a similar methodology to the agricultural sector. The classification is based on the production, consumption, export, and import data of the paper industry in 2020 (see Table 3).5 Using this method, the study constructs a 2020 TERM database encompassing 166 industries and 31 provinces. Regional and industrial data were further aggregated into 12 regions and 30 industries to meet research requirements. The specific classifications of countries, products, and industries are detailed in Tables 4 and 5. This segmentation approach not only facilitates insights into the domestic and international performance of various sub markets within the paper industry but also provides refined analytical support for policy formulation.
Production and consumption data of China’s paper industry in 2020 (Unit: million tons).
Source: China Paper Industry Annual Report 2020.
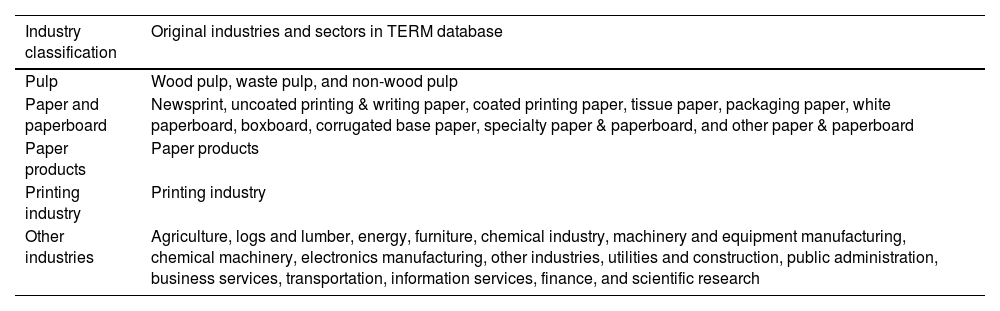
Industry and sector classifications for the paper industry in TERM simulations.
Provincial and regional classifications in TERM simulations.
This study designs a series of simulation scenarios to evaluate the impact of the RCEP on China’s paper industry during its industrial restructuring. These scenarios assess the individual and combined effects of RCEP-driven tariff reductions and trade facilitation measures. Through this approach, the study uncovers the dynamic shifts in domestic production, trade flows, and regional economic structures resulting from the RCEP agreement.
Tariff design for the paper industryThe implementation of the RCEP facilitates mutually beneficial trade within the paper industry among RCEP member countries, laying the foundation for the restructuring of GVCs. Specifically, the RCEP reduces China’s import tariffs on pulp from member countries to zero, while 80% of import tariffs on paper products and printed materials are also eliminated. Among RCEP members, except for Vietnam—where 80 % of tariffs on paper products and printed materials from China are reduced to zero—most other members have reduced their import tariffs on China’s paper products to zero. This tariff reduction significantly promotes the development of trade in the paper industry between China and RCEP member countries (Yu, 2021).
Furthermore, the RCEP marks the first FTAs between China and Japan, as well as the first agreement within a free trade framework between China, South Korea, and Japan. Along with tariff reductions, the agreement advances trade facilitation and investment, accelerating the movement of goods and production factors. This creates opportunities for China’s paper industry to import advanced production equipment from Japan and South Korea and adopt their sophisticated management practices.
The RCEP’s tariff commitment schedule can be categorized into two: unified concessions and country-specific concessions.6 For the simulation of tariff reductions, the study uses the tariff commitment schedules from the RCEP and calculates the final tariff levels once the agreement is fully implemented.7
Although the paper industry generally has lower tariffs than other sectors, tariffs on China’s paper product exports and imports with RCEP countries were relatively high before the RCEP took effect. While China already had FTAs with countries, such as Australia, and ASEAN members, trade in the paper industry was still subject to varying levels of protection. After the RCEP took effect, China’s export and import tariffs on paper products with most RCEP members were significantly reduced (see Table 6). Specifically, two key areas saw reductions: 1) export tariffs on Chinese paper products to Indonesia, the Philippines, Thailand, Vietnam, and other ASEAN countries were lowered; and 2) import tariffs on paper products from Japan, South Korea, Malaysia, Thailand, Singapore, Cambodia, and other ASEAN countries were also reduced substantially.
Tariffs on paper industry imports and exports of RCEP members (Unit: %).
Source: Calculated by the authors based on the GTAP11 Database and the RCEP tariff commitment schedules.
Note: Export tariffs refers to tariffs applied to China’s exports to other countries; Import tariffs refers to tariffs applied to China’s imports from other countries. Major RCEP members, excluding Brunei and Myanmar, are included.
These results highlight the border-opening measures under the RCEP, which reduce tariffs on imports and exports within the paper industry, directly affecting product competitiveness. Given the high price elasticity of substitution in the paper industry, these changes are expected to induce significant shifts in trade structures. While the average tariff levels for the paper industry are lower than those for other industries, the tariff changes create substantial competitive dynamics within the RCEP region. The model shock for tariffs requires converting the tariffs into tax power for application as shocks. The tariffs in this study are adjusted to reflect tax power, as shown in Eq. (1).
Trade facilitation design for the paper industry
The RCEP explicitly outlines measures for domestic opening and improved trade facilitation, which are expected to boost overall trade efficiency. This study quantifies those impacts by focusing on trade facilitation improvements. The key provisions of the RCEP include macro-level institutional frameworks that ensure consistent enforcement, transparency, and efficient coordination. Specific regulatory measures include pre-arrival processing of goods, advance rulings, bonded clearance, and recognition of Authorized Economic Operators (AEO). Additionally, the RCEP emphasizes stronger international cooperation, prioritization of critical areas, and increased use of digital systems to promote electronic processing, all of which drive further improvements in trade facilitation.
Although trade facilitation is widely recognized as a metric for evaluating trade efficiency, there is no universally accepted standard for quantifying it. Here, we use customs clearance time data from the World Bank’s Doing Business 2020 report to describe trade facilitation levels in RCEP countries from a time-cost perspective. However, clearance time alone does not fully capture the industry-specific facilitation levels of specific industries. Compared to other products, the paper industry primarily involves industrial-use papers such as packaging paper, cultural paper, and printed materials, which are more time-sensitive in trade operations.8 Therefore, the paper industry is particularly sensitive to improvements (or delays) in trade facilitation.
This study adopts the method proposed by Yang et al. (2015) to convert trade costs into equivalent ad valorem tariffs. We calculate trade facilitation levels across countries and industries using customs clearance time as the input variable.9
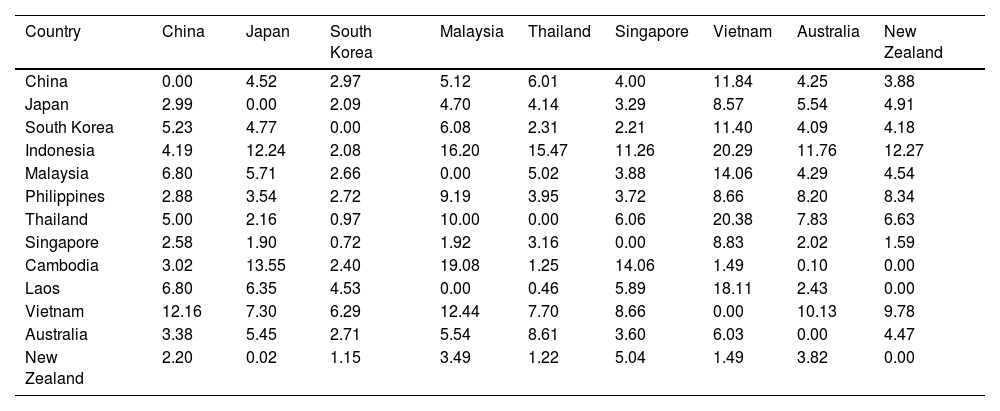
Compared to other RCEP members’ trade facilitation levels, China demonstrates relatively high trade facilitation levels in the paper industry. Most of China’s facilitation levels with RCEP partners are below 7 % (see Table 7). However, China’s trade facilitation with Vietnam is notably lower, with China’s import facilitation at 12.16 % and Vietnam’s at 11.84 %. China and Japan have achieved near-complete trade liberalization in tariffs as well as facilitation. Although South Korea still imposes higher tariffs on global wood processing industries, its paper industry facilitation level generally remains below 3 %. By contrast, many other RCEP members register lower facilitation levels than China. For instance, Malaysia and Indonesia exhibit a trade facilitation level of 16.20 %, indicating considerable room for improvement.
Trade facilitation levels in RCEP members’ paper industries (Unit: %).
Source: Calculated by the authors.
Note: Major RCEP members, excluding Brunei and Myanmar, are included.
To estimate the RCEP’s impact on trade facilitation (amsi,r,s), we follow the methodologies of Sun et al. (2022) and (Li et al., 2023), building on Petri & Plummer (2016). We assume a 50 % reduction in customs clearance times among RCEP members after full implementation.
The methodology consists of the following steps. First, we calculate time-cost equivalent tariffs following Hummels and Schaur (2013). Using GTAP data, we compute daily import/export time costs as ad valorem equivalents (amsrh,export,j, amsrh,import,g) for each country group (j,g) and sector (h). These estimates are cross-aggregated to produce bilateral sector-specific tariff equivalents (amssh,j,g). Second, the equivalent tariffs are weighted by trade volumes. We apply 2020 trade volume weights (Valueh,j,g) to consolidate these bilateral equivalents into country pair (r→s) and sector specific (h) tariff measures (amspi,r,s). Third, world bank clearance time data are processed. We compile annual clearance times (Timej,y,m) for imports and exports by country (j) and year (y), derive bilateral clearance times (Timej,y,m) to match each country pair, and apply the RCEP induced time reduction coefficients (Timer,y,m) to model the expected improvement in clearance times. Finally, the trade facilitation metrics (amsi,r,s) are calculated. We compute amsi,r,s by multiplying the ad valorem tariff equivalent (amspi,r,s), the time reduction coefficient (Timer,y,m), and the percentage reduction in customs clearance time. This captures the combined effect of tariff equivalency, temporal efficiency improvements, and institutional reforms under the RCEP.


For example, since the RCEP took effect in 2022, import clearance times at key Chinese ports—Hainan, Huizhou, and Weihai—have decreased to 37.7, 24.0, and 23.0 hours, respectively. These observed reductions support the validity of our assumed 50% improvement in trade facilitation efficiency. We incorporate these updated clearance times into Eqs. (2)-(6) to estimate the impact of trade facilitation, with the results presented in Table 8.
Trade facilitation data of China’s paper industry under the RCEP (Unit: %).
Source: Compiled by the authors.
To isolate the RCEP’s impact under varying assumptions, we design four scenarios. The baseline scenario assumes no RCEP implementation, with existing tariffs and trade costs remaining unchanged. The tariff reduction scenario incorporates RCEP-based tariff cuts (as detailed in ‘Tariff design for the paper industry’). The trade facilitation scenario adds improvements in trade facilitation measures (as described in ‘Trade facilitation design for the paper industry’). Finally, the combined scenario simultaneously incorporates both tariff reductions and trade facilitation improvements to reflect the full implementation of the RCEP.
These scenarios enable a detailed examination of the RCEP’s incremental effects, aiding in identifying policy priorities and guiding strategic industrial adjustments.
In our model, the tax power results from both tariffs and trade facilitation are introduced as shocks. Specifically, we define two shock parameters: the tariff shock (tmsi,r,s), representing the tariff imposed by importing country s on product i from region r; and the trade facilitation shock (amsi,r,s), which captures reductions in intangible trade costs associated with exporting product i from region r to country s (Yang et al., 2015). To apply these shocks, we use the weighted import price of product i in country s (pimi,s), the total import quantity of product i in country s (qimi,s), and the import quantity of product i from region r to country s (qxsi,r,s). In the model’s equilibrium state, the trade facilitation parameter amsi,r,s is set to zero. By introducing a positive shock to amsi,r,s, we simulate changes in the effective price (pimi,s) of goods exported from region r to country s, where pimi,s replaces the original model price pmsi,r,s. In this way, the model captures how reductions in non‐tariff barriers affect trade flows.


Most scholars concur that although FTAs may induce short-term market disruptions, their long-term effects are generally more favorable and better aligned with underlying economic fundamentals (Zeng & Tan, 2021). In the long run, once an economy reaches a steady state with full employment, total employment remains stable, though real wages may adjust. Capital stock can also shift, even as its rate of return stabilizes.
At the regional level, labor becomes fully mobile across provinces and sectors in response to wage differences, ultimately reaching equilibrium. Similarly, sector-level capital stock adjusts through reallocation and renewal. Consequently, although we simulate the short- and long-term effects of the RCEP, our analysis emphasizes long-term impacts, as this perspective more accurately reflects structural adjustments and evolving economic dynamics following the agreement.
Model calibrationBefore simulating the RCEP’s economic impact on China’s paper industry, we conduct a structural homogeneity test to ensure that GTAP and TERM are properly calibrated. This involves comparing model outputs with observed data to assess the goodness of fit. We consider the calibrated model stable, valid, and capable of producing reliable projections if the simulated results closely match real world economic indicators. Once calibration is confirmed, we proceed with scenario analysis to examine the RCEP’s effects.
The calibration results indicate that TERM’s provincial level projections align closely with the GTAP model’s national level outcomes for China. Both models indicate that tariff reductions and trade facilitation under the RCEP will boost real GDP. Specifically, the GTAP model estimates a 0.37 % increase in real GDP from tariff cuts and a 0.40 % increase from trade facilitation, while TERM predicts corresponding increases of 0.38 % and 0.23 %, respectively. These modest differences fall within an acceptable range, supporting the consistency and validity of both models.
Similarly, both models project substantial increases in trade volumes following the RCEP implementation. According to the GTAP model, tariff reductions will raise export volumes by 4.00 % and import volumes by 4.76 %. Trade facilitation alone boosts exports by 2.34 % and imports by 2.62 %. TERM estimates that tariff cuts will increase exports by 2.40 % and imports by 4.81 %, while trade facilitation will lift exports by 1.39 % and imports by 2.79 %.
Although the exact percentages differ slightly between GTAP and TERM due to their distinct frameworks, both models consistently indicate that tariff cuts and enhanced trade facilitation drive growth in exports and imports. This consensus underscores the positive impact of the RCEP on China’s trade.
The close alignment between TERM and GTAP outputs confirms the stability and reliability of our calibrated models. With this robust foundation, we can confidently explore scenario-based analyses of the RCEP’s impact on China’s paper industry.
The economic impact of the RCEP on China’s paper industryIn earlier chapters, we analyzed China’s paper industry in terms of domestic production layout and international trade dynamics. With the RCEP now in effect, the sector faces new opportunities as well as challenges. This chapter examines the RCEP’s comprehensive impacts, highlighting shifts in industrial structure, regional distribution, and production and trade patterns to reveal its potential contribution to China’s economic development.
Macro impact of the RCEP on China’s paper industryThe RCEP has significantly influenced China’s paper industry by promoting regional production adjustments and expanding trade. By lowering tariffs and enhancing trade facilitation, it has boosted regional trade in the short term and strengthened domestic production capacities over the long term, especially for intermediate goods. In this section, we explore the RCEP’s effects on overall industry scale, regional trade growth, and shifting production patterns.
Short-term vs. long-term effectsIn the short term, lowered trade barriers and improved market access have driven a rapid expansion in regional trade (see Fig. 1). For example, within ASEAN, exports rose by 17.59 % and imports by 10.75 %. However, this trade surge also generated crowding-out effects on local production, with domestic output in selected sectors decreasing by 0.19 %, and intermediate goods production declining by 0.27 %. Similar trends appeared in China and other participating economies, underscoring the initial structural adjustments triggered by the RCEP.
.")
The RCEP strengthens domestic production capacities for intermediate goods in the long term, particularly in countries with competitive paper sectors such as China, Japan, and South Korea. For China, RCEP-driven policies and enhanced trade facilitation have sustained growth in paper output, deepened trade ties with regional partners, and enhanced global competitiveness. Specifically, total paper industry output is projected to increase by 0.33 %, intermediate goods production is expected to grow by 0.41 %, and exports and imports are forecast to rise by approximately 4.4 %. These figures reinforce China’s role in the regional and global paper industry value chains.
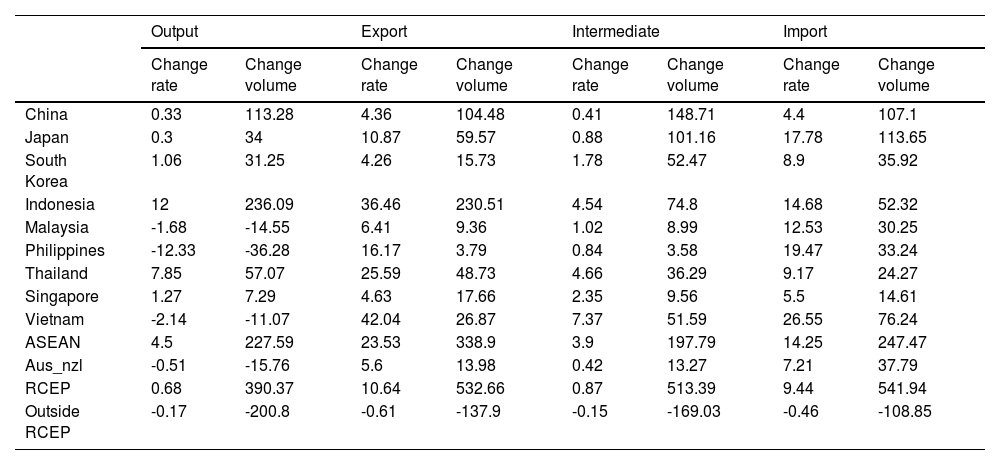
Cross-country and regional variationsThe RCEP’s impacts vary markedly across member countries and regions, reflecting differences in industrial structure, trade dependencies, and production capacities (see Table 9).
Long-term economic impact of the RCEP on the paper industry in major global regions (Unit: % and billion USD).
Notes: “Change Rate (%)” refers to the percentage change relative to baseline conditions. “Change Volume” represents the absolute change in billion USD. “Aus_nzl” denotes the combined region of Australia and New Zealand.
The ASEAN region has emerged as a significant growth driver under the RCEP, showing strong synchronized increases in both exports and domestic production. ASEAN’s exports expanded by USD 338.9 billion, and domestic production increased by USD 197.79 billion, the highest growth rates among RCEP members. Nevertheless, ASEAN continues to rely heavily on imported raw materials, highlighting persistent dependence on external supply chains.
Japan and South Korea, while benefiting from reduced trade costs and improved market access through the RCEP, have seen limited increases in their domestic production capacity. Imports have surged disproportionately relative to local production growth, rising by 17.78 % in Japan and 8.9 % in South Korea, indicating a growing reliance on foreign raw materials and intermediate goods. Rather than spurring large-scale industrial expansion, the RCEP has deepened regional integration through the optimization of resource allocation.
By contrast, China exhibits a more pronounced increase in industrial output, reflecting the success of its regional market expansion and targeted policy support under the RCEP. In the long run, China’s intermediate goods production is projected to rise by USD 148.71 billion, the largest absolute increase among output, exports, and imports. This highlights China’s dual strategy of leveraging the RCEP to enhance trade while strengthening domestic supply chains to reduce external dependencies.
Both Australia and New Zealand also benefit from the RCEP, though their gains manifest at a more modest pace and are primarily trade-driven. Growth in these economies shows a heavier reliance on imports and exports rather than significant expansions in domestic production capacity. This suggests that, although trade liberalization has improved market access, domestic industry adjustments remain gradual, reflecting structural constraints within their paper sectors.
Overall, the RCEP’s most significant impacts are seen in China and ASEAN. The agreement has driven notable trade expansion, especially in Vietnam, where demand for paper products surged. China, Indonesia, and Thailand have also experienced strong growth in domestic production. Planning ahead, China’s paper industry must seize the RCEP’s opportunities to upgrade its industrial structure and deepen regional cooperation, ensuring continued competitiveness in global markets.
Impact on the international trade structureThe RCEP has reshaped the global trade structure of the paper industry, especially within China’s regional networks. It has strengthened the competitiveness of China’s paper products in regional markets by reducing tariffs and enhancing trade facilitation. This section examines the shifts in trade flows between China and RCEP members, and compares these changes with those observed for other major players such as Japan and South Korea, to reveal deeper structural effects.
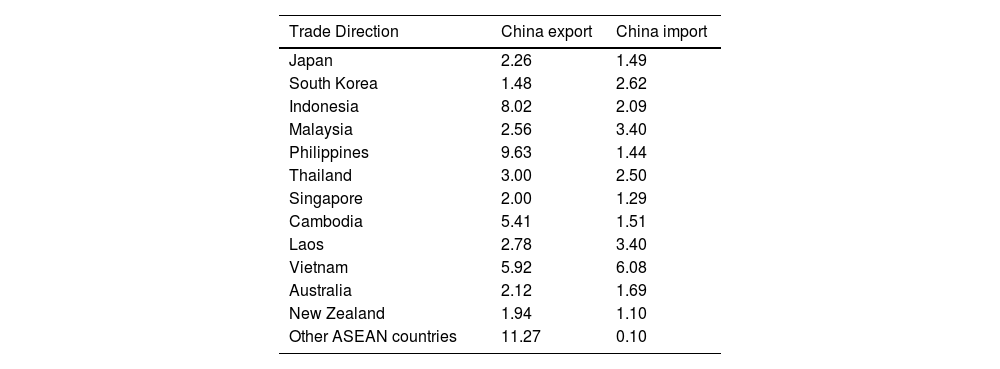
In the long term, the RCEP’s influence on China’s international trade has become increasingly evident, with ASEAN emerging as a key market for Chinese paper exports (see Fig. 2). Export volumes reflect rising regional demand and closer trade ties under the agreement. Specifically, China’s exports to Indonesia, the Philippines, and Vietnam have increased by USD 219.8 million, USD 205.6 million, and USD 198.8 million, respectively. These figures underscore ASEAN’s growing strategic importance in China’s trade strategy for paper products.
.")
Beyond ASEAN, China’s exports to Japan and South Korea have also grown notably over the long term, rising by USD 380.6 million and USD 107.9 million, respectively. This expansion highlights improvements in China’s technological capabilities and product quality, enabling entry into higher-end market segments. Sustained export growth to these advanced economies suggests that China is moving up the regional value chain, supplying not only raw materials but increasingly higher value-added paper products.
Conversely, China’s trade with North America and the EU has continued to contract, although the rate of decline has slowed. This indicates that China’s adaptive trade strategies are successfully offsetting losses in Western markets while consolidating gains within the RCEP. Importantly, this shift extends beyond exports, with imports of paper products from Japan surging by USD 780.4 million. Such an increase reflects deeper regional integration and closer supply chain interdependence. Relying on high-quality Japanese inputs may drive further improvements in China’s domestic manufacturing, reinforcing a mutually beneficial regional trade network.
Overall, the RCEP has steered China’s paper industry toward stronger ties with ASEAN and East Asian partners, while reducing reliance on Western markets. This realignment underscores the agreement’s structural impact and suggests a more interconnected, value chain driven regional landscape.
Impact on the sub-sectors of China’s paper industryThe RCEP implementation has had varied effects across different segments of China’s paper industry, particularly pulp, paper and paperboard, and paper products, each following its own developmental trajectory under the new trade environment.
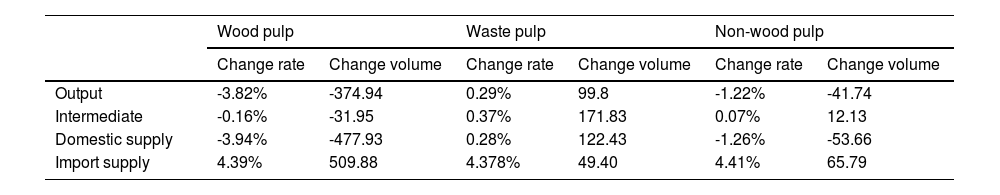
Pulp industryThe RCEP’s effects on China’s pulp sector are substantial. Both wood pulp and non-wood pulp outputs are projected to decline, while import reliance increases (Table 10). Specifically, wood pulp output is expected to fall by 3.82 %, representing a decrease of approximately RMB 374.94 billion. This reflects a shift in domestic demand toward imported intermediate goods, undermining local wood pulp production. Similarly, non-wood pulp output is forecast to decrease by 1.22 %, equivalent to roughly RMB 41.71 billion, primarily due to a reduction in domestic intermediate supply. Downstream paper mills are projected to substitute imported inputs for locally produced non-wood pulp. Despite these output contractions, the rise in imports helps to partially offset the shortfall in domestic supply.
Long-term economic impact of the RCEP on China’s pulp industry (Unit: % and billion RMB)1010 Intermediate refers to intermediate supply, which is divided into two parts based on the source: domestic intermediate supply and import intermediate supply.
In contrast, waste paper pulp is set to grow by 0.29 %, adding about RMB 99.8 billion. Under the TERM framework, China’s domestic waste pulp capacity jumps by roughly RMB 122.43 billion, while imported intermediate supply rises by about USD 49.4 billion. These estimates already account for structural changes stemming from the 2019 waste import ban: by 2020, domestic production provided over 97 % of waste pulp supply, with imports at just 3 %. Although the RCEP accelerates waste pulp import growth, the absolute increase remains limited against this baseline. Meanwhile, a surging demand for cost-effective pulp, especially for packaging and household products, has spurred rapid expansion of domestic waste pulp facilities. Compared to higher-end imported wood pulp, waste pulp enjoys a strong price performance advantage in large-scale, general-purpose production, securing its continued growth and strategic importance in China’s paper manufacturing.
Paper and paperboard industryThe RCEP’s repercussions are also evident in the paper and paperboard segment (see Fig. 3). Certain traditional products—newsprint, boxboard, and corrugated base paper—face headwinds.
.")
Within the paper industry, specific segments, particularly newsprint, boxboard, and corrugated base paper, face significant pressure due to rising imports and shifting production dynamics. Domestic output and development for these categories are demonstrably suppressed as imports steadily increase. In the long run, the RCEP further dampens local output for these products, highlighting China’s increasing reliance on production capacity in Southeast Asia. For instance, intermediate supply for boxboard and corrugated base paper is projected at approximated RMB 62.83 billion and RMB 61.64 billion, respectively, while import demand spikes to RMB 80.37 billion and RMB 77.39 billion. Simultaneously, domestic intermediate demand for boxboard and corrugated base paper is anticipated to falls by roughly RMB 56.95 billion and RMB 55.19 billion, respectively.
Newsprint's decline is a notable trend within this context, largely driven by ongoing digitalization. Demand for newsprint continues its downward trend, with short-term intermediate supply dropping from approximately RMB 3.13 billion to RMB 0.94 billion in the long term. This sustained fall in overall consumption gradually eases import dependence for newsprint, reflecting broader market shifts.
In contrast, several paper and paperboard categories, including coated and uncoated printing and writing paper, white paperboard, packaging paper, tissue paper, specialty paper, and other paperboard products, exhibit resilience or even growth. These products have increased their share of domestic intermediate supply, demonstrating a positive trajectory. For example, uncoated printing & writing paper's intermediate supply reaches roughly RMB 54.44 billion, with imports accounting for approximately RMB 23.63 billion. Similarly, packaging paper's domestically sourced materials predominantly support downstream production, significantly surpassing imported inputs in this segment.
Despite the growth in some downstream sectors, upstream relocation, particularly of boxboard and corrugated base paper manufacturing to foreign markets, has increased reliance on imports for intermediates. This fundamental shift suggests a restructured supply chain where select domestic segments maintain strength, yet critical upstream raw materials continue to depend heavily on foreign sources. Such a restructuring could profoundly affect China's cost structures and competitive positioning within the global paper industry.
Paper products industryUnder the RCEP, China’s paper products industry, which includes finished goods like stationery, sanitary paper, and packaging items, is experiencing robust long-term growth, notably outpacing both the pulp and paperboard sectors (see Table 11). This expansion is characterized by a substantial increase in both the demand for and supply of paper products as intermediate inputs, with domestic production and consumption increasingly driving this sector forward. Conversely, pulp and paperboard suppliers are encountering varied challenges, leading to a reduction in their share of domestic intermediate supply. Overall, pulp output decline under the RCEP at both upstream demand and downstream supply ends, primarily reflecting a substitution by imported intermediates. In stark contrast, domestic paper products achieve significant output and consumption gains, directly fueled by the RCEP’s trade stimulus. Consequently, paper products are playing an ever-growing role in the industry’s value chain.
The long-term economic impact of the RCEP on China’s paper products industry (Unit: % and billion RMB).
Note: Interm supply = Dom supply + Imp supply, Interm demand = Dom demand + Imp demand. "Dom" stands for domestic, and "Imp" stands for import.
In sum, the RCEP is effectively reshaping the supply chain of China’s paper industry. While upstream segments such as pulp and certain categories of paperboard contract, paper product manufacturing expands rapidly. This divergence underscores the RCEP’s mixed but overall stimulative effect, propelling the industry toward higher-value, domestically produced paper goods.
Impact on the domestic regional structureBuilding on our analysis of the RCEP’s effects on trade and industry, this section examines how the agreement has altered production patterns across China’s provinces.
Pulp productionIn the short term, the RCEP’s reduced import restrictions have exerted pressure on China’s domestic wood pulp and non-wood pulp producers, resulting in overall declines in provincial production levels and a significant rise in import dependency (see Fig. 4). By making imported pulp cheaper and more accessible, the RCEP has intensified competition for local producers, many of whom already face high production costs under stringent environmental regulations. Consequently, provinces that historically relied on domestic pulp, such as Heilongjiang and Inner Mongolia, have seen production drop, with mills increasingly turning to imports to meet demand.
.")
By contrast, waste pulp production has surged in certain regions during the short term, notably Guangdong, Jiangsu, and parts of the Northeast (see Fig. 5). This increase is driven by two key factors. First, China is undergoing a steady transition toward recycling. Second, the cost advantages of waste pulp have rendered it more competitive than imported wood pulp. Even in coastal manufacturing hubs such as Guangdong and Jiangsu, where imported wood pulp continues to dominate, waste pulp output has increased as mills increasingly utilize domestic resources to cut costs.
.")
The long-term regional impact of the RCEP on waste pulp, corrugated board, and paperboard production (Unit: billion RMB and %).
Looking to the long term, production capacity within the pulp sector is expected to transition further toward import substitution, particularly for waste pulp. Guangdong and Jiangsu, leveraging their strong industrial bases, will likely continue to increase their waste pulp output. Meanwhile, provinces such as Shandong and Fujian, which previously focused on wood and non-wood pulp, are anticipated to shift more toward waste pulp, steadily growing their capacities to capitalize on domestic feed stock availability.
Newsprint, boxboard, and corrugated base paperThe newsprint sector is contracting, driven by digitalization, which reducing paper demand, and increased competition from imports under the RCEP. Established production centers like Shandong, Guangdong, and Jiangsu have already witnessed significant short-term production declines. Over time, provinces such as Zhejiang, Fujian, and Hubei are also projected to reduce newsprint output, reflecting a nationwide contraction in this segment.
Similarly, boxboard and corrugated base paper face two main challenges, including raw material constraints and the relocation of major producers to Southeast Asia. In the short term, lower import costs have slightly boosted domestic production in provinces, such as Shandong and Zhejiang. However, the long-term outlook suggests that these industries will rely more heavily on foreign inputs, potentially resulting in further industry migration. Regions including Shandong, Fujian, and Zhejiang may struggle with declining competitiveness, whereas Guangdong and Jiangsu, which are home to stronger existing clusters, are better positioned to optimize their layouts under the RCEP.
Other paper and paperboard industriesExcluding newsprint, boxboard, and corrugated base paper, most other paper and paperboard categories (such as coated and uncoated printing and writing paper, white paperboard, packaging paper, tissue paper, and specialty paper) experience a modest decline in domestic intermediate demand in the long term (see Fig. 6). However, as key suppliers of intermediate goods to downstream sectors (e.g., printing), their overall domestic production scales grow significantly. In the short run, Fujian, Zhejiang, Guangdong, and Anhui stand out for their contributions to these segments. In the long run, growth is even more pronounced in Guangdong, Jiangsu, and the North and East China regions, reflecting the persistence of established production clusters.
.")
The long-term regional impact of the RCEP on other paper and paperboard industries, paper products industry (Unit: billion RMB and %).
The RCEP has strongly stimulated the production and demand for paper products (finished goods) across provinces. Although paper and paperboard, paper products, and printing occupy different stages of the value chain, their interdependence has led to regional clustering. Paper products, serving as intermediate inputs for printing, exhibit a regional distribution similar to paper and paperboard production, with concentrations in Guangdong, Jiangsu, Zhejiang, and Anhui.
From a demand perspective, the RCEP has spurred the production of upstream inputs (e.g., pulp) in regions such as Fujian, Hubei, Shandong, and Zhejiang in the short term. However, in the long term, provinces such as Fujian, Hubei, those located in the Yangtze River region, and parts of the Southwest and Northwest, may face capacity challenges. In contrast, established strongholds—Guangdong, Jiangsu, Zhejiang, and Anhui—are expected to strengthen their supply capacities, solidifying their roles as national and regional paper industry hubs under the RCEP.
Conclusions, limitations, and future research agendaKey findingsUsing an enhanced GTAP-TERM framework, this study examined how the RCEP has reshaped China’s paper industry amid broader industrial restructuring. Four primary insights emerged from the analysis.
First, the RCEP strengthens trade relations by deepening China’s ties with regional partners, especially ASEAN, Japan, and South Korea. In the long run, imports of paper industry inputs from Japan rise by roughly USD 780.4 million, signaling tighter regional integration and supply chain inter-connectivity. The RCEP drives regional trade growth and bolsters China’s competitiveness in the global paper market by lowering the barriers for raw material imports and paper‐product exports.
Second, the RCEP highlights shifts in resource utilization. The industry’s reliance on raw materials has shifted noticeably. Imported wood and non‐wood pulp supplies increase by about 4.4 %, while domestic waste‐pulp production expands significantly, adding roughly RMB 122.43 billion in intermediate supply. This shift reflects the RCEP’s economic efficiencies as well as China’s environmental focus on recycling, illustrating how the RCEP supports the internal circulation priorities of the dual circulation strategy by balancing economic and sustainability goals.
Third, the RCEP drives industrial structural adjustments that vary across different segments. Midstream sector, such as newsprint and boxboard, face production declines due to resource constraints and industry migration. Specifically, newsprint domestic supply falls about 2.5 % in the short term, with a further decrease of 1.5 percentage points in the long term. In contrast, downstream sectors such as packaging paper and specialty paper, demonstrate robust growth. For example, the uncoated printing and writing paper segment is projected to expand domestic production by approximately RMB 54.44 billion. These divergent trends underscore the heterogeneous effects along the paper value chain and highlight the need for tailored policies that account for each sub-sector’s unique challenges and opportunities.
Finally, significant and persistent regional disparities characterize the development of China’s paper industry. Coastal provinces such as Guangdong and Jiangsu disproportionately benefit from industrial clustering and technological progress, while many inland regions lag in production upgrades and market integration. Except for resource-intensive segments (wood and non-wood pulp) and globally declining products like newsprint, Guangdong and Jiangsu maintain a clear growth trajectory. This uneven development points to the importance of regionally targeted interventions aimed at reducing disparities and ensuring inclusive industrial growth, in line with the domestic circulation goals of China’s dual circulation strategy.
Policy implicationsDrawing on our quantitative and qualitative analyses of the RCEP’s effects on China’s paper industry, we propose the following policy recommendations to strengthen the sector’s resilience and global competitiveness under the dual circulation paradigm.
To capitalize on the enhanced trade dynamics fostered by the RCEP, China's paper industry must strategically optimize its trade integration and promote regional specialization. The RCEP has deepened China’s trade ties, particularly with ASEAN, Japan, and South Korea, leading to higher imports from Japan and expanded export opportunities. Coastal provinces such as Guangdong and Jiangsu, which benefit from existing industrial clusters and advanced technologies, should focus on enhancing their export capabilities. Specifically, they should upgrade high-value-added production of specialty and packaging papers to meet evolving regional demand, and invest strategically in automation and digitalization to boost manufacturing efficiency and maintain a competitive edge in these export-oriented segments. By aligning production upgrades with regional demand patterns, these provinces can capitalize on RCEP-driven trade dynamics and reinforce China’s export performance in premium paper products.
Promoting sustainable resource utilization and facilitating a transition towards a circular economy are crucial for the paper industry's long-term resilience, particularly by leveraging waste pulp. Our findings reveal a shift toward increased reliance on waste pulp, aided by environmental policies and national recycling priorities. This trend presents a significant opportunity for inland provinces that currently lag in technology adoption. For example, Henan, rich in agricultural byproducts, could expand its waste pulp recycling industry by promoting advanced recycling techniques such as enzymatic digestion or other innovative processes through pilot programs. Additionally, investing in green technologies for energy-efficient pulp production would align with national circular economy goals and further support sustainable development in the region. To support these efforts, policymakers should offer targeted incentives, including tax breaks and subsidies, designed to attract private investment in recycling facilities. Additionally, they should implement a tiered subsidy program that differentiates support for large firms and small and medium-sized enterprises (SMEs). Large enterprises, which can achieve economies of scale, should receive incentives to pioneer cutting-edge recycling technologies and build large-scale plants. SMEs, which often face resource constraints, should receive subsidies for technology adoption, workforce training, and access to shared infrastructure. Tailoring support in this way ensures that both large and small players can participate in and benefit from the circular economy transition.
Given the varied impacts of the RCEP across different paper industry segments, a policy approach of differentiated industrial adjustments and tailored regional development strategies is essential. The RCEP’s effects vary significantly across segments: midstream sectors such as newsprint are contracting, while downstream segments like packaging and specialty paper are expanding. Therefore, policymakers must adopt region- and sector-specific roadmaps. For coastal regions such as Guangdong and Jiangsu, the focus should be on capitalizing on the rising demand for packaging and specialty paper by promoting midstream innovation and expanding capacity in these growth areas. For declining sectors such as newsprint in Hebei and Shandong, the strategy should involve encouraging industrial diversification by supporting emerging growth segments, such as recycled paper or niche specialty papers, and provide targeted assistance for technological upgrades to facilitate the transition. Regions can mitigate sectoral declines and harness the RCEP’s growth opportunities by aligning industrial policy with local strengths and market demand.
To build a stronger and more resilient paper industry supply chain, it is critical to enhance inter-regional coordination and leverage RCEP partnerships for global collaboration. Significant regional disparities persist, with coastal provinces benefiting from advanced technology and market integration, while inland areas continue to face challenges in production upgrades and market access. To build a stronger, more resilient supply chain, policymakers should prioritize improving inter-regional coordination for critical raw materials, such as wood pulp and waste paper pulp, by establishing streamlined logistics and trade linkages between inland provinces (e.g., Henan and Hunan) and coastal hubs. Additionally, leveraging RCEP partnerships as destinations for outbound investments can help diversify the supply base and reduce risks associated with potential disruptions. Encouraging international collaboration and negotiating complementary agreements under the RCEP will help stabilize material flows and continuously strengthen the competitiveness of China’s paper industry on the global stage.
CRediT authorship contribution statementHuijuan Li: Software, Methodology, Data curation, Conceptualization. Shuni Xu: Writing – review & editing, Writing – original draft, Software, Investigation, Formal analysis. Yawen Liu: Writing – review & editing, Writing – original draft, Formal analysis, Data curation, Conceptualization. Dan Wang: Visualization, Formal analysis. Jun Yang: Project administration, Methodology, Funding acquisition.
Yawen Liu was supported by the China Postdoctoral Science Foundation (2023M730590), the Fundamental Research Fund for the Central Universities in UIBE (22QD30) and National Natural Science Foundation Emergency Management Project (72441002).
Intermediate refers to intermediate supply, which is divided into two parts based on the source: domestic intermediate supply and import intermediate supply.
Notably, the margin component in the TERM occupies the largest spatial share. TERM2 modifies this indicator by aggregating the original four-dimensional SUPPMAR into a three-dimensional MARSUPP, reducing the database size by a factor of 15 and achieving computational speeds 45 times faster than the traditional TERM.
In practical simulations, there are two primary methods for linking the standard GTAP model with the TERM: hard linking and soft linking. Given the high complexity and potential suboptimal results of the hard-linking approach, this study opts for the soft-linking method, as proposed by Horridge and Zhai (2006), to link the standard GTAP and TERM.
The provincial input-output tables are provided by the TEDA Forecast, with data sourced from http://www.taidayuce.com/#/literature.
During the construction of the TERM database, the disaggregation of matrices for production, investment, private consumption, exports, government consumption, inventories, and imports is conducted uniformly using the corresponding intermediate inputs, consumption, exports (including inter-provincial transfers), government consumption, inventories, and imports (including inter-provincial inflows) from the 2017 provincial input-output tables. For discrepancies between the 2017 provincial input-output tables and the 2020 national input-output tables, such as: (1) equipment like special-purpose machinery, ovens, fans, packaging machinery, and medical instruments in 2020 corresponding to “other special-purpose equipment” in 2017; (2) residential buildings, sports facilities, and other building construction in 2020 corresponding to “building construction” in 2017; and (3) railroads, roads, tunnels, bridges, and other civil engineering projects in 2020 corresponding to “civil engineering construction” in 2017. The 2020 national table’s values for intermediate inputs, consumption, exports (including inter-provincial transfers), government consumption, inventories, and imports (including inter-provincial inflows) are used for weighted disaggregation.
Given that China’s national input-output table utilizes the 2020 data set, the segmentation of the paper industry was also based on production, consumption, and other relevant data from 2020 to ensure consistency. Moreover, data on China’s paper industry, as published by the China Paper Industry Association, has not been updated since 2021. Considering data availability, this study employs the most recent data released in the 2020 annual report.
Under the RCEP, the tariff commitments can be categorized into two main categories: uniform concessions, and country-specific concessions. The uniform concessions category includes eight parties—Australia, New Zealand, Malaysia, Singapore, Brunei, Cambodia, Laos, and Myanmar. For these members, goods originating from RCEP countries are subject to the same tariff rates upon importation. The country-specific concessions category includes countries like South Korea, Japan, Indonesia, Vietnam, the Philippines, Thailand, and China. For these members, tariff rates on goods originating from RCEP countries may differ depending on the exporting member country.
This study organizes China’s tariff commitment schedule under the RCEP and aligns it with the GTAP model’s sector classifications to examine the tariff reductions between China and RCEP countries. Within the RCEP tariff commitment schedule, Japan, Australia, New Zealand, Brunei, Cambodia, Laos, Myanmar, Singapore, Thailand, and Malaysia have consistent commitments across all RCEP countries. In contrast, China, South Korea, Indonesia, the Philippines, and Vietnam have country-specific commitments that vary depending on the exporting member country.
In addition to ad valorem tariffs, the tariff schedules include specific tariffs. For the calculation of ad valorem tariffs, this study directly uses arithmetic averages to convert HS8 codes to HS6 codes. Specific tariffs are converted to ad valorem equivalents based on 2018 trade values. These weighted results are subsequently compared with the existing bilateral tariff levels to determine the shocks applied in the model. For non-RCEP countries and regions, the original tariff levels are retained. The study aligns China’s tariff commitments under the RCEP with GTAP industries, organizing the data to calculate the tariff reductions across different sectors.
articles