


This study employs the panel smooth threshold autoregression model to data spanning 27 European Union (EU) member states from 2000 to 2022 to investigate the nonlinear relationships between green growth and green technological innovation. This approach enables our examination of the dynamics of economies’ rise from weakness to strength. This investigation introduces a comprehensive framework that combines green technological innovation, renewable energy sources, and the circular economy into a single green growth model. The results confirm two optimal thresholds that impact how green technological innovation affects green growth, distinguishing between the three regimes. Additionally, the results demonstrate the positive influence of green technological innovation on green growth. In contrast, the study reveals a weaker effect with increasing levels of green technological innovation transitions from intermediate (Regime 2) to high (Regime 3) green growth. Furthermore, insufficient green technological innovation has not developed effective renewable energy technologies that can foster green growth. Conversely, renewable energy begins to positively affect green growth when EU countries increase green technological innovation investment. Finally, a robust regime of green technological innovation facilitates circularity and promotes EU economies’ green growth, indicating that the influence of the circular economy on green growth depends on increased green technological innovation. Practically, policymakers in EU economies should focus on sustainable innovation to promote green growth and advance the United Nations Sustainable Development Goals.
Increased climate change awareness has increased the focus on transitioning toward a green economy (Ali et al., 2021) that features low carbon emissions, efficient resource use, and social inclusiveness. A green economy is intended to protect human health by developing cleaner, more cost-effective, and environmentally friendly technologies and maintaining ecological standards that are a global concern. Green technological innovation contributes to addressing these standards. While most nations, including those in the European Union (EU), are committed to fighting climate change, the zero carbon era remains elusive (Ahmad & Wu, 2022).
In line with their commitments to environmental preservation, countries have implemented measures to reduce carbon emissions and achieve green growth. This has caused a notable increase in the number of green technological innovations in the past few decades (Su & Moaniba, 2017). The ongoing discourse surrounding potential green pathways for economic advancement has prompted numerous economists to focus on green technological innovation as a strategy for environmental stewardship. The concept of green technological innovation emphasizes the orientation of innovation to preserve the environment, in contrast to Schumpeter’s definition, which considers innovation to be a general process that encompasses any form of modification that disrupts or improves economic systems without any particular distinction concerning its aims or impacts (Sica, 2016).
Green technological innovation and growth are the primary drivers of the global green transition. This shift is an aspect of the economic dynamics elucidated by Austrian economist Schumpeter, who delineated the fundamental economic drivers that characterize the change process as “creative destruction” (Schumpeter, 1942). Although previous economic literature has recognized the importance of green technological innovation for environmental protection, the term green technology remains vague and ambiguous. The literature has not provided a clear and distinct definition of green innovation, referring to it by different names such as sustainable innovation (Fernandes et al., 2021), environmental innovation (Luan et al., 2024), green technological innovation (Li et al., 2022), and cleaner innovations (Deng et al., 2024).
Similarly, the concept of green growth lacks a clear, universal definition. The concept of a green economy with sustainable economic growth emerged as a central theme in the final United Nations document at the Rio Conference on Sustainable Development in 2012 (Hickel & Kallis, 2020). In theory, green growth refers to a form of economic growth that endeavors to strike a balance between natural resource use and economic expansion and promotes social equity and environmental protection. Consequently, when mapping out a path toward green growth, it is essential to recognize the pivotal influence of renewable energy, nonrenewable energy, and green technological innovation. A review of the literature on green growth reveals a consensus among scientists regarding its ability to preserve the environment while achieving economic benefits. Researchers have focused on defining, measuring, and examining the relationship of economic growth with the environment and determining how green technological innovation reduces carbon emissions to define green growth (Belmonte-Ureña et al., 2021).
Green technological innovation is a fundamental element of ecoinnovation and a promising approach for facilitating sustainable development. This process is characterized by the coexistence of green and innovative attributes that contribute to promoting a more sustainable future (Chen et al., 2023). Indeed, green technological innovation contributes to environmental quality and can be employed for effective climate action (Caglar et al., 2024). Moreover, according to Sharif et al. (2020), green innovation reduces equipment loss, production costs, and fuel waste, improving production efficiency and enhancing green growthCliquez ou appuyez ici pour entrer du texte.. The deployment of green technological innovation benefits the progression of recycling initiatives and the repurposing of production residuals (Zhao et al., 2021) while also stimulating the advanced development of renewable energy (Esmaeilpour Moghadam & Karami, 2024). Green technological innovation expedites the transition to circularity, minimizing economic harm and disparity while also safeguarding the environment (Suchek et al., 2021; Chauhan et al., 2022; Khan & Khurshid, 2022; Sánchez-García et al., 2024).
Although the relationship between green technological innovation and green growth has been extensively examined, some concerns remain unsettled. Previous research on this topic has revealed that there is still much to be understood about the nuances of this relationship with a tendency to adopt linear frameworks for analysis (Chen & Lee, 2020; Meirun et al., 2021). Nevertheless, a paucity of literature examining this relationship from a nonlinear perspective remains (Li et al., 2021; Zhang, 2021; Liu et al., 2022; Zeng et al., 2022; Zhang et al., 2023).
Complementing previous research, we employ the panel smooth threshold autoregression (PSTAR) model to panel data spanning 27 EU member states from 2000 to 2022 to investigate the nonlinear relationship between green growth and green technological innovation. This approach was motivated the understanding that the EU has set the goal of spearheading the global transition toward a green economy. Given the challenges already outlined, the EU has established the goal of halving greenhouse gas (GHG) emissions by 2030 (Cifuentes-Faura, 2022; Presno et al., 2021). In addition, the 2019 Green Deal for Europe, assessing the impact of climate legislation, introduced new legislation to advance the circular economy and green innovation. Furthermore, the European Commission’s initiative for Horizon Europe, the EU Framework Program for Research and Innovation (R&I) 2021–2027, also highlights this ambition (Kastrinos & Weber, 2020). At the same time, technological innovations have enabled EU countries to join the ranks of other nations pursuing green growth (Nosheen et al., 2021). The selection of EU countries for this study is judicious, given their commitment to advancing green growth through green technological innovation, enabling our examination of the nonlinear relationship between green technological innovation and green growth. Furthermore, this study employs a comprehensive framework that unifies green technological innovation, renewable energies, and the circular economy into a single green growth model.
This study contributes to the existing body of literature in several ways. First, previous studies have primarily concentrated on how green technology impacts innovation and economic growth (Meirun et al., 2021). These studies have argued that green technological innovation is pivotal for enhancing environmental quality by improving resource efficiency and lowering carbon emissions (Sohag et al., 2015). However, limited research has explored the impact of green technological innovation on green growth (Saqib et al., 2024). Second, the majority of studies in this field have not considered the nonlinear trajectory of this relationship (Wang, 2023). Third, while a review of extant literature reveals that green technological innovation, renewable energy, and the circular production systems often influence environmentally responsible growth, to the best of our knowledge, no study has considered them in a unified framework. This study examines these factors to address this gap, assuming a nonlinear relationship between green technological innovation and environmentally responsible growth, making a noteworthy contribution by employing an econometric approach that incorporates threshold effects. For this purpose, the PSTAR model analyzes whether the nonlinear impact on green growth has an identifiable threshold effect that heterogeneously influences the impact of renewable energy and circularity on green growth at varying levels of green technological innovation. The findings can enable EU policymakers to understand the significance of the effect of green technological innovation on green growth and the relationship between this growth, renewable energy, and the circular economy. A more profound understanding can enable them to develop and implement effective strategies.
The remainder of this study is organized in the following manner. Section 2 presents a literature review and subsequent research hypotheses. Section 3 details our empirical model and data. Section 4 conducts the PSTAR test. Section 5 discusses the main results of the PSTAR test estimation. Finally, Section 6 draws conclusions and outlines related policy recommendations.
Literature reviewImpact of green technological innovation on green growthThe pivotal influence of technological innovation on enhancing environmentally responsible growth has been widely acknowledged. However, the increased urgency of environmental concerns and advancing climate change has prompted researchers to prioritize investigating the interconnections between sustainable innovation and sustainable growth. New endogenous growth models integrating environmental factors and innovation (Acemoglu et al., 2016) have inspired several applied studies examining these interconnections (Mathews, 2020; Nosheen et al., 2021; Li et al., 2022; Wei et al., 2023) and emphasized the crucial influence of technological innovation on improving environmental quality by optimizing energy use and reducing carbon emissions to facilitate green growth.
In a recent study, the autoregressive distributed lag (ARDL) technique employed by Meirun et al. (2021) examined the relationship between the variables under consideration for Singapore from 1990 to 2018, revealing that sustainable technological innovation positively affects green growth and reduces long- and short-term carbon emissions. A recent study by Khan et al. (2023) on 26 EU countries between 2000 and 2020 demonstrated that green technological innovation advances green growth. In addition, the researchers postulated that reduced carbon emissions compensate for the favorable influence of conventional growth on these emissions. The same findings were reported in studies of other countries (Chen & Lee, 2020; Li et al., 2022; Sun et al., 2023). Echoing these observations, a recent study by Saqib et al. (2024) on the impact of green technological innovation on green growth in leading countries with the most significant ecological implications from 1990 to 2019 confirmed the positive effect. Furthermore, the results indicated improvement in environmental quality related to green technological innovation and green growth.
In a similar vein, Fernandes et al. (2021) examined the impact of sustainable technology transfer and sustainable innovation on green growth in 32 member countries of the Organisation for Economic Co-operation and Development (OECD) between 1990 and 2013. The use of two-stage generalized method of moments (GMM) estimators, comprising one model to represent the lag on the dependent variable and another for the two green innovation variables of sustainable technology transfer and sustainable patents demonstrated that these variables favor green growth. The results confirmed that a transition toward innovation is compatible with countries’ green growth aspirations.
In contrast, Nosheen et al. (2021) showed that the effect of green technological innovation in the EU is conditioned by the specific innovation characteristics examined. The authors’ investigation of the effect of various sustainable technological innovations on environmentally responsible growth in 27 EU economies between 2000 and 2017 revealed that energy-related green technological innovation has a positive effect, and green technologies related to transportation and production have a negative impact. These adverse effects were further corroborated by the findings of several other studies (Wang et al., 2014; Zhao et al., 2017; Mensah et al., 2018).
Framework and research hypothesesAn investigation of previous research reveals that green technological innovation and ecofriendly growth are the primary drivers of the global ecological transition (Esmaeilpour Moghadam & Karami, 2024). Moreover, while the majority of the extant literature on the subject has employed linear frameworks to examine the nexus between green innovation and green growth (Meirun et al., 2021), few studies have explored this relationship using a nonlinear framework (Liu et al., 2022; Zhang et al., 2023; Wang, 2023; Luan et al., 2024).
For example, Zeng et al. (2022) employed threshold panel models to explore this relationship in 30 Chinese provinces between 2001 and 2019, revealing the nonlinear effect of green technological innovation that depends on regional development wherein, as economic development rises, the positive innovation effect on green growth decreases. the authors employed an improved nonlinear random regression Stochastic Impacts by Regression on Population, Affluence, and Technology (STIRPAT) model, demonstrating that technology patents are correlated with the reduction of carbon emissions, contributing to green growth. Using a threshold panel model, Liu et al. (2022) showed that the relationship exhibits structural breaks when the selected threshold variables are in disparate regimes. The authors argued that increased knowledge stock, financial development, and human capital will have a more significant effect on green technological innovation. However, they stressed the necessity of implementing rigorous and appropriate environmental regulations to promote the impact of innovation on green growth. A subsequent analysis by Luan et al. (2024) employed the nonlinear ARDL model to examine the nonlinearity of this relationship in developing countries from 1995 to 2019. The results revealed that only positive shocks in green innovation facilitate environmental sustainability and consequent long-term green growth.
The nonlinear relationship occurs in two distinct phases. The initial phase of economic development frequently incurs high investment, heavy pollution, and low efficiency (Li et al., 2022; Mensah et al., 2018). Increased financial support for green technological innovation in urban areas can advance the decoupling of economic growth from environmental progress, which can increase energy consumption, worsen air pollution, and damage environmental quality (Rezende et al., 2019; Saliba de Oliveira et al., 2018). The second phase features a significant integration of green technological innovations, with a focus on environmentally friendly products, optimized manufacturing processes, and enhanced energy efficiency (Sohag et al., 2015). This transition significantly reduces atmospheric pollutant emissions and improves environmental quality (Zhang et al., 2023), fostering green growth.
Accordingly, we propose hypothesis H01 as follows:
H01 The relationship between green technological innovation and green growth is nonlinear.
Despite a considerable body of literature examining the impact of green technological innovation on GHG emissions and subsequent effects on green growth, previous research has not provided sufficient evidence to reach a definitive conclusion (Meirun et al., 2021). Some studies have yielded positive findings (e.g., Fernandes et al., 2021; Meirun et al., 2021; Khan et al., 2023), whereas others have demonstrated adverse effects (e.g., Mensah et al., 2018; Chen & Lee, 2020; Nosheen et al., 2021), and a mixed picture has emerged from others (Suki et al., 2022; Su et al., 2023). The need for further research into how green technological innovation impacts other factors that influence green growth is apparent, particularly renewable energy and the circular economy.
A substantial corpus of studies has demonstrated the pivotal role of renewable energies in facilitating green growth (Aneja et al., 2024). Green energies have significantly reduced environmental impact (Jahanger et al., 2022), require less dependence on nonrenewable energy imports (Khan et al., 2023), and decreased the use of nonrenewable energy sources (Chen & Lei, 2018). Furthermore, promoting green growth enables the transition to efficient, high-performance renewable energies based on sustainable technological innovations (Khan et al., 2022). Saqib et al. (2024) found that advancements in these innovations and adopting renewable energy sources have a combined effect that positively impacts long-term green growth. Moreover, employing the panel causality approach, the authors demonstrated a bidirectional causal association between green technological innovation, renewable energy, green growth, and the ecological footprint. This assertion is supported by research conducted by Saqib and Usman (2023).
The relationship between sustainable technological innovation, renewable energies, and environmentally responsible growth has been the subject of several recent studies (Aydin & Degirmenci, 2024; Esmaeilpour Moghadam & Karami, 2024; Li et al., 2022; Sohag et al., 2021). For example, Esmaeilpour Moghadam and Karami (2024) found a positive interaction between sustainable innovation and renewable energies, highlighting the importance of green technological innovation in promoting renewable energies. In other words, advanced green technological progress can increase the adoption of renewable energy sources and stimulate green economic growth. Similarly, Sohag et al. (2021) investigated the impact of renewable energy on environmentally responsible growth in 21 OECD nations, revealing a positive correlation between renewable energy development, green technological innovation, and long-term green growth. From this perspective, as Li et al. (2022) noted, green technological innovation is an essential mediator between renewable energies and green growth. Accordingly, we propose hypothesis H02 as follows:
H02 Green technological innovation influences the effect of renewable energy on green growth.
In addition to the significant influence of clean energies in green growth, optimizing resource utilization is also pivotal for improving the equilibrium between the economy, the environment, and society, resulting in the concept of a circular economy (Marjamaa & Mäkelä, 2022), which is considered one of the pathways for advancing the transition to green growth (Figge et al., 2023). The circular economy can be defined as a resource utilization system that eliminates virgin resources, allowing for closed resource loops. Promoting ecological equilibrium is facilitated by developing innovative solutions, as evidenced by Bianchi and Cordella (2023). Furthermore, integrating the circular economy with multiple sustainability objectives advances the achievement of the United Nations 2030 Sustainable Development Goals (SDGs), as highlighted by Garcia-Saravia Ortiz-de-Montellano et al. (2023). Applying a similar focus, De Pascale et al. (2023) analyzed the implementation of circular practices in the EU from 2015 to April 2023, revealing that the transition to an alternative circular paradigm increases sustainable growth in the EU.
The circular economy transition is accelerated by green technological innovation, which contributes to reducing environmental damage and consequently promotes green growth (Suchek et al., 2021; Chauhan et al., 2022; Khan & Khurshid, 2022; Sánchez-García et al., 2024). Sánchez-García et al. (2024) highlighted the transformative influence of green technological innovation on advancing circularity. Our extensive survey of recent literature reveals that these technologies accelerate the transition to increased circularity and sustainability. Improved resource efficiency, optimized supply chains, and improved product lifecycle management result from green innovation facilitated by these new technologies.
In this regard, Cliquez ou appuyez ici pour entrer du texte.examining 27 EU countries from 2010 to 2017, Busu and Trica (2019) revealed a positive relationship between green technological innovation, the circular economy, and economic green growth. Using a multiple regression model and several circular economy indicators, the study revealed the crucial function of green innovation in the effect of the circular economy on the environmentally responsible growth in EU countries. Furthermore, Triguero et al. (2022) analyzed the elements that influence the implementation of green innovations in favor of a circular economy in the EU and showed that financial and technological capacities are decisive for advancing EU economies’ circularity. The findings confirmed the significance of green technological innovation in pursuing circularity and consequent promotion of green growth in EU nations.. Accordingly, we propose hypothesis H03 as follows:
H03 Green technological innovation influences the impact of the circular economy on green growth.
In summary, our review of the extant research indicates a tendency to consider green technological innovation, renewable energies, and circularity as factors impacting green growth independent of one another, assuming a linear relationship. Therefore, we propose addressing this gap by combining these factors within a unified framework in a nonlinear relationship, as per the approach of some previous studies (Li et al., 2021; Zhang et al., 2023). Consequently, we employ the PSTAR model to investigate cross-sectional heterogeneity, enabling smooth transition analysis.
MethodologyWe investigate the effect of sustainable technological innovation, renewable energy, and circularity on ecofriendly growth and test our research hypotheses. The panel data model is thus formulated building upon the specifications of Cárdenas Rodríguez et al. (2018) and Fernandes et al. (2021) as follows:
where EAMFP represents country i’s environmentally adjusted multifactor productivity in period t; independent variables are denoted by PERT, ICGTD, REC, GVACE, INFL, and ICTET; λi represents country fixed effect (FE), μt represents time FE, and εit is a random error term. Table 1 provides a summary of all variables.
Variable definitions.
| Variables | Nature | Proxy | Definition | References | Source |
|---|---|---|---|---|---|
| EAMFP | Endogenous | Green growth | Environmentally adjusted multifactor productivity. | Albrizio et al. (2017); Hao et al. (2021); Herman et al. (2023); Liu et al. (2022) | OECD |
| PERT | Exogenous andthreshold | Green technological innovation | Ratio of environmentally-related technology patents to total patents. | Bekhet & Latif (2018); Du et al. (2021); Esmaeilpour Moghadam & Karami (2024); Fernandes et al. (2021); Mensah et al. (2018); Yu et al. (2021) | OECD |
| REC | Exogenous | Renewable energy | Share of renewable energy in total final energy consumption. | Jahanger et al. (2022); Khan et al. (2022); Khan et al. (2023) | World Bank World Development Indicators (WDI) |
| ICGTD | Exogenous | Sustainable technology transfer | International collaboration in global technology development. | Aghabalayev & Ahmad (2022); Fernandes et al. (2021) | OECD |
| GVACE | Exogenous | Circular economy | Gross value added in the circular economy, expressed as a proportion of GDP. | Chauhan et al. (2022); Khan & Khurshid (2022); Sánchez-García et al. (2024); Suchek et al. (2021); Vranjanac et al. (2023) | Eurostat |
| INFL | Control | Inflation | Rate of inflation as a proportion of the consumer price index. | Chen et al. (2022) | WDI |
| ICTET | Control | Digitalization | Ratio of information and communication technology (ICT) exports to ICT imports. | Bilal et al. (2022); Cao et al. (2021) | WDI |
Referencing Bouattour et al. (2024) and Kalai et al. (2024), the PSTAR model incorporates a continuous transition function, as suggested by Gonzalez et al. (2005) and Gonzalez et al. (2017). Furthermore, it accommodates cross-sectional variability, making it an attractive application for multisection panel data research, resulting in the following formulation of a PSTAR model with two regimes:
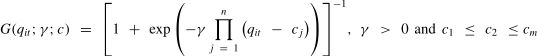
where Xit=(Xit1,…,Xitk) denotes a matrix comprising k exogenous variables that lack any lagged explanatory variables and β=(β1,…,βk) is the vector of their coefficients. μi represents the vector of individual FEs, and ρj indicates the autoregressive coefficients of process yit. G(qit;γ;c) denotes the transition function associated with transition variable qit, the threshold parameter c, and a smoothing coefficient γ. The error term is εit∼ℵ(0,σ2). In PSTAR modeling, a continuous transition function modifies transition function G(qit;γ;c), which spans the interval [0, 1]. Gonzalez et al. (2005) recommended a logistic transition function that has an order designated as m as follows:c=(c1,…,cm)′ represents an m-dimensional vector of location parameters. We use the slope parameter γ to determine the regularity of the transitions. The criteria γ>0 and c1≤c2≤…≤cm are strictly enforced in this identification process. Since these numbers can explain commonly noted parameter fluctuations, m = 1 or m = 2 is usually adequate to consider in real-world applications. Gonzalez et al. (2017) proposed a first-order Taylor expansion as a substitute for G(qit;γ;c). We construct the following supplemental regression using this method after reparameterization:where β1′* is directly related to the slope coefficient γ and is computed using εit*=εit+R1β1′*Xit, where R1 represents the remainder of the Taylor expansion. It is essential to evaluate linearity before estimating the PSTAR model as this assessment influences the statistical significance of the impact of regime change. Testing H0:γ=0 is similar to testing the null hypothesis H0*:β2′*=0. Wald (LM), Fisher (LR), and likelihood ratio (LMF) tests can be used for this purpose. The appropriate statistics for these tests are as follows:where RSS0 denotes the panel residual sum of the squares of a linear panel model incorporating individual effects, and RSS1 represents the residual sum of squares of a nonlinear panel model characterized by two regimes. Under the null hypothesis, the Wald (LMw) and likelihood ratio (LR) statistics follow a chi-squared distribution with K degrees of freedom, where K is the number of explanatory variables, and Fisher Lagrange multiplier (LMF) statistics adhere to a chi-squared distribution with two degrees of freedom.


Moreover, the PSTAR specification establishes the fundamental model outlined under these conditions, presupposing two distinct regimes (ℎ = 1 and ℎ = 2) as follows:
where ρ1j1 and ρ1j2 are the coefficients of the lagged environmentally adjusted multifactor productivity (EAMFPit−j) at each regime, h=1or h=2.Results
This section presents the descriptive analysis; unit root, cointegration, independence tests; PSTAR estimation; and the causality test on panel data.
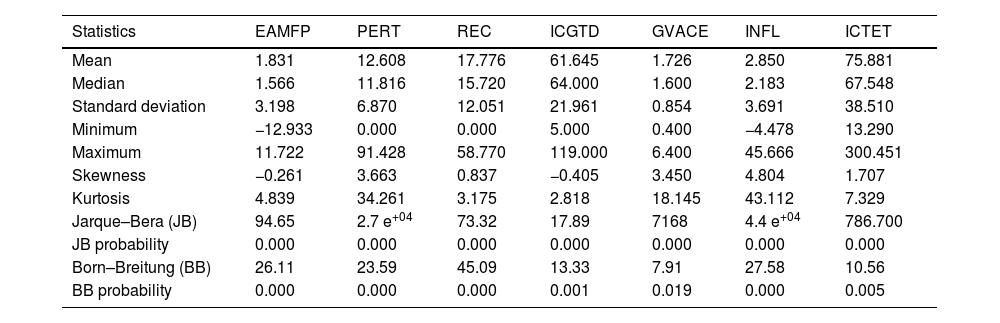
Descriptive statisticsAs illustrated in Table 2, the EAMFP variable derived from 621 observations has a mean value of 1.831 and a corresponding standard deviation of 3.198. The series also exhibits a leptokurtic distribution, with a skewness of −0.261 < 0 and a kurtosis of 4.839 > 3. All values fall within the range of −12.933–11.722, and the concentration is 1.566. As noted previously and substantiated by the Jarque and Bera (1987) test conducted on the entire sample, the series does not adhere to a normal distribution. Furthermore, the series exhibits a lack of autocorrelation at the 1% level, as evidenced by the Born and Breitung (2016) test.
Descriptive statistics.
The mean for the PERT variable is 12.608 with a standard deviation of 6.870. The concentration of the distribution is 11.816, with a range of values from 0 to 91.428. This series exhibits a right-asymmetric distribution, as indicated by the skewness value of 3.663, which is greater than 0. Additionally, the kurtosis value of 34.261 reveals that the distribution is predominantly leptokurtic. The results of Born and Breitung’s autocorrelation test (2016) and Jarque and Bera’s normality test (1987) indicate a probability of under 1%.
The ICGTD variable has a mean of 61.645 and a standard deviation of 21.961 with values ranging from 5 to 119 and a concentration of 64. Furthermore, this series exhibits a platykurtic distribution with a skewness of −0.405 < 0 and a kurtosis of 2.818 < 3. The results of autocorrelation and normality tests indicate a less than 1% probability of a second-order autocorrelation problem, rejecting the null hypothesis.
The GVACE variable has minimal heterogeneity, with a 0.495 coefficient of variation, indicating a mean value of 1.726 and a corresponding standard deviation of 0.854. The concentration of the values is 1.600, ranging between 0.4 and 6.4. The series’ distribution is characterized by a right-asymmetric shape, as evidenced by a skewness value greater than 0, and a predominantly leptokurtic nature, as indicated by a kurtosis value greater than 3. Additionally, the probability of the observed data being a random sample is less than 1%, which is substantiated by the autocorrelation and normality tests.
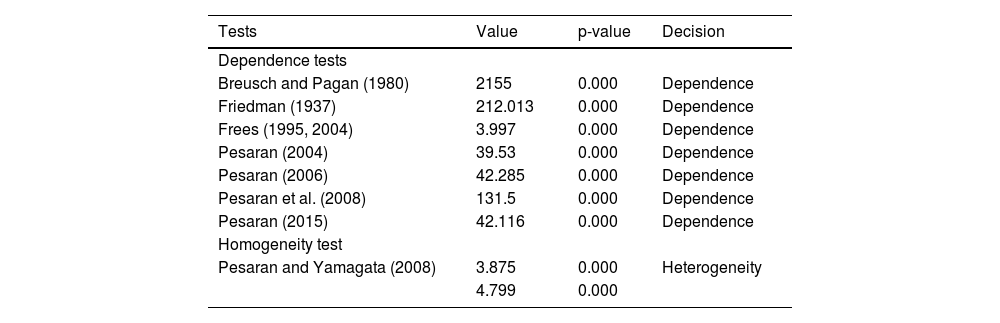
After the descriptive analysis we ascertain whether a dependent relationship is evident between individual variables in the model. As the presence of cross-sectional dependence in panel data could result in skewed and contradictory empirical findings, it is imperative to examine this possibility (Phillips & Sul, 2003). The observation that two countries are highly dependent on one another does not imply that they have the same development dynamics, and it is conceivable that each nation has unique characteristics.
As noted by Wolde-Rufael (2014), the supposition of parameter homogeneity complicates the accommodation of potential variability based on country-specific factors (Breitung, 2005). Consequently, a range of tests have been developed to ascertain the presence of a dependent relationship in this context. In the context of this analysis, we formulate an H0 hypothesis, which postulates the absence of cross-sectional dependence, and an H1 hypothesis, which proposes its presence. If the null hypothesis (H0) is substantiated, the analysis can proceed with first-generation panel unit root tests. Conversely, when alternative one (H1) is validated, the investigation should transition to second-generation panel unit root tests (Baltagi, 2021).
When examining heterogeneous slopes, the same logic applies to the false assumption of homogeneity as to the heterogeneity of the actual slopes. We use the Hashem Pesaran and Yamagata (2008) slope heterogeneity test to examine possible heterogeneity, which is an extended version of the Swamy (1970) test. According to Hashem Pesaran and Yamagata (2008), this test examines the panel’s homogeneity.
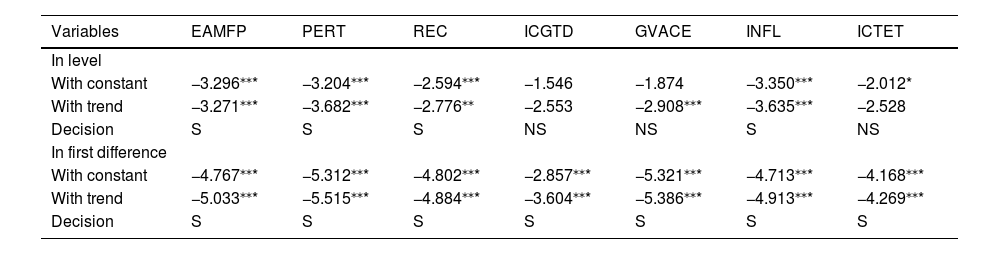
Table 3 examines the presence of dependent relationships between individuals using these tests. Each test verifies the presence of an individual dependence with probabilities that are less than 1%. Therefore the homogeneity hypothesis is ruled out at the 1% threshold according to Pesaran and Yamagata’s (2008) homogeneity test. The findings reveal that the model coefficients do not exhibit homogeneity. Consequently, it is imperative to implement the Pesaran (2007) second-generation unit root test, which can eliminate cross-sectional dependence by using a surrogate variable and employs delayed cross-sectional means in its variant of the extended augmented Dickey–Fuller unit root test. The findings of this test in Table 4 indicate that all model variables are stationary in the first difference.
Dependence and homogeneity tests.
| Tests | Value | p-value | Decision |
|---|---|---|---|
| Dependence tests | |||
| Breusch and Pagan (1980) | 2155 | 0.000 | Dependence |
| Friedman (1937) | 212.013 | 0.000 | Dependence |
| Frees (1995, 2004) | 3.997 | 0.000 | Dependence |
| Pesaran (2004) | 39.53 | 0.000 | Dependence |
| Pesaran (2006) | 42.285 | 0.000 | Dependence |
| Pesaran et al. (2008) | 131.5 | 0.000 | Dependence |
| Pesaran (2015) | 42.116 | 0.000 | Dependence |
| Homogeneity test | |||
| Pesaran and Yamagata (2008) | 3.875 | 0.000 | Heterogeneity |
| 4.799 | 0.000 | ||
Second-generation unit root test.
| Variables | EAMFP | PERT | REC | ICGTD | GVACE | INFL | ICTET |
|---|---|---|---|---|---|---|---|
| In level | |||||||
| With constant | −3.296⁎⁎* | −3.204⁎⁎* | −2.594⁎⁎* | −1.546 | −1.874 | −3.350⁎⁎* | −2.012* |
| With trend | −3.271⁎⁎* | −3.682⁎⁎* | −2.776⁎⁎ | −2.553 | −2.908⁎⁎* | −3.635⁎⁎* | −2.528 |
| Decision | S | S | S | NS | NS | S | NS |
| In first difference | |||||||
| With constant | −4.767⁎⁎* | −5.312⁎⁎* | −4.802⁎⁎* | −2.857⁎⁎* | −5.321⁎⁎* | −4.713⁎⁎* | −4.168⁎⁎* |
| With trend | −5.033⁎⁎* | −5.515⁎⁎* | −4.884⁎⁎* | −3.604⁎⁎* | −5.386⁎⁎* | −4.913⁎⁎* | −4.269⁎⁎* |
| Decision | S | S | S | S | S | S | S |
Note. NS represents nonstationarity; S represents stationarity. Significance: ⁎⁎⁎p < 0.01
Referencing Karavias and Tzavalis (2014), this study uses the unit root test that incorporates a structural break to provide additional support for our conclusions. As shown in Table 5, the results demonstrate that the series are stationary at the level, with structural breaks occurring in 2001, 2003, 2005, 2014, and 2021. Examining breakpoint dates reveals significant periods of structural change in the time series. The subsequent analysis furnishes a framework for understanding the dynamics of structural shifts in the data under scrutiny. These breakpoints indicate periods when the underlying statistical properties have undergone notable variations.
Unit root test with structural breaks.
Note. Significance: ⁎⁎⁎p < 0.01.
Oil price fluctuations and the geopolitical instability that followed the war in Afghanistan in 2001 significantly affected EU economies (Barsky & Kilian, 2004). Additionally, significant economic turbulence in 2003 resulted from fluctuating oil prices driven by geopolitical uncertainty. This global economic upheaval affected EU economies, particularly considering the financial fallout from the Iraq War (Husain et al., 2024). Moreover, in 2005, the EU faced specific challenges associated with internal complexities, including ICT and region-specific dynamics. Notable issues encompassed disparities in economic conditions across EU member states, debates about the European Constitution, and uncertainty over energy and oil costs (Holtgrewe, 2014). Furthermore, the EU economy experienced significant repercussions from the debt crisis in 2014, which affected specific nations in the eurozone, particularly Greece, Portugal, and Spain. Elevated public debt, substantial budget deficits, and concerns regarding the long-term sustainability of public finances contributed to the advent of this crisis. The affected countries experienced increased borrowing costs from the cautious response of financial markets (Sacchi, 2016). Several countries within the eurozone were compelled to implement austere fiscal policies that reduced public spending and increased taxation to restore fiscal equilibrium. Implementing these austerity measures had adverse economic consequences, including declining economic activity, increased unemployment, and social conflicts. Furthermore, the global economic impact of the COVID-19 pandemic was significant, and the EU was not exempt from the economic repercussions of this worldwide health emergency. Implementing containment measures, the imposition of travel restrictions, and supply chain disruptions resulted in a substantial economic downturn in some EU countries.
Before evaluating econometric models, it is imperative to thoroughly examine the cointegration relationships between variables. We consequently employ the second-generation cointegration test proposed by Persyn and Westerlund (2008) as it considers circumstances of individuals’ cross-sectional reliance. Table 6 reveals that the null hypothesis of no cointegration between the variable models should be rejected. This indicates that the model’s variables are related to one another over the long term and that at least one cointegrating link is evident among them.
Second-generation cointegration tests.
| Persyn and Westerlund (2008) | Z-value | Robust p-value | Decision |
|---|---|---|---|
| Gt | −6.416 | 0.000 | Cointegration |
| Ga | 0.746 | 0.000 | Cointegration |
| Pt | −5.040 | 0.000 | Cointegration |
| Pa | −1.232 | 0.000 | Cointegration |
We employ the PSTAR methodology to estimate the fundamental model and examine the nonlinear relationship between green innovation and green growth for the 27 EU countries to determine whether the order m equals one to test for linearity. The results of the specification test in Table 7 demonstrate that the alternative logistic PSTAR specification (m = 2) is accepted and the null hypothesis of linearity is rejected.
PSTAR linearity test.
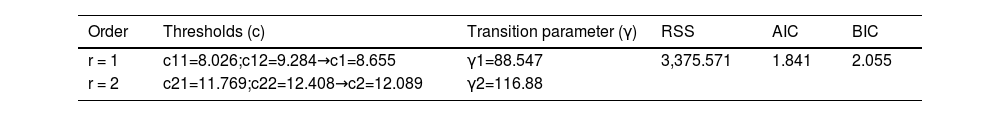
The linearity tests are only the first step before moving on to the final PSTAR model estimation. An equally important second step is determining the ideal number of transition functions, which enables us to determine the number of regimes that best describe the dynamics of the relationship between green innovation and green growth. If m = 2, two thresholds per regime appear. For the first regime, c11=8.026 and c12=9.284, which gives a mean first threshold of c1=8.655. For the second regime, c21=11.769 and c22=12.408, which gives a mean second threshold of c2=12.089.
The results in Table 8 reveal two optimal thresholds of 8.655 and 12.089, indicating that the transition parameter of the PSTAR model, with values of 88.547 and 116.88, has a pivotal influence on this phenomenon. These findings indicate a nonlinear correlation between EAMFP and PERT. The Akaike information criterion (AIC) and the Bayesian information criterion (BIC) are 1.841 and 2.055, respectively, while the residual sum of squares (RSS) is 3375.571.
Table 9 reveals three regimes. Regime 1 represents a threshold of 8.655%, Regime 2 represents a threshold between 8.655% and 12.089%, and Regime 3 represents a threshold of 12.089%. In Regime 1, green innovation has a 5% significant positive impact on green growth. ICGTD, REC, and GVACE significantly influence EAMFP. An 1% increase in the latter results in a respective decrease of 0.116, 0.379, and 0.351 in the EAMFP.
PSTAR estimation.
| Variables | Regime 1: PERTit-1 ≤ 8.655 | Regime 2: 8.655 < PERTit-1 ≤ 12.089 | Regime 3: PERTit-1 > 12.089 | |||
|---|---|---|---|---|---|---|
| EAMFPit-1 | 0.654 | 2.625⁎⁎* | 0.425 | 2.327⁎⁎ | −1.111 | −6.444⁎⁎* |
| EAMFPit-2 | −0.648 | −2.991⁎⁎* | 0.051 | 0.325 | 0.668 | 4.241⁎⁎* |
| PERTit | 0.109 | 2.408⁎⁎ | 0.091 | 2.453⁎⁎ | 0.066 | 2.394⁎⁎ |
| ICGTDit | −0.116 | −3.635⁎⁎* | 0.126 | 4.579⁎⁎* | 0.003 | 2.277⁎⁎ |
| RECit | −0.379 | −6.798⁎⁎* | 0.124 | 2.753⁎⁎* | 0.019 | 2.795⁎⁎* |
| GVACEit | −0.351 | −2.013⁎⁎ | −0.446 | −2.823⁎⁎* | 0.124 | 2.165⁎⁎ |
| INFLit | 0.485 | 1.275 | −0.424 | −2.172⁎⁎ | 0.039 | 2.321⁎⁎ |
| ICTETit | 0.004 | 0.318 | 0.006 | 2.500⁎⁎ | 0.015 | 2.238⁎⁎ |
| Observations | 119 | 61 | 441 | |||
Note. Significance: ⁎⁎⁎p < 0.01
Regime 2 represents a threshold between 8.655% and 12.089%, indicating that a 1% increase in PERT positively impacts EAMFP by 0.091%. Similarly, a 1% increase in ICGTD and REC results in a significant improvement, respectively increasing EAMFP by 0.126% and 0.124%. In contrast, a 1% increase in GVACE and INFL has an adverse effect, reducing EAMFP by 0.446% and 0.424%, respectively. Conversely, a 1% increase in ICTET has a positive marginal impact, increasing EAMFP by 0.006%.
Regime 3 represents a threshold of 12.089%, revealing that a 1% increase in PERT increases EAMFP by 0.066%. Similarly, a 1% increase ICGTD and REC significantly increase EAMFP by 0.003% and 0.019%, respectively. In addition, a 1% increase in GVACE, INFL, and ICTET respectively raises EAMFP by 0.124%, 0.039%, and 0.015%.
Figs. 1 and 2 illustrate the transition function of PERT. This function explains how it varies over time, particularly as it moves from a low and intermediate regime to a high regime. The first transition function has a substantial value (γ11=88.547). In contrast, the second transition function is γ12=116.88, which is also strong, indicating that the transition is abrupt. The high value indicates that the PERT variable, which explains technological innovations associated with the environment, has an immediate influence on the EAMFP variable, which measures multifactor productivity adjusted to the environment. The continuous effect of PERT on EAMFP indicates that transitions toward green innovation have a significant and lasting influence. Green innovations enhance production process efficiency, curtail the generation of outputs that are detrimental to the environment and preserve natural resources. These positive effects and the continuous impact of PERT on EAMFP suggest that transitions toward green innovation have a significant and lasting influence, meaning that the benefits of green innovation are immediate and prolonged over time.


From a control perspective, the results demonstrate a statistically significant positive impact of ICTET on EAMFP, which aligns with previous literature. (Chen et al., 2022). Similarly, the positive impact of INFL on EAMFP indicates that INFL improves environmental quality (Bilal et al., 2022), enhancing green growth.
Robustness Granger noncausality testThe Granger noncausality test is a statistical model that is used to assess whether the historical values of one variable can help predict another variable. The Dumitrescu and Hurlin (2012) test is often employed to provide a more detailed and accurate response to the pairwise univariate correlations between EAMFP and the other independent variables (Bouattour et al., 2024). This test is an advanced version of the Granger noncausality test for panel data that uses W-bar and Z-bar statistics, where the W-bar statistic denotes the mean statistic of the test, and the Z-bar statistic represents the standard normal distribution.
The Granger causality test statistics from Dumitrescu and Hurlin (2012) in Table 10 reveals a unidirectional relationship between PERT and EAMFP. In addition, a bidirectional relationship is evident between GVACE and EAMFP. The circular economy focuses on sustainability by minimizing waste and optimizing resource utilization through practices such as recycling and reuse. EAMFP is intended to foster a circular economy while controlling environmental impact. Therefore, circular economy practices can contribute to EAMFP by promoting resource efficiency, reducing environmental degradation, and fostering innovation. Subsequently, green growth policies and investments can establish an environment that promotes and enables circular economy practices. However, no causal relationship is evident between ICTD and EAMFP.
Granger noncausality test.

Our results support the hypothesis of a dynamic relationship, evidenced by the statistical significance of the lagged values. Additionally, two distinct regimes are revealed that confirm the presence of a critical threshold that affects green technological innovation and its impact on green growth. Findings reinforce the nonlinear relationship that aligns with previous empirical research (Luan et al., 2024), and validates H01.
Regarding control variables, ICTET positively affects EAMFP independent of PERT intensity. Therefore, digitalizing processes through digital innovation reduce fossil fuel consumption and promote REC, which lowers carbon emissions, optimizes energy use (Chen et al., 2022), and promotes green growth. INFL positively impacts EAMFP by improving environmental quality, as expected based on the previous literature (Bilal et al., 2022).
The first exogenous variable findings confirm that PERT positively influences EAMFP, irrespective of the extent of this innovation. However, the PERT’s impact becomes less pronounced but remains statistically significant when moving from intermediate (Regime 2) to high (Regime 3). The positive impact demonstrates that PERT facilitates EAMFP, in line with previous literature (Fernandes et al., 2021; Meirun et al., 2021) and the conclusions of Khan et al. (2023) regarding EU economies.
Furthermore, considerable expenses associated with PERT explain the diminished positive impact of green technological advancements on EAMFP (Regimes 2 and 3), which impedes the ability to offset them with green growth benefits (Li et al., 2022). Indeed, economic consequences such as lower productivity and financial performance can accompany green innovation (Rezende et al., 2019; Saliba de Oliveira et al., 2018), which can result in a diminished positive impact on EAMFP (Li et al., 2022; Mensah et al., 2018). Moreover, the declining positive effect of green technological innovation is attributable to the fact that most green patents constrain technology dissemination (Chuzhi & Xianjin, 2008; Raiser et al., 2017; Wang et al., 2012). The advancement of green technologies is contingent upon enhancing existing technologies. Consequently, patents present an obstacle to reducing carbon emissions and can subsequently impede green growth. Therefore, the transfer of patented green technologies becomes necessary (Raiser et al., 2017). Furthermore, not all green technologies are eligible for patent protection. Indeed, some inventors cannot obtain patent rights for their inventions because not all technologies or processes are eligible for protection (Nikzad & Sedigh, 2017). Additionally, high upfront costs for obtaining patent protection may discourage some inventors from pursuing patent protection. Moreover, the influence of ICGTD, which pertains to international collaboration in advancing green technologies, is only advantageous from the second regime onward. This favorable result, regardless of the prevailing regime (intermediate or strong), confirms the central influence of green technological innovation transfer in promoting EAMFP, which corroborates the findings of Fernandes et al. (2021).
Regarding renewable energy’s unfavorable impact on green growth, when green innovation levels are below 8.655 (low regime), the results indicate that insufficient green technological innovation does not develop effective renewable energy technologies that promote EAMFP. This result is consistent with that of Aydin and Degirmenci (2024) and Khan et al. (2022). Moreover, restricted PERT advancement intensifies the financial burden associated with the transition to renewable energy sources, reinforcing reliance on nonrenewable energy (Chen & Lei, 2018). Conversely, as PERT reaches 8.655 and above, the impact of REC begins to positively affect EAMFP. These findings are consistent with Esmaeilpour Moghadam and Karami (2024) and Li et al. (2022), highlighting the crucial contribution of PERT in adopting renewable energy. The proliferation of green technological innovation can facilitate the broader implementation of renewable energy sources and provide the impetus for EAMFP. This positive relationship aligns with the earlier research (Ahmed et al., 2022; Sohag et al., 2021). Therefore, the results of the low, intermediate, and strong regimes validate H02.
Ultimately, the negative effect of GVANCE on EAMFP in the initial low and intermediate regimes, which is defined as below 12.089, is attributable to weak PERT, which hinders the transition to circularity. Conversely, the advent of a robust regime of green technological innovation (exceeding 12.089) facilitates circularity, thanks to the positive relationship between PERT and GVANCE (Triguero et al., 2022). This then promotes EAMFP in EU economies. These findings mirror those of previous studies (Chauhan et al., 2022; Khan & Khurshid, 2022; Sánchez-García et al., 2024; Suchek et al., 2021) and support H03.
The findings of this study are consistent with previous research (Luan et al., 2024; Zhang et al., 2023; Wang, 2023), enhancing the previous knowledge regarding the nonlinear relationship between green technological innovation and green growth in a new empirical framework. However, this study cannot be directly compared with studies concerning the EU as most of the research pertains to China, highlighting the necessity for further investigation on the nonlinear aspect of this relationship in the EU economies. Fig. 3 illustrates the findings and validation of our research hypotheses.
Conclusions, policy implications, limitations, and future research directions
Despite an extensive body of literature linking green technological innovation and green growth, some areas remain unsettled. Previous research on this topic has indicated that much remains to be understood about its nuances. Furthermore, the extant literature on this subject area has tended to adopt linear frameworks for analysis. In response, this study employs the PSTAR model for 27 EU nations from 2000 to 2022 to investigate the nonlinearity of this relationship. This approach helps us to identify the trajectory of the transitional process from a weak regime to an intense regime. Furthermore, we construct a comprehensive framework that unifies green technological innovation, renewable energies, and the circular economy under a single green growth model.
The results reveal two optimal thresholds that influence how green technological innovation contributes to green growth, distinguishing between three regimes. Additionally, the PSTAR model results demonstrate that green technological innovation promotes green growth. However, as innovation transitions from intermediate (Regime 2) to high (Regime 3), its effect on green growth becomes less pronounced but remains statistically significant. The diminished positive effect of green technological advancements on green growth can be attributed to the considerable costs associated with the green technological innovations implemented in EU countries, which can impede the ability to offset them with green growth benefits.
Furthermore, the results indicate that insufficient green technological innovation has not produced effective renewable energy technologies that are capable of promoting green growth. In addition, limited green technological innovation progress in EU countries raises the financial burdens related to renewable energy transitions, thereby increasing dependence on nonrenewable energy. Conversely, the impact of renewable energy begins to have a positive effect on green growth when EU countries invest more in green technological innovation. Therefore, green technological innovation influences the impact of renewable energy on green growth. Overall, the results demonstrate that a robust green technological innovation regime facilitates circularity and promotes green growth in EU economies, suggesting that circularity’s influence on green growth depends on advancing green technological innovation.
This study provides three significant contributions to extant debates. First, we demonstrate a nonlinear relationship between green technological innovation and green growth that varies depending on green technological innovation intensity. Second, the study also examines how renewable energy and circularity affect green growth in relation to green technological innovation. Third, we use the PSTAR model to estimate green technological innovation thresholds and their impact on EU economies.
Based on these findings, policymakers in EU economies should focus on green technological innovation to advance the 2030 SDGs and maintain environmental protections. It is imperative that policymakers create incentives and regulations to encourage green technological innovation to maximize the positive impacts of green technological innovation on green growth, renewable energy, and circularity. Moreover, effective strategies are required to encourage international collaboration, to harness the potential of technology transfer and drive green growth.
Despite its implications, this study has notable limitations that indicate potential areas for future research. First, while the PSTAR model can capture the nonlinear dynamics of panel data, the model does not accommodate the interaction between different variables. Therefore, the GMM approach is a potential avenue for future research to better understand these interactions. Resultant findings can enable EU policy review to be conducted more effectively to develop improved strategies. Second, this study adopts an overarching perspective on green technological innovation; however, it can be argued that Industry 4.0 technologies represent a foundation for green technological innovation in the context of digitalization (Madzík et al., 2024). Therefore, further research is needed to distinguish between the relative significance of digital and nondigital green technological innovation in promoting green growth in EU countries to provide a more nuanced understanding of each category’s impact. These pathways provide a framework for future research and offer insights into the nexus between digitalization, green technological innovation, and green growth. They are also essential for informing EU environmental policies.
Availability of data and materialsIn this study, the PSTAR model is employed to examine the impacts of green technological innovation, the development of renewable energies, and the circular economy on green growth in 27 EU countries over the period 2000 to 2022. The data are collected from WDI, OECD, and Eurostat databases. The authors use Stata 17.0 and Matlab R2021a software to run different programs. The data are available on request from the corresponding author.
FundingThis project is completed without any funding.
CRediT authorship contribution statementAfef BOUATTOUR: Writing – review & editing, Writing – original draft, Validation, Supervision, Methodology, Investigation, Conceptualization. Sarra GHARBI: Funding acquisition, Formal analysis, Data curation. Maha KALAI: Software, Methodology, Investigation, Conceptualization. Kamel HELALI: Validation, Supervision, Software, Methodology.
The authors state that this manuscript is an original piece, has not been previously published, and is not under consideration for publication elsewhere. They affirm that all listed authors have read and approved the manuscript and that no other individuals meet the criteria for authorship but are omitted. Additionally, they confirm that all authors agree on the order in which they are listed. The Corresponding Author will serve as the primary contact for the editorial process. The authors are responsible for updating each other on progress, submitting revisions, and giving final proof approval. They also bear responsibility for the accuracy of the statements made in the manuscript.
During the revision of this work, the author(s) used Grammarly to proofread the manuscript's language. After using this tool/service, the authors reviewed and edited the content as needed and took full responsibility for the publication's content.