


In today's context of escalating environmental pressure, traditional methods of natural resource conservation face numerous challenges. The use of big data analytics to support the formulation of environmental policies has become a crucial approach for enhancing the efficiency and scientific basis of these policies. To enhance the reliability of the results, this study employed two algorithms: Bayesian inference and a weighted Support Vector Machine (SVM) algorithm based on the grey relational analysis. Bayesian inference constructs a conditional probability network to model and analyze complex relationships in a multi-factor environment, allowing for dynamic updates of the influences of various factors and providing precise evaluations of natural resource protection policies. This approach integrates prior information and observational data to ensure the continuity and accuracy of predictions. The weighted SVM algorithm based on grey relational analysis improves the accuracy of the predictive model by identifying key factors within multi-dimensional data and assigning appropriate weights to different features to address the challenges posed by incomplete or noisy data. By combining these two methods, this study effectively handled complex data and interactions while enhancing prediction accuracy, thereby providing reliable data support and a scientific basis for policy formulation and adjustment. The study revealed that these methods not only effectively predict and assess the impact of policies, but also provide policymakers with real-time data support, enabling more precise decision-making. Although shortcomings remain in data processing and policy prediction accuracy, the methods proposed in this study offer new ideas and tools for addressing these issues.
In today's rapidly developing digital age, big data have become a key tool for solving complex environmental and social issues (Abdullahi et al., 2024; Darwish & Bakar, 2018; Eweoya et al., 2023; Lazarevska et al., 2022; Sajid & Kavitha, 2024; Tu et al., 2023; Wu et al., 2022). With the increasing environmental pressures in the field of natural resource conservation, traditional conservation methods are no longer able to meet the growing need for protection (Aziz et al., 2024; Chen et al., 2023; Cunha et al., 2022; van Klink et al., 2022; Yan et al., 2024). Therefore, the development and implementation of a data-driven intelligent policy framework to optimize the management and conservation of natural resources is urgently required. In this context, using big data analytics to support policymaking not only enhances the scientific nature and effectiveness of policies but also provides real-time data support for decision-makers, making resource conservation more precise and effective.
Recent studies on the assessment and forecasting of natural resource protection policies rely on traditional quantitative and qualitative analytical methods. These approaches typically evaluate policy effectiveness using historical data, expert judgment, and statistical models. Common methods include econometric models, cost-benefit analyses, and multi-criteria decision models. Although these methods support policy formulation, they have notable limitations. First, several studies depend solely on existing data, making it challenging to address the complex and highly uncertain issues prevalent in natural resource management. Natural resource protection often involves intricate cross-disciplinary systems in which interactions among various factors (such as ecological conditions, socioeconomic factors, and climate change) complicate the assessment results, making them less representative of actual conditions. Second, traditional evaluation methods have a singular approach for dealing with uncertainty and randomness, particularly in situations of data scarcity or low data quality, which undermines robust decision support. Although machine learning techniques have been gradually applied in the field of natural resources in recent years, existing predictive models often fail to effectively integrate complex interrelationships among multiple environmental variables, resulting in weak prediction accuracy and interpretability. Consequently, policy assessment and optimization frequently face the dual challenges of insufficient information and limited analytical tools, hindering effective guidance for the formulation and adjustment of natural resource protection policies.
For natural resource conservation, research on intelligent policies not only helps improve policy efficiency but also enhances the adaptability and sustainability of policies. By precisely analyzing the information contained in big data, policymakers can better understand the complex dynamics of resource use, predict trends in environmental change, and adjust conservation measures accordingly (Wang et al., 2023; Wei et al., 2024; Yin et al., 2021). Additionally, this method helps to assess the potential impacts of different policy options, providing a scientific basis for formulating more reasonable and sustainable management strategies (Bashir et al., 2023; Cao & Jian, 2024; Yan et al., 2024). Therefore, an in-depth study of intelligent policy frameworks based on big data is of theoretical and practical importance for enhancing the effectiveness of natural resource conservation.
However, despite the increasing application of big data and intelligent technologies in environmental protection, existing research methods have several limitations. First, several studies lack in-depth quantitative analyses of policy impacts, making it difficult to predict the long-term effects of policy implementation accurately (Aziz et al., 2024; Cui et al., 2023; Sun et al., 2024). Second, existing models and algorithms often fail to adequately process and analyze large-scale and multi-dimensional environmental data, leading to potentially inaccurate analysis results or limited application scope (Chua et al., 2023; Fu et al., 2023; Zahedi & Aslani, 2023). Therefore, exploring more efficient data analysis methods and developing models that can consider various factors and provide precise predictions have become urgent requirements in the field.
The research objectives of this study are twofold. First, to construct a Bayesian inference-based framework for assessing natural resource protection policies under uncertain conditions. This framework aims to provide more accurate estimates of policy effectiveness through dynamic updates of implementation outcomes, thus addressing the inadequacies in uncertainty management observed in the current studies. Second, this study aims to develop a grey relational analysis-based weighted support vector machine (SVM) algorithm that leverages machine learning to predict the specific impacts of policy changes on natural resource protection. This algorithm can forecast the short- and long-term effects in high-dimensional data and multivariable interaction scenarios. Through these innovative approaches, this study aims to offer policymakers more forward-looking and scientific decision support, ultimately enhancing the design and execution efficiency of natural resource protection policies. Big data played a crucial role in this study, encompassing a wealth of complex and multi-dimensional information related to the ecological environment, policy implementation, and socioeconomic factors. Bayesian inference facilitates the integration of these data and progressively updates the assessments of the impacts on natural resource protection, thereby showcasing its advantages in addressing the uncertainties and dynamics introduced by big data. Simultaneously, grey relational analysis combined with the weighted SVM algorithm effectively identifies and weighs key features within the data, extracting correlations between policy changes and environmental indicators while overcoming challenges related to data incompleteness and complexity, thus providing a precise basis for predicting and optimizing natural resource protection policies.
These studies not only enrich the existing theories of environmental protection, but also provide scientific guidance and support for the formulation and implementation of practical policies, having considerable academic value and practical application prospects.
Analysis of natural resource conservation policy impacts based on bayesian inferenceBayesian inference is a statistical method based on the probability theory that allows the derivation of new conclusions or the optimization of decisions by continuously updating existing data. In the analysis of the impacts of natural resource protection policies, the effectiveness of policy implementation is often influenced by various uncertain factors, such as the complexity of the ecological environment and regional differences in policy execution. The strength of Bayesian inference lies in its ability to progressively update the assessments of policy effectiveness in the face of such uncertainties. Thus, through Bayesian inference, this study can effectively integrate historical data and new information to dynamically evaluate the impact of policies and provide decision-makers with more scientific and reliable evidence. Furthermore, the theoretical foundation of Bayesian inference is rooted in Bayes' theorem, which leverages the relationship between the prior and posterior probabilities, thereby making the decision-making process more flexible when faced with uncertainty.
This study applied Bayesian networks to analyze natural resource conservation policy impacts, enabling simulations and reasoning regarding the effects of policy changes on environmental variables. In this application, Bayesian networks are not just a general type of probabilistic graphical model; they are specifically designed to reflect the complexity and variability of natural resource conservation. The nodes in such network models represent various environmental and policy variables, such as climatic conditions, regulatory changes, and anthropogenic activities, whereas the directed edges indicate causal relationships between these variables. By setting up conditional probability tables (CPTs), this network can predict the probability distribution of future resource states based on existing environmental status and policy settings, which is a distinctive feature that differentiates it from other types of Bayesian networks. Fig. 1 shows the analytical approach to the natural resource conservation policy impact analysis used in this study.

The Bayesian network applied to natural resource conservation policy impact analysis includes: (1) a set of variables covering all key natural resource elements and related policy factors, with each variable equipped with a limited range of possible states; (2) a set of directed edges that precisely define the dependencies between variables, i.e., how the change in the state of one variable affects another; (3) the formation of a directed acyclic graph (DAG) to ensure that causal reasoning in the model does not lead to logical errors due to circular dependencies; and (4) for each variable X, a CPT is constructed based on the state combinations of its parent nodes Y(1),…,Y(v), which defines the probability of the state of the variable given the states of its parent nodes, with the parent-child relationship defined by XY|(1),..,Y(v). The Bayesian network structure constructed as described above is particularly suited for handling uncertainties and variabilities in natural resource conservation, making policy analysis and resource management decision-making more scientific and precise.
In the analysis of natural resource conservation policy impacts based on Bayesian inference, the network node set reflects all the relevant variables in the field of environmental conservation policy. These nodes include various states of natural resources, such as forest cover, water quality indicators, wildlife population numbers; policy measures, such as changes in laws and regulations, the establishment of protected areas, pollution control policies; environmental factors such as rainfall and temperature; and socioeconomic factors, such as regional development levels and public environmental awareness. Each node represents a specific variable, the state of which can be discrete or continuous, depending on the characteristics of the variable and analysis requirements. The Bayesian network establishes the joint probability distribution of these variables by defining conditional probability relationships between nodes. The joint probability distribution is integrated through the CPTs of all nodes in the network, describing the probability of all possible outcomes of natural resource states under a series of policy inputs and environmental conditions. This allows decision-makers to predict possible changes in natural resources after the implementation of specific policies, thereby assessing the effects of different policy options. By calculating the joint probability, sensitivity analysis, probability inference, and decision support can be performed, thereby optimizing resource protection measures and enhancing the scientific and practical effectiveness of policies. Let a set of nodes be represented by I

The joint probability of I is:

Using the joint probability of I, the conditional and marginal probabilities, O(Au) and O(Au|r), respectively, can be calculated. Let a set of evidence be represented by r. We then have

The Bayesian network model, applied to the analysis of natural resource conservation policy impacts, maps the paths and causal relationships of policy changes to environmental variables with their structure. The nodes in this model include natural resource conditions, policy measures, environmental factors, and socioeconomic factors, where the arrows represent the impact of policy or environmental factors on the state of natural resources, that is, the influence of parent nodes on child nodes. The probability relationships between nodes can be obtained not only through traditional data analysis but also in combination with the experience of domain experts and the latest scientific research, ensuring the accuracy of the model and timeliness in predicting policy effects.
In this study, the Bayesian inference model used for natural resource conservation policy impact analysis is a probabilistic model specifically designed to assess and predict the impact of policy decisions on changes in the state of natural resources. The model builds a DAG, in which the nodes represent various key indicators of natural resources, related policy measures, and other influencing factors. The directed edges between the nodes represent the causal relationships between these factors and policy measures, with each node equipped with a CPT that describes the probability distribution of the state of the node, given the state of its parent nodes. This model uses Bayesian inference to integrate existing data and expert knowledge, updating probability predictions about the future state of natural resources, and thus providing policymakers with quantitative information on the potential outcomes of different policy options. The equation for conditional probability is

Suppose that the joint probability of X and Y is represented by O(X|Y); then, the formula is as follows:

When adding a condition Z, the calculation changes as follows:

Suppose a specific hypothesis G is represented by Y, the observed evidence R:O(Y) is the prior probability of G before receiving R represented by X, the conditional probability of Y occurring under various states with R is represented by O(X|Y), the posterior probability of G being true after receiving R is represented by O(X|Y), and the marginal probability of X is represented by O(X); we then have the following basic formula for Bayesian inference:

In the application of Bayesian networks to the analysis of the impacts of natural resource conservation policies, this study introduces d-separation, which simplifies the complex probabilistic relationships and calculations among variables in the network. The core of d-separation is to block the transmission of information by determining the states of the intermediate variables on the network path, thus determining whether the two variables are independent. Specifically, in the context of natural resource conservation, if variables X and Y are connected through variable N, and the path is serial or divergent, then when the state of N is known, X and Y are considered conditionally independent, which means that changes in information or policy are not directly transmitted between X and Y. Conversely, if the connection is convergent and neither N nor its descendants are observed, X and Y are considered independent. Conditional independence is a core concept in Bayesian inference, indicating that two random variables are independent given certain conditions. Specifically, if random variables A and B are independent when random variable C is known, then A and B are considered conditionally independent, given C. This relationship can be intuitively represented using a Bayesian network, where nodes represent variables and edges indicate dependencies. If two nodes are not directly connected, however, are linked through a third node, it can be inferred that the two variables are conditionally independent. In this study, the application of conditional independence is evident when modeling the impact of natural resource protection policies. Through Bayesian inference, the model can effectively simplify the dependencies among certain variables. For instance, once the specific content of a policy is understood, the influence of related policies may become negligible. This not only reduces the complexity of the model but also enhances the accuracy and interpretability of predictions. Conditional independence allows the model to be more flexible when dealing with multiple variable interactions, providing more precise evaluations and optimization strategies for natural resource protection policies. The equation is as follows:

In the application of Bayesian networks to the analysis of the impacts of natural resource conservation policies, the three basic forms of d-separation play specific roles and are of great importance.
- (1)
Serial connection: Suppose there are three nodes X, Y, and Z, where X and Z are serially connected through Y. When we obtain "facts" about Y, i.e., the state of Y is observed, the pathway for information transfer between X and Z is blocked. For example, if Y represents the implementation status of a specific policy measure and X and Z represent different environmental indicators, such as water and air quality, knowing the state of policy measure Y allows us to independently assess the impact of the policy on X and Z without considering the direct interaction between X and Z. This helps to analyze the impact of a policy on each environmental indicator separately, allowing for more precise policy adjustments or designs.
- (2)
Divergent connection: In a divergent connection, if node Z is the central node and its state is known, then the connection between all children of Z (for example, Y and X) is blocked. In the Bayesian network for natural resource conservation, if Z represents a core environmental policy variable, and Y and X represent different environmental outcomes affected by that policy (such as forest cover and wildlife populations), understanding the state of Z allows the specific impacts of that policy on Y and X to be considered independently. Thus, analysts can distinguish and assess the independent effects of a single policy variable on multiple resource indicators.
- (3)
Convergent connection: In scenarios with convergent connections, the connections between all parent nodes are blocked if the state of node X is known. In a Bayesian network for environmental policies, this situation often occurs when X represents a comprehensive environmental status indicator (such as ecosystem health), and the parent nodes might be different policy measures or environmental factors. Knowing the state of X, the interdependencies among these parent nodes are disregarded, allowing the analyst to separately evaluate the contribution of each policy or factor to the state of X without worrying about their complex interactions, thereby simplifying the complexity of the model and improving the analytical efficiency.
Through the d-separation effects of these three types of connections, Bayesian networks can effectively simplify the analysis of natural resource conservation policy impacts, helping policymakers and researchers better understand and predict the specific impacts of policy changes on the environment.
In the application of Bayesian inference to the analysis of the impacts of natural resource conservation policies, a simple example can be constructed to illustrate its internal logic, as shown in Fig. 2. Fig. 2 shows the application of Bayesian inference in the analysis of the impacts of natural resource protection policies structured as a DAG. In this graph, each node represents an event state, with node values T (true) or F (false). The prior probability of a root node reflects the initial estimate of an event that occurs without additional information, and is typically determined based on expert knowledge or historical data. Other nodes serve as parent nodes, with their probabilities of occurrence provided by CPTs, which indicate the likelihood of child-node states based on the states of the parent nodes. This structure allows researchers to update the prior probability of the root node and using Bayes' theorem, calculate the posterior probabilities of any node after observing the states of other nodes. This facilitates the dynamic evaluation and optimization of policy impacts. This example clearly demonstrates how Bayesian inference can be employed to model and analyze complex decision-making processes.

Suppose that the goal of policy analysis is to assess the impact of a new water resource protection policy (O) on river water quality (W). In addition, river water quality may be influenced by industrial emissions (U). Policymakers must understand whether water quality has improved after the implementation of the new policy. For this purpose, we set the following conditions: policy O can be enacted (O = b) or not enacted (O = v), and industrial emissions can be high (U = g) or low (U = m). These conditions directly affect the state of river water quality, W, which can be improved (W = h) or not improved (W = B). Using these settings, analysts can infer the probability of water-quality improvement based on the status of policy implementation and industrial emissions.
When constructing the Bayesian network, we first determined the nodes in the network and their probabilistic relationships. In this example, the nodes included policy implementation (O), industrial emissions (U), and river water quality (W). Policy implementation and industrial emissions are independent; therefore, they do not connect directly through other nodes, however, both directly affect the river water quality node. The edges in the Bayesian network from policy implementation and industrial emissions point toward water quality, indicating the potential impact of these factors on water quality. Each node has a CPT; for example, the probability of water quality improvement depends not only on whether the policy is implemented but may also be affected by the level of industrial emissions. Through such network settings, these conditional probabilities can be set based on existing data or expert experience using Bayesian inference to update and predict the probability of water quality improvement, given policy and emission conditions, providing a scientific basis for policy decisions. This method is particularly suited for dealing with common uncertainties and variabilities in policy analyses.
To further elaborate how Bayesian inference is applied to optimize the impact analysis of natural resource conservation policies, a flowchart is shown in Fig. 3, and the detailed steps are explained below.
- (1)
Setting Prior Probabilities: Prior probabilities are set based on past experiences or expert opinions. For example, in the context of natural resource conservation, policy implementation (O) can be based on data from similar previously successfully implemented policies. If historical data show that similar past policies have a 70 % implementation success rate, then we can set O(O = b)=0.7 and O(O = v)=0.3. Similarly, rainfall (E) is a natural factor and its probability can be set based on climate models or long-term weather records.
- (2)
Building CPTs: CPTs define the probability of one variable given the states of other variables. Suppose O(D|O,E) can be subdivided into the probability of forest cover improvement under the policy implementation and rainfall conditions. These data can be obtained from previous studies, field surveys, or simulations.
- (3)
Calculating Joint Probability Distributions: Joint probability distributions are calculated by combining prior and conditional probabilities, reflecting the independent effects of each factor and their interactions. That is, calculating O(D,O,E) requires not only O(O) and O(E), but also O(D|O,E) to integrate this information, providing a comprehensive probability model.
- (4)
Applying Observed Data: When an increase in forest cover is observed, this information is used as new "facts" to update the network. This implies that all probability paths related to the decrease in forest cover were adjusted because these paths were inconsistent with the observed data.
- (5)
Normalization: Normalization ensures that all probabilities sum to one, which is a fundamental requirement in the probability theory. Through this step, we ensured that the model maintained statistical consistency and accurately reflected all possibilities.
- (6)
Updating prior probabilities: Based on the observed improvement in forest cover, we updated the probabilities of policy implementation, which is a process of probability correction using the Bayesian theorem. The updated probabilities reflect the likelihood that new evidence will influence different policy states.
- (7)
Introducing More Observed Data: If relevant environmental indicators, such as water quality or biodiversity, improve, these data can be used to further adjust the model. Each new data point helps us better understand the comprehensive effects of the policy.
- (8)
Applying the Final Probability Distribution: The final probability distribution O(D,O,E) can be used to make informed policy decisions. This can guide policymakers in deciding whether to continue, modify, or cancel policies based on data-driven decision making.

Grey relational analysis is a mathematical method used to analyze system development trends and relationships between variables, and is suited for situations with limited data and incomplete information. The impact prediction of natural resource protection policies often faces issues of data scarcity and incomplete information, making grey relational analysis valuable for identifying correlations between policy changes and environmental indicators. To enhance the prediction accuracy, this study integrated the weighted SVM algorithm, a widely used machine learning technique for classification and regression tasks. By employing a weighted SVM, the model could assign different weights to features of varying importance, ensuring that the key characteristics considerably influence the results of multi-dimensional data analysis. Thus, the combination of grey relational analysis and weighted SVM not only identified critical influencing factors in the face of incomplete information but also leveraged advanced machine learning algorithms to accurately predict the specific impacts of policy changes.
This study explored and quantified the interactions and correlations between various environmental policies and natural resource status indicators using Grey Relational Analysis. By analyzing the geometric similarity between policy changes and environmental responses, this method revealed which policies were more closely related to changes in environmental indicators, thereby assisting decision-makers in understanding and assessing the actual effects of policies. Compared to other applications, grey relational analysis aimed at predicting the impacts of natural resource conservation policies focuses on capturing the intrinsic connections within complex systems under conditions of incomplete or non-stationary data. In this application, the sequence data of policy changes and natural resource statuses were used to calculate the degree of correlation and determine the impact magnitude and direction of policies. Fig. 4 shows the analytical framework used to predict the impact of natural resource conservation under policy influence.

In the context of natural resource conservation, the policy impact prediction method based on Grey Relational Analysis involves the following steps:
- (1)
Setting system characteristics and factor sequences: In this study, feature extraction was a crucial first step in implementing the proposed methods aimed at distilling key features relevant to natural resource protection policies from complex datasets. Principal component analysis (PCA), which reduces dimensionality and filters the original data to identify features with high variance or substantial informational content, was used. This process minimized data redundancy and enhanced the computational efficiency and predictive capability of the model. The extracted features provide essential data support for subsequent Bayesian inference and grey relational weighted SVM algorithms, enabling deeper analysis. First, the characteristic sequence of system was A0={A0(1),A0(2),…,A0(v)}, where A0 represents a key environmental indicator, such as the forest cover rate or air quality index, and serves as the reference sequence. We then defined the policy factor sequences A1,A2,…,Al, which are the various policy measures, regulatory changes, or specific enforcement actions that affect the environmental indicators.
- (2)
Calculating Sequence Ranges: This step involved analyzing the range of variation between each factor sequence and the characteristic sequence; that is, calculating their ranges. This step helps reveal the maximum and minimum impact differences that various policy factors might have on environmental indicators. The formula is as follows:

(3) Determining the maximum and minimum ranges of sequences. This step involved the entire dataset, including all comparisons between policy factors and the characteristic sequence, to determine the observed maximum and minimum ranges in all sequence comparisons. This enabled subsequent assessments of the impact magnitude of the policy measures. The formula is as follows:

(4) Calculating Grey Relational Coefficients: Based on the ranges obtained in the previous step, the grey relational coefficients between each policy factor and environmental indicator were calculated. These coefficients were evaluated by analyzing the geometric similarity and indicating the strength of the association between each factor and the environmental indicator. Assuming the resolution coefficient is represented by π, the calculation formula is as follows:
(5) Calculating the GRD: By integrating the relational coefficients from the previous step, the final GRD was calculated. This association metric indicates the overall relevance and impact level between each policy measure and environmental indicator. The higher the relational degree, the stronger the consistency between the policy and the environmental indicator, and the more evident the effect of the corresponding policy. Assuming that the degree of correlation between each factor and the reference value is represented by σu, the formula is as follows:

In the field of natural resource conservation, traditional SVM regression models are not suitable for predicting the impacts of policies because they usually employ equal-weight regression for each sample feature, ignoring the variability in the impacts of different environmental policy measures. Different policy measures have varying degrees of impact on environmental indicators. For example, a notable regulatory change may have a substantial impact on water quality or forest coverage, whereas other small-scale local measures may have minor impacts. Therefore, a model that can differentiate between impact magnitudes and assign varying weights is more appropriate. This study proposed a GRD-weighted SVM, where grey relational analysis was used to determine the similarity and correlation between various policy measures and natural resource status indicators, and further normalized these correlations to allocate weights, thereby achieving more refined impact predictions. Feature weighting is a data processing technique used to assign different weights to input features in machine-learning models, reflecting their importance for output predictions. In the SVM algorithm, feature weighting optimizes model performance by adjusting the influence of different features. The introduction of feature weighting enabled the model to capture the impact of policy changes on natural resource protection more accurately, particularly in situations with scarce or incomplete data. By appropriately allocating weights to each policy variable, the model can better predict the policy factors that play crucial roles in protecting natural resources.
The proposed algorithm effectively predicted the impact of various environmental policies on the status of natural resources. By calculating the GRD σu between each policy measure and environmental indicators, this method could assess the similarity between each policy measure and system characteristics. By normalizing these relational degrees, the weight q of each impacting factor was determined, thus adjusting the influence of each policy measure in the model to ensure that it more accurately reflected the actual impact relationships. The advantage of this model is that it not only captures the nonlinear relationships between policy changes and environmental responses, but also reduces unnecessary data dimensions, enhancing the accuracy and generalization ability of the predictions. The following formula provides the distance calculation between two sets of sample points: Au=(au1,au2,…,auv) and Ak=(ak1,akj2,…,ak v):

Assuming that the grey characteristic weight of the impact factor is qu, the calculation formula is as follows:

Let the feature weights of l impacting factors be Qu=(q1,q2,…,ql), and the weighted feature vectors be Au=qu(au1,au2,…,auv), Ak=qk(ak1,ak2,…,akv); then, the distance between the two sets of sample points can be calculated as follows:

The following formula provides a modified expression for the objective function:

The final expression of the feature-weighted SVM regression model is:

This model emphasizes the direct evaluation and optimization of policy effects in the field of natural resource conservation, making the formulation and adjustment of environmental policies more scientific and precise, and thus effectively supporting environmental management decisions. This approach not only becomes a powerful tool for environmental scientists and policymakers to analyze and predict policy impacts but also provides a practical solution for optimizing the implementation effects of policies.
The research methods proposed in this study demonstrated notable application value in natural resource protection policies, primarily because of their efficient ability to evaluate and predict under conditions of multi-factor complexity and uncertainty. By analyzing conditional probability relationships using Bayesian inference, this study revealed the dynamic interactions between environmental and policy factors, leading to more precise assessments of policy effects. The grey relational analysis-based weighted SVM algorithm accurately predicted the actual impact of policy changes on natural resources, enabling policymakers to assess the potential effects of various policy adjustments in different scenarios. Overall, these methods enhanced prediction accuracy and reliability, providing scientific decision support for the optimization and implementation of natural resource protection policies, which holds considerable practical significance.
Experimental results and analysisAnalyzing the conditional probability data under the influence of the two factors provided in Table 1 reveals the complex impact of various policies and environmental factors on natural resource indicators, such as forest coverage rate, water quality index, and wildlife population numbers. For example, the forest coverage rate and water quality index had a significant positive impact on wildlife population numbers, especially when both were in good condition (HHH), with a probability of wildlife population numbers of 0.9. Additionally, the positive impact of changes in legislation and regulations and the water quality index on wildlife populations was evident, particularly when both were good (HHH), with a probability of 0.8. These data indicated that specific policy combinations and environmental factors may considerably affect the optimization of specific natural resource indicators. From these data, the Bayesian inference method used to analyze the impact of natural resource conservation policies was shown to be highly effective. This method can comprehensively consider the effects of multiple factors and conditions, revealing the best or worst scenarios under different policy and environmental state combinations by calculating conditional probabilities. The data in the table can help identify the policy and environmental states under which the conservation of natural resources is most notable, such as the combined state of forest coverage rate and changes in legislation and regulations on pollution control policies (HHH), showing a high probability of 0.94, indicating that this combination is likely to bring about positive environmental effects.
Conditional Probabilities Under the Influence of Two Factors.
Table 2 provides the conditional probability data under the influence of four factors: public environmental awareness, forest coverage rate, pollution control policy, rainfall, and temperature. The table shows that when public environmental awareness, forest coverage rate, pollution control policy, and rainfall were good (for example, HHHH), the conditional probability associated with the forest coverage rate was extremely high (0.94), indicating that these factors have a significant positive impact on the forest coverage rate. Conversely, when all these factors were in a poor state (CCCC), the conditional probability of the forest coverage rate was close to zero (0), indicating an extremely negative impact. This pattern was also reflected in the impact on other natural resource indicators. For example, when pollution control policy and rainfall were good, the forest coverage rate and temperature are poor (HHCC), and the conditional probability for the forest coverage rate was 0.54, indicating complex interactions between environmental factors and policy measures. By considering multiple related factors, the Bayesian method provides policymakers with a powerful tool for assessing the effects of different policy combinations under specific environmental conditions. Additionally, the flexibility and inclusiveness of this method allow it to adapt to situations with high uncertainty, making policy analysis more comprehensive and precise.
Conditional Probabilities Under the Influence of Four Factors.
The data in Table 3 shows the conditional probabilities between various natural resources or policies under the influence of a single factor, reflecting the impact of different environmental factors and policy measures in "good" or "poor" states on other indicators. For example, when the pollution control policy was in a good state, its positive impact on the forest coverage rate was significant, with a conditional probability reaching 0.9; when the pollution control policy was in a poor state, the probability of forest coverage decreased to 0.6. The influence probability of good public environmental awareness on pollution control policy was 0.84, indicating a strong positive effect. This pattern continued across various data points, such as the positive influence probability of the regional development level on the establishment of protected areas (0.9) and its positive impact on pollution control policy (0.9), reflecting how a single factor under certain conditions can greatly affect related environmental or policy states. These experimental results effectively demonstrated the power and applicability of Bayesian inference in analyzing the impacts of natural resource conservation policies. Bayesian inference allows researchers to use known conditional probabilities to predict and assess the interactions and outcomes of different policies and environmental factors in specific states. Through this approach, policymakers and environmental managers can more precisely understand the specific effects of various measures and conditions in practical applications, allowing for more targeted strategy planning and adjustments. For instance, prioritizing the enhancement of public environmental awareness and implementing effective pollution control policies can considerably improve forest coverage and other related environmental indicators, thereby promoting the overall improvement of environmental quality.
Conditional Probabilities Under the Influence of a Single Factor.
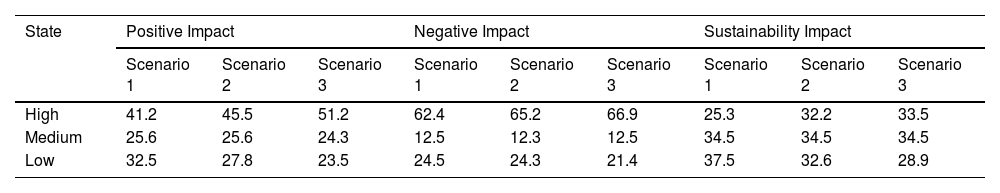
Table 4 shows the predicted values for the positive, negative, and sustainability impacts of policy adjustments on natural resource conservation across the three scenarios. The data indicate that as the scenarios progress from 1 to 3, the predicted values for positive impact gradually increase from 41.2 to 51.2, showing that policy adjustments under Scenario 3 have the greatest positive impact on natural resources. Conversely, the predicted values for negative impacts increased from 62.4 to 66.9 with the scenarios. This suggests that while increasing the positive impacts, there may be an increase in negative impacts. However, the impact on sustainability showed relatively steady growth across the three scenarios, from 25.3 to 33.5, indicating a gradual strengthening of policy sustainability in the future. This gradual enhancement may be due to the growing consideration of long-term environmental protection needs and strategic layouts in subsequent policy adjustments. The analysis of these data suggests that the comprehensive impacts of policy adjustments on natural resource conservation under different scenarios can be effectively predicted using a Bayesian inference-based and GDD-weighted SVM algorithm. Although Scenario 3 may potentially result in higher negative impacts in the short term, it offers more positive predictions from a long-term sustainability perspective. The application of this predictive model not only enhances the scientific basis and foresight of policy decision-making, but also helps policymakers to more comprehensively consider different environmental impact factors when formulating and adjusting conservation policies, thereby achieving sustainable management and protection of natural resources.
Comparison of Predicted Policy Adjustment Decision Metrics Across Three Scenarios.
From the data provided in Fig. 5, various prediction models (Least Squares Regression, PSO-SVM Model, ABC-SVM Model, CS-SVM Model, and the proposed model) show their strengths and limitations in predicting the values for a given test sample compared with the actual values. In most cases, all models could closely predict the trends of the actual values, although some errors were present. For example, at sample point 18, the actual value was 4, whereas the predicted values ranged from a low of 3.2 (PSO-SVM Model) to a high of 4.03 (CS-SVM Model). The proposed model generally produced predictions that were extremely close to the actual values, particularly at high data points (such as sample points 18 and 20), demonstrating good approximation ability and strong robustness in handling extreme values and data with high variability. The experimental results demonstrated the effectiveness and accuracy of this model in predicting the impact of natural resource conservation policies, particularly in handling complex data and nonlinear issues. Compared to traditional least-squares regression and other SVM variant models, this model was closer to the actual values at several key data points, reducing prediction errors and enhancing prediction accuracy.

Fig. 6 shows the absolute errors in the predicted values of the different forecasting models for the test samples, highlighting the accuracy differences of each model in predicting the actual values. The error distribution among the models showed some variability, with least squares regression, and the PSO-SVM model showed quite close error outcomes for most samples, such as samples 18 and 20, which were within a lower error range. However, the CS-SVM and ABC-SVM models exhibited considerably higher errors at some points, particularly the ABC-SVM Model at high-value points, such as samples 18 (error of 2.1) and 20 (error of 1). The model discussed in this study showed lower prediction errors for most data points, especially at mid-to-low value points close to the actual values, such as samples 2, 4, and 10, indicating high predictive accuracy in handling such data.

These experimental results demonstrate the effectiveness and reliability of the model discussed in this study in predicting the impact of natural resource conservation policies. In consistent low-error performance, the flexible use of the GDD-weighted SVM algorithm allows for more accurate processing and prediction of the specific impacts of natural resource conservation policies. This precise predictive capability not only helps policymakers better understand and evaluate the effects of conservation policies but also provides important data support for future policy adjustments and optimizations. Therefore, the model not only enhances the scientific nature of policy analysis in the field of natural resource conservation but also improves decision-making efficiency and effectiveness, demonstrating its broad application prospects and substantial practical value.
ConclusionThis study focused on the evaluation and prediction of the impacts of natural resource conservation policies using two advanced analytical methods: a Bayesian inference-based approach and a GRD-weighted SVM model. This study explored the interactions between various environmental and policy factors and their impacts on the state of natural resources using conditional probability analysis under dual-, four-, and single-factor influences. Subsequently, the effectiveness of the proposed method in practical applications was validated by simulating three different policy adjustment scenarios. Moreover, the actual values were compared with the predicted values from different forecasting methods, and the absolute errors of these methods were analyzed, thereby demonstrating the predictive accuracy and reliability advantages of the proposed model.
The theoretical and practical contributions of this study lie primarily in the innovative application of Bayesian inference and grey relational analysis, addressing the research gap in the evaluation and prediction of natural resource protection policies. First, from a theoretical perspective, the introduction of Bayesian inference facilitates multi-factor conditional probability analysis, dynamically updates assessments of policy impacts, and addresses the inadequacies in analyzing the interactions of complex environmental factors observed in existing studies. Second, the combination of grey relational analysis with weighted SVM innovatively addresses the challenges of feature extraction and weight allocation in scenarios of data scarcity and incompleteness, considerably enhancing prediction accuracy. In practical applications, these methods provide more precise decision support tools for natural resource protection policies, enabling effective long-term impact assessments, while offering scientific evidence for policy adjustments in complex and dynamic ecological environments. This advancement contributes to the optimization of policies and innovation in practice within this field.
The research findings indicate that these methods effectively handle multi-factor interactions and accurately predict the specific impacts of various policy adjustment scenarios on natural resources, thereby demonstrating their scientific and practical utility in policy assessment. This study contributes to the literature by providing a multi-dimensional analytical framework and high-precision predictive tools for complex natural resource protection issues that are of considerable theoretical and practical importance. However, the limitations of this study include its dependence on data and the sensitivity of the model to specific parameter settings, which may affect its broad applicability. Future studies should consider incorporating more real-time data and improving the robustness of the model to enhance its capacity for dynamic responses to policy changes, thereby better supporting decision-making in natural resource protection.
CRediT authorship contribution statementNina Xiao: Writing – review & editing, Supervision, Software, Funding acquisition, Formal analysis, Data curation. Xianhe Qu: Writing – original draft, Supervision, Methodology, Investigation, Formal analysis, Conceptualization.