


Independent inventors are considered important contributors to technological progress. However, empirical studies on individuals who retain the intellectual property rights in patented inventions are relatively scarce. This work analyzes a sample of more than 20k inventors who debuted between 1994 and 2017 and who filed at least one patent at the Italian Patent Office (UIBM) as independent: i.e., they were also the applicant/assignee. UIBM reports independent inventors’ national tax IDs, which allow identification of sex, date of birth, and place of birth. Inventors’ patent portfolios are reconstructed using their names and through filtering criteria to reduce the presence of false positives and negatives. The analyses confirm the presence of female underrepresentation (slowly declining), and sex-related differences in mean age and age distribution at the patenting debut. The dynamic process from independent to organizational inventor is then examined. Results of the survival analyses suggest that, ceteris paribus, female inventors are less likely to become organizational inventors than their male counterparts, while the role of age is negligible. However, within the subsample of inventors becoming organizational, female innovators transition more quickly, suggesting a potential selection effect that excludes many female patentees from pursuing their careers.
Innovation is fundamental to economic and social growth, yet its generation has become increasingly complex (Bloom et al., 2020). It is often described as a combinatorial process that draws on existing knowledge, organizational capabilities, and both technical and human capital (Bhaskarabhatla et al., 2021; Fleming, 2001). As scientific advancements demand more specialized expertise and larger teams (Hunter & Leahey, 2008; Wuchty et al., 2007), corporate laboratories have gained dominance since the early 20th century, when per capita inventiveness began to decline, and R&D required organizational investment (Lamoreaux & Sokoloff, 2011; Larivière et al., 2015). Despite this shift, independent inventors, often working solo or in small teams with limited resources, remain a significant source of technological progress. Their contributions, though quantitatively smaller, can be commercially viable, support technological trajectories, and in some cases surpass corporate innovations in impact (Amesse et al., 1991; Daemmrich, 2021; Dahlin, 2021; Dahlin et al., 2004; Hintz, 2011, 2021; Lamoreaux & Sokoloff, 2011; Lettl et al., 2009; Spear, 2006). These inventors, including startuppers, hobbyists, and practitioners, may scale their impact by leveraging resources in new ventures or established firms, complementing the work of large R&D teams and contributing meaningfully to science and technology.
The characteristics of independent inventors have so far been studied with limitations due to data availability, particularly the lack of demographic information in large empirical settings. This gap hinders the ability to assess the systematic exclusion of certain groups from innovation activities (Sarada et al., 2019). In addition, prior literature has not examined the individual-level dynamics of transitioning from independent to organizational (or dependent) inventor status.
In the context of independent inventions, patenting is not merely a technical activity; it serves as a gateway to economic opportunity and recognition in innovation systems. If some people are less likely to transition from independent to organizational inventorship due to demographic factors, this highlights inequalities in access to innovation ecosystems and may have negative societal impacts.
This study focuses on independent inventors, defined as individuals who file patents without listing any organization as the applicant. The reference sample comprises more than 23,000 independent inventors who filed patents with the Italian Patent Office (“Ufficio Italiano Brevetti e Marchi” - UIBM) between 1994 and 2017. Their demographic information is derived from the available tax identifier, which encodes each individual’s sex,1 date of birth, and place of birth. The patent portfolio of the selected inventors is reconstructed using their names and, where applicable, the organizations under which they filed. The reliability of the identification and selection process is supported by several manual checks that combine online searches with direct contact with the inventors.
The analysis of transition patterns provides a dynamic view of inventors’ careers, illustrating how innovation pathways unfold over time. Examining who enters the system, when, and how they progress yields insights into the potential to unlock and nurture inventive talent, as well as into bottlenecks in the innovation pipeline. Career trajectories developments are examined considering their sex and age, to contribute to the literature on several dimensions: not only regarding the characteristics of independent inventors, but also the gender gap in patenting and STEM fields (e.g.,: Lai, 2020; Lax Martinez et al., 2016), and patent productivity of inventors throughout their careers (Kaltenberg et al., 2023). First, the analysis of this sample of independent inventors offers new evidence on age distribution, sex representation, and patent productivity in a research context that has received limited empirical attention. Second, the analysis of career dynamics indicates that female inventors are less likely to obtain a subsequent patent within an organization. This lower transition rate among female inventors implies that society is missing out on a substantial contribution to innovation from these “unrealized female innovators.”
The article is organized as follows. Section 2 outlines the research framework. Section 3 describes the data processing procedures (with additional details provided in the appendix). Section 4 presents the characteristics of the sample, profiling independent inventors and highlighting sex- and age-related patterns in their careers. Section 5 concludes by linking the findings to the existing literature.
Independent inventorsAn inventor is considered “independent” when he or she owns the Intellectual Property (IP) rights of the patented invention; “dependent” or “organizational” when an organization (either the employer or a third entity) owns the IP rights at the time of filing (Dahlin, 2021; Guimarães et al., 2015; Nuvolari & Vasta, 2015; Spear, 2006), and it is therefore recorded as the applicant/assignee. The independent inventors may include students, unemployed individuals, those employed in their own or someone else’s company but patenting autonomously in the same or another technical field, hobbyists, practitioners or entrepreneurs with or without a clear startup project, lone garage inventors, or members of a community sharing a passion or interest related to the independent patent (Lettl et al., 2009).
Previous literature identifies several drivers behind the decision to patent independently, ranging from direct economic rewards through patent sales or licensing, consultancy, or entrepreneurship (Åstebro & Dahlin, 2005; Spear, 2006), to indirect recognition from peers, venture capitalists, or potential employers (Lerner & Tirole, 2003), and/or the intellectual challenge of solving a problem (Harhoff et al., 2003; Torrisi et al., 2016).
Independent inventors have played a significant historical role (Dahlin, 2021; Hintz, 2011). The literature has focused primarily on the United States, providing evidence of its substantial contribution to global technological development from the late 19th century to the early 20th century. During this period, inventive activity became democratized (Khan, 2005): independent inventors contributed more than organizational ones both quantitatively, i.e., with more granted patents (E. Dahlin, 2021), and qualitatively, i.e., with higher citation levels (Nicholas, 2010). Regarding the geographical focus of this study, two previous works are noteworthy for examining patenting and independent inventors in Italy during the same period: Domini (2020) and Nuvolari and Vasta (2015). As in the United States, the share of Italian patents by independent inventors was very high at the beginning of the 20th century, although their quality, measured by renewals, was lower than that of patents from organizations (Nuvolari & Vasta, 2015).
By the 1930s, the central role of independent inventors began to decline as companies and research organizations invested in R&D laboratories, where technical assets and teams of scientists and engineers supported innovation. Initially, independent inventors appeared to complement organizational innovation activities (Dahlin, 2021; Nicholas, 2010). Later, as anticipated by Schumpeter (2013), R&D activities conducted in large laboratories became the primary drivers of patenting (Lamoreaux & Sokoloff, 2011), although the role of independent inventors was never completely displaced (Dahlin, 2021; Hintz, 2011, 2021).
The universal trend in science and technology toward greater investment in resources and large teams stems from increasing complexity, the need to integrate highly specialized knowledge into broader systems, and the reliance on multiple business areas to bring innovations to market (Hunter & Leahey, 2008; Milojevic, 2014; Wuchty et al., 2007). Nevertheless, individual contributions remain relevant in small teams (Wu et al., 2019) and among independent inventors working with constrained resources (E. Dahlin, 2021; Nicholas, 2010). Dahlin (2021)) introduced the concept of complementarity between independent and organizational inventors.
Industrial R&D is the most frequent source of innovations due to its scale and capacity to manage scientific and technological complexity. However, U.S. data for 1963–2014 show that the number of independent patents has remained relatively stable, and there is evidence of a bi-directional positive externality between the two inventor types: independent inventors draw on the extensive technical knowledge developed by organizations, while their patents can unlock or accelerate technological trajectories. This notion aligns with the concept of innovation ecosystems: local communities in which diverse actors share resources and knowledge through a flywheel mechanism that drives innovation (Agrawal & Cockburn, 2003; Cooke, 1997; Etzkowitz & Leydesdorff, 2000; Jaffe et al., 1993; Marshall, 1920; Spigel, 2017). Within these ecosystems, practitioners, entrepreneurs, and hobbyists may file independent patents and contribute to subsequent innovations developed by companies or research organizations.
The technological impact of independent inventors is generally lower than that of corporate inventors (Lettl et al., 2009), but it is highly skewed. Studies of specific industries, such as tennis rackets (Dahlin et al., 2004) and medical devices (Lettl et al., 2009), show that the group is heterogeneous, including individuals who produce highly cited patents, in some cases outperforming organizational inventors. Similarly, analyses of the commercialization of independent inventions reveal significant skewness (Amesse et al., 1991; Spear, 2006): while performance is generally worse than that of company patents, typically designed to support firm sales, some independent inventions yield exceptionally high economic returns (Åstebro, 2003).
Previous literature confirms that independent inventors are not insignificant sources of innovation (Dahlin, 2021), although the primary impact, both in quantity and quality, comes from organizations (Lamoreaux & Sokoloff, 2011). Access to technical resources and assets, as well as participation in larger and more diverse inventor teams, are critical for technological development and patent productivity. The contribution of an independent inventor to innovative activities exceeds the output of the lone “garage” genius when he or she can flourish, namely, when endowed with greater resources and collaborating with peers. This typically occurs in an organizational setting, such as the R&D lab of an established corporation or a new venture founded by the inventor-entrepreneur, who secures funding to expand the activities, test prototypes, and integrate knowledge from colleagues. Hence, understanding the dynamics of independent inventors transitioning to organizational roles is essential. Barriers and filtering mechanisms that exclude groups of individuals for reasons unrelated to their inventive capabilities constitute an implicit constraint on the output of innovation.
Identification and characteristics of independent inventorsPrevious studies have employed diverse approaches to identify independent inventors and examine their characteristics. Some studies used local or national inventor associations to compile lists of individuals (e.g., Amesse et al., 1991; Ivančič et al., 2014), while others relied on patent repositories to analyze inventor and applicant/assignee fields (e.g., Dahlin, 2021; Nicholas, 2010). Inventor characteristics were determined through direct surveys (e.g., Åstebro, 2003; Mieg et al., 2012) or through secondary data and patentometrics (e.g., Dahlin, 2021; Lettl et al., 2009), with analyses conducted at either the individual or patent level.
The U.S. is the most frequently studied country (Daemmrich, 2021; Dahlin, 2021; Dahlin et al., 2004; Guimarães et al., 2015; Lamoreaux & Sokoloff, 2011; Lettl et al., 2009). A few studies have focused on other countries, including Canada (Amesse et al., 1991; Åstebro, 2003), Italy (Nuvolari & Vasta, 2015; Schettino et al., 2013; Sirilli, 1987), Germany (Mieg et al., 2012; Zwick et al., 2017), the United Kingdom (Spear, 2006), and Slovenia (Ivančič et al., 2014). In addition to analysis of historical data between the 19th and early 20th centuries (Domini, 2020; Lamoreaux & Sokoloff, 2011; Nuvolari & Vasta, 2015), the most frequently examined periods spans 1980 to 2010 (Amesse et al., 1991; Åstebro, 2003; Dahlin et al., 2004; Guimarães et al., 2015; Ivančič et al., 2014; Lettl et al., 2009; Schettino et al., 2013; Sirilli, 1987; Spear, 2006; Zwick et al., 2017), while only Dahlin (2021)) has focused on data after 2010.
The presence of independent inventors appears to vary across time and countries, but comparisons are challenging due to differences in measurement approaches. Patent-level data for the U.S. indicate an average of 11 % independent granted patents between 2006 and 2019 (Dahlin, 2021), 14 % in medical devices from 1980 to 2005 (Lettl et al., 2009), and 65 % in the tennis racket industry (Dahlin et al., 2004). Shares of independent patents in other countries include approximately 40 % in Slovenia in 2007 (Ivančič et al., 2014) and in Canada in 1986 (Amesse et al., 1991). Person-level measures indicate 40 % of inventors in Italy’s Marche region were independent in 1981 (Sirilli, 1987) and 2 % in Germany, based on a sample of 1700 inventors who applied for European patents between 2004 and 2008 in the cleantech and mechanical fields.
Independent inventors enjoy greater freedom in developing inventions because they are not constrained by a company’s need to solve a specific problem and ultimately commercialize the results of R&D effort (Lettl et al., 2009). This openness yields a more diverse base of prior knowledge than that of corporate inventors, potentially favoring breakthrough inventions (Lettl et al., 2009). Such diversity is expected to foster a stronger tendency to think outside the box (Dahlin et al., 2004) and to be free from traditional industry schemes (Lettl et al., 2009).
These observations align with the findings of Amesse et al. (1991), who reported that Canadian independent inventors are, on average, highly experienced and educated, and with the psychological analysis by Mieg et al. (2012), which found that German independent inventors exhibit higher levels of extraversion and openness to experience than non-inventors. However, according to the model developed by Kobayashi and Yu (1993), inventors with a high index of inventive ability are more likely to be affiliated with organized research.
Conversely, independent inventors face resource constraints that limit their activities more than organizational inventors do. This limitation becomes particularly detrimental when complexity and depth create a knowledge and technical load that cannot be managed by individuals without organizational support (Lettl et al., 2009). Furthermore, enforcement costs are generally more burdensome for independent inventors than for organizational ones.
Sex differences and career in patentingPatenting activities are generally dominated by male inventors relative to female inventors (Heikkilä, 2019; Lax Martinez et al., 2016). For instance, the share of patents granted to female inventors in the U.S. rose from less than 4 % at the end of the 19th century to 6.5 % by 1940 (Sarada et al., 2019). Current studies indicate that at the USPTO and EPO, the share of female inventors is approximately 13 % (Tahmooresnejad & Turkina, 2022; USPTO, 2020). The few studies focusing on independent inventors show that they were almost all men during the 1970s-1980s, with estimates ranging from 89 to 99 % (Amesse et al., 1991; Åstebro, 2003; Sirilli, 1987).
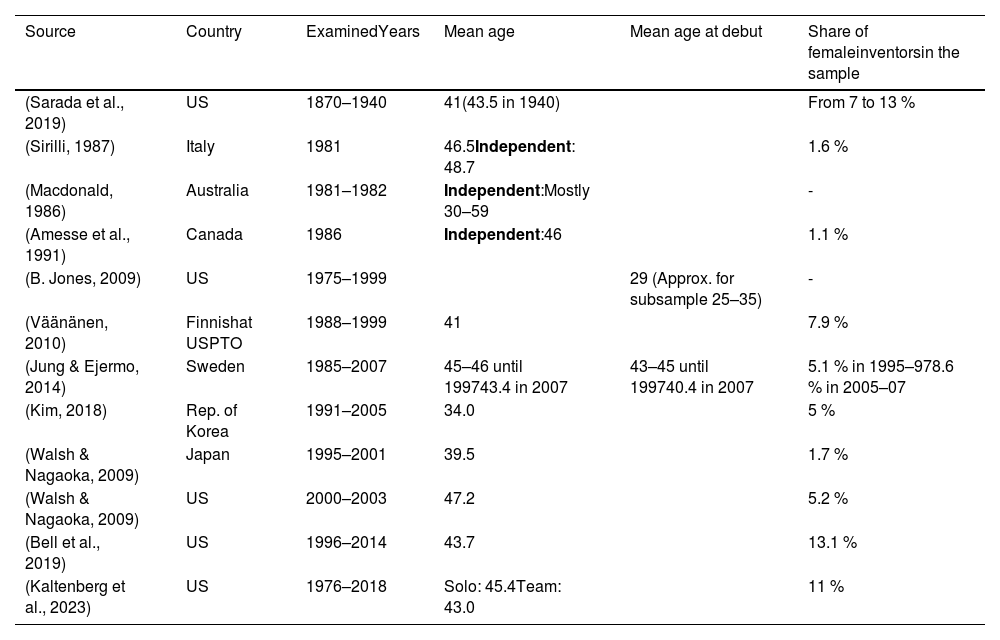
Regarding age profiles, previous studies generally suggest that intellectual productivity peaks between ages 30 and 40 (Dennis, 1956, 1958), with variations across disciplines. However, the presence of older contributors has increased globally in recent years, owing to the extended time required to acquire the human capital necessary for invention and the growing complexity of science and technology (Bloom et al., 2020; Jones, 2009; Kaltenberg et al., 2023). Most studies on patenting report an average inventor age of 40–45 years, as summarized in Table 1. Few studies have calculated the age at first patent (hereafter referred to as the “debut” date), typically approximated using the earliest priority filing or by linking patent data to external sources. Jung and Ejermo (2014) identified a gender difference: the average age of female inventors is more than four years lower than that of male inventors. However, the gap has narrowed over time.
Summary of selected studies reporting inventors’ age.
| Source | Country | ExaminedYears | Mean age | Mean age at debut | Share of femaleinventorsin the sample |
|---|---|---|---|---|---|
| (Sarada et al., 2019) | US | 1870–1940 | 41(43.5 in 1940) | From 7 to 13 % | |
| (Sirilli, 1987) | Italy | 1981 | 46.5Independent: 48.7 | 1.6 % | |
| (Macdonald, 1986) | Australia | 1981–1982 | Independent:Mostly 30–59 | - | |
| (Amesse et al., 1991) | Canada | 1986 | Independent:46 | 1.1 % | |
| (B. Jones, 2009) | US | 1975–1999 | 29 (Approx. for subsample 25–35) | - | |
| (Väänänen, 2010) | Finnishat USPTO | 1988–1999 | 41 | 7.9 % | |
| (Jung & Ejermo, 2014) | Sweden | 1985–2007 | 45–46 until 199743.4 in 2007 | 43–45 until 199740.4 in 2007 | 5.1 % in 1995–978.6 % in 2005–07 |
| (Kim, 2018) | Rep. of Korea | 1991–2005 | 34.0 | 5 % | |
| (Walsh & Nagaoka, 2009) | Japan | 1995–2001 | 39.5 | 1.7 % | |
| (Walsh & Nagaoka, 2009) | US | 2000–2003 | 47.2 | 5.2 % | |
| (Bell et al., 2019) | US | 1996–2014 | 43.7 | 13.1 % | |
| (Kaltenberg et al., 2023) | US | 1976–2018 | Solo: 45.4Team: 43.0 | 11 % |
Kaltenberg et al. (2023) conducted an in-depth analysis of the age of U.S. inventors from 1976 to 2018, finding an average age of 43–45 years. No recent data are available for the specific subsample of independent inventors. Earlier studies report a mean age of 46 (Amesse et al., 1991) and 48.7 (Sirilli, 1987), both higher than that of organizational inventors; Macdonald (1986) reports that 70 % fall between ages 30 and 59.
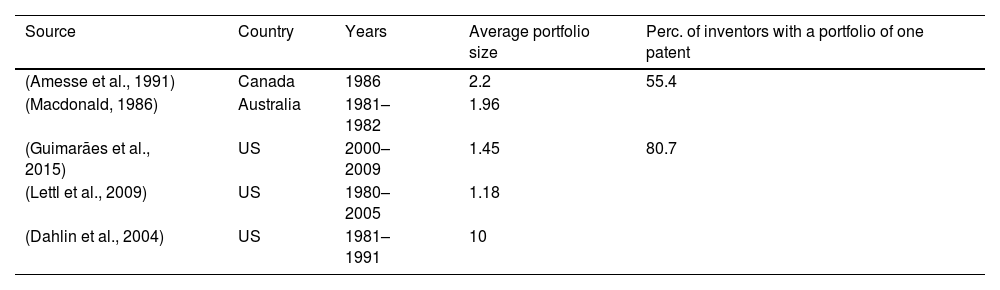
Studies of inventors’ productivity (without accounting for independence) reveal an inverted-U shape, with a peak in the late 30 s to early 40 s (Bell et al., 2019; Jones et al., 2014; Schettino et al., 2013; Väänänen, 2010). This pattern is typically explained by human capital accumulation early in the life cycle and a decline in incentives and inventive ability at later career stages. The median patent portfolio of an inventor consists of only one patent (Schettino & Sterlacchini, 2009; Väänänen, 2010). Focusing on independent inventors, most studies report that most hold a single patent, with an average portfolio size of 1.1–2.2 (Table 2). A strikingly different result, a mean portfolio size of 10, is reported by Dahlin et al. (2004) in their study of 225 patents in the tennis racket industry; however, the authors note that inventors classified as independent in this sector were simultaneously organizational in other industries.
Summary of literature on patent portfolios of independent inventors.
| Source | Country | Years | Average portfolio size | Perc. of inventors with a portfolio of one patent |
|---|---|---|---|---|
| (Amesse et al., 1991) | Canada | 1986 | 2.2 | 55.4 |
| (Macdonald, 1986) | Australia | 1981–1982 | 1.96 | |
| (Guimarães et al., 2015) | US | 2000–2009 | 1.45 | 80.7 |
| (Lettl et al., 2009) | US | 1980–2005 | 1.18 | |
| (Dahlin et al., 2004) | US | 1981–1991 | 10 |
Studies on gender and IP underscore that disparities in patenting are linked to multiple factors. The share of women declines at each educational and career stage in STEM fields, a phenomenon often described as the “leaky pipeline” (Blickenstaff, 2005). Horizontal segregation across fields of study and industrial sectors is driven by cultural norms and expectations that steer men toward technical and operational roles (Bettio & Verashchagina, 2009; Puuska, 2010). These dynamics are compounded by women’s more limited access to networks, mentorship, and financial resources that facilitate patenting (Caviggioli et al., 2022). Moreover, IP law frameworks have historically been shaped by male-dominated norms, which continue to influence who is recognized as an inventor (Lai, 2020a, 2020b; 2021), with women often rendered invisible in patent records not because they are absent from innovation, but because their contributions are systematically excluded or silenced due to attribution biases (Swanson, 2024).
Regarding independent inventors, the literature provides insufficient information on sex and age profiles and related career dynamics. The greater freedom enjoyed by independent inventors is expected to correlate with non-negligible female participation, making this an interesting context for exploring career trajectories and sex-related differences. This study focuses on inventors’ transitions to organizational roles, that is, cases where individuals debut as independent inventors and subsequently patent as employees within an organization. Such transitions are hypothesized to be less likely for female than for male inventors, due to factors associated with both actors: companies and inventors themselves.
On the company side, sectors that rely on patenting to innovate are gendered: firms tend to prefer hiring male inventors and often exclude female contributions (Lai, 2020a; Mayer & Rathmann, 2018; Wullum Nielsen & Börjeson, 2019). Additionally, female entrepreneurs face greater obstacles in launching ventures and securing funding to commercialize patented technologies (Balachandra, 2020; Greene et al., 2001). On the inventor side, cultural and psychological traits suggest that women are more likely to abandon inventive activity than men: female individuals tend to avoid competition (Niederle & Vesterlund, 2007; Shastry et al., 2020; Thaler, 2021), and are more prone to disillusionment following negative early-career experiences (London et al., 2012).
In terms of age, an earlier patent debut as an independent inventor is expected to be associated with a higher likelihood of filing a subsequent organizational patent. This is not only because of the longer time at “risk” of becoming an organizational inventor; debut age may also reflect individual characteristics. An early debut suggests the inventor is near the productivity peak, whereas a later debut may be more common among hobbyists or practitioners developing inventions in their spare time. Younger inventors are therefore more likely to become entrepreneurs or employees, as employers tend to favor them for their creative potential and lower salary expectations.
ItalyThis study leverages a distinctive feature of Italian patents to identify the sex and age of independent inventors. Beyond the availability of such data, Italy offers a handy setting for several reasons. Focusing on a single country helps minimize asymmetries caused by differing national innovation policies, which can distort statistical comparisons in cross-country analyses and may vary over time. At the same time, Italy exhibits substantial internal heterogeneity, especially between northern and southern regions. These differences are historically rooted (Felice, 2018) and encompass institutional, social, and cultural dimensions (Bigoni et al., 2019; De Santis et al., 2021). Specifically, southern regions display lower values across various measures of industrial productivity (Di Giacinto et al., 2014; Felice, 2018), as well as in innovation and R&D (Cowan & Zinovyeva, 2013; Medda et al., 2004). Italian regions also differ in gender gap indicators, as shown by Alaimo and Nanni (2018), with nearly all regions exhibiting the largest gaps in southern Italy (including the islands). Similar patterns emerge regarding gender stereotypes about family roles, society, and labor: central-northern regions tend to reject such stereotypes, whereas they remain deeply entrenched in the South (Ostuni et al., 2022). Finally, while generalizing results from this empirical setting requires caution, the presence of measurable intra-national heterogeneity provides a basis for conducting robustness checks in the empirical analysis.
Data collection and processingData were collected from the Italian Patent Office (“Ufficio Italiano Brevetti e Marchi” - UIBM) website.2 The retrieved information on Italian patent applications and granted documents covers filing years from 1994 to 2017. When one or more inventors are also listed as applicants/assignees, the system reports the Italian tax identifier, i.e., “Codice fiscale”, of the individual: a 16-character alphanumeric string that allows unequivocal identification of sex at birth, birth date, and place (further details in the Appendix). More than 90,000 patents (approximately 40 % of all available patents) include at least one inventor’s tax ID, corresponding to a total of slightly more than 50,000 unique IDs. The share of such patents remains relatively constant throughout the study period (Fig. 1).

The complete portfolio of each inventor is required to determine the date of the first independent and organizational patent. An individual’s portfolio is identified when the inventor’s first and last names match exactly.3 Because this process cannot fully resolve homonymic ambiguity, the sample was reduced to a subset of inventors using several exclusion criteria. The filtering process aimed to: i) minimize potential selection biases in key dimensions—sex, age, debut year, and timing of the first organizational patent; ii) ensure high accuracy in portfolio identification, capturing all filings by an individual while avoiding the mixing of different persons with identical names. Details on the sample selection process (7.1), manual accuracy tests (7.2), and the identification and exclusion of university patents to avoid cases of the “Professor’s privilege” are provided in the Appendix (7.3).
This method offers advantages over approaches based on name tokenization, probabilistic matching, and sex identification from first names (e.g., Li et al., 2014; Pezzoni et al., 2014): i) sex, date, and place of birth are recorded rather than estimated, eliminating ambiguity when the same name is used by both sexes and providing exact age; ii) first and last names are recorded without spelling variations or errors, and name variants for the same inventor are extremely rare; iii) female inventors are identified by their maiden surname. The main limitation is the inability to exclude homonymic errors during portfolio reconstruction fully. However, random tests support the approach's reliability, particularly for the dimensions of interest (see Appendix).
Data processing produced a final sample of 23,617 inventors who filed their first Italian patent between 1994 and 2017. Their combined portfolio comprises >48,000 patents (22 % of all filings recorded in UIBM during the same period). This sample is not representative of the entire population of Italian inventors, as it focuses on those who filed at least one independent patent. Because sex and age data are unavailable for organizational inventors who have never independently patented, a direct comparison between the two groups is not possible.
The definition of a “dependent” inventor is operationalized by classifying an inventor as organizational when the list of assignees includes an organization (i.e., any company). As noted, patents involving universities or research centers were excluded, resulting in the exclusion of 568 individuals (2 %). Although identification strategies differ, for comparison, Amesse et al. (1991) reported that 13 % of Canadian inventors were academics in their 1986 survey. In contrast, Zwick et al. (2017) found 4 % among German inventors in the cleantech and mechanical industries. The main drawback of this exclusion is the omission of cases where company inventors collaborated with universities. Further details on university patent identification (7.3) and related limitations are provided in the Appendix.
Tax IDs also included the place of birth at the city level. Data were geolocated to Italian regions, with an additional category for individuals born outside Italy.4
In addition to demographic characteristics, this study examines the dynamics of independent inventors transitioning to organizational roles. The classification follows Dahlin (2021)), who defined four scenarios of independence dynamics for two consecutive patents by the same inventor: independent-independent, independent-organizational, organizational-organizational, and organizational-independent. Similarly, this study defines patterns at the individual level by whether inventors remain independent. The categories in this empirical setting are:
- •
Always independent inventors: Filed one (I) or more patents as independent (I-I), with no organizational patent observed during the study period. This group includes “one-shot inventors.” Their inventions are less likely to become fully developed innovations or achieve large-scale commercialization. Individuals in this group may exhibit lower inventive propensity or entrepreneurial orientation, may have faced life events preventing employment as inventors (even in their own ventures), or may have produced inventions that did not lead to subsequent business-related innovations.
- •
I-O inventors: Inventors who began with an independent patent and later filed at least one patent for an organization. These individuals may include entrepreneurs who founded their own companies or inventors hired by or collaborating with firms, transferring IP rights to those organizations.
- •
O-I inventors: Inventors who started patenting for an organization and later filed an independent patent. This group may include inventors who leverage their expertise in their field or apply it to another technical domain (e.g., through collaboration, hobbies, or passions outside their work). The independent patent could represent the first step toward a new venture or an attempt to secure a licensing agreement, whether successful or not.
- •
Organizational inventors: Although inventors who patented exclusively under an organization throughout their careers are not part of the focal sample, a small group with no independent patents was identified (details in Appendix). For this group, sex can be inferred from names, but tax codes are unavailable, meaning birth date and place cannot be determined. We distinguish between O and O–O inventors, depending on whether their portfolio includes one or multiple patents.
From the collected data, patentometrics indicators of inventive output quality were calculated to provide context and robustness checks: grant rates, maintenance duration, and renewal expenditures in euros5 (van Zeebroeck, 2011). These measures were computed to assess patent quality prior to transitioning into an organizational inventor role.
Analyses and resultsProfile of independent inventorsThe 23,617 individuals examined are pretty evenly distributed by debut year, averaging approximately 1150 new inventors per year. Female inventors represent 13.2 % of the sample, with an upward trend from 8.9 % in 1994 to 16.1 % in 2017 (Fig. 2). This pattern aligns with global findings, both in overall share and in the increasing representation of women in patenting (Caviggioli et al., 2022; Tahmooresnejad & Turkina, 2022; USPTO, 2019).
 and share of female inventors (right axis) by debut year.")
The average age at debut in the sample is 43.1 years. Female inventors, on average, file their first patent earlier than men, at 41.0 years versus 43.5 years (t-test of the difference is statistically significant). This finding is consistent with the results reported by Kaltenberg et al. (2023). Fig. 3 illustrates that the debut age for both male and female inventors has increased over time, with the latter rising more rapidly, thereby narrowing the gap between the two sexes.

Fig. 4 displays the estimated kernel density of male and female inventors by debut age across the entire sample. On average, the relative share of female inventors debuting before age 35 is higher than that of males, whereas the opposite pattern emerges for those debuting after age 50. Between approximately ages 32 and 45, female debutants appear underrepresented. This may be related to childbirth, which can reduce the propensity to patent during these years; in the observed time window, the mean age of mothers in Italy increased from 28 to 32.6

To identify trends, Figs. 5 and 6 present the share of male and female inventors at debut across different age groups, calculated as a three-year moving average. The first figure focuses on the earliest life stages: values in 2017 are lower than in 1996, indicating a decline in the representation of young debutants. The share of inventors debuting before age 25 remains relatively constant for males (around 5 %), whereas it decreases for females and converges with the male share by 2017. For the 25–34 age group, trends differ by sex: both started near 25 %, but the male share declined steadily and fell below 20 % after 2010, whereas the female share rose to 30 % by 2009 before dropping below its initial level in recent years. The share of inventors debuting between ages 35 and 44 shows similar patterns for both sexes: a gradual increase from 28 % to about 32 % until 2008, followed by a decline to 25–27 % in 2017.
 and female inventors (dotted lines). Values calculated as a three-year moving average.")
 and female innovators (dotted lines). Values calculated as a three-year moving average.")
Fig. 6 plots the shares for the later age groups. Overall, the data suggest a shift toward later stages of the career, driven primarily by an increase in debutants aged 45–64, with the most significant growth observed among female inventors (ages 45–54, rising from 17 % to 27 %; ages 55–64, from 9 % to 13 %). The distribution of debut age over time and across sexes (Fig. 7) shows that female inventors are generally more represented up to ages 35–40 and less represented after age 50. However, over the last two periods, particularly in recent years, the distribution of female inventors has shifted closer to that of males, though with a notable anomaly around age 35: women are overrepresented before age 35 and underrepresented in the following decade.

Whenever available, IPC codes were retrieved from patents and linked to the 35 WIPO fields using the WIPO concordance Table.7 Note that some patent documents do not report any IPC code; therefore, at least one technical field of activity could be identified for only 85 % of inventors.8
Table 3 reports demographics for two subsamples: inventors born in southern regions, Sardinia, or Sicily (21.8 %), and those born elsewhere in Italy (or abroad). The proportion of female inventors is not statistically different between these groups, whereas the mean debut age differs slightly by less than one year.
Career typesAll inventors in the sample have filed at least one independent patent during the study period, by construction (i.e., they are listed as assignees and their tax IDs are reported). Inventors have different debut years, meaning they are exposed to the “risk” of filing a new patent, either organizational or independent, over varying time horizons. The following paragraphs report basic statistics for the full sample, regardless of time at risk; the hazard will be addressed in the subsequent survival analysis.
Inventors are classified by their transition status into the following groups: always independent inventors (no organizational patent observed during the study period), subdivided into those with only one patent (“I”) and those with more than one (“I-I”); “I-O”: inventors debuting with an independent patent and later filing an organizational one; “O-I”: inventors debuting with an organizational patent followed by an independent one.
The largest group consists of inventors who never filed an organizational patent (87.4 %). This includes those with only one patent (I: 68.7 %) and a smaller fraction with multiple patents (I-I: 18.6 %). Among inventors with at least one organizational patent, nearly half debuted with an independent filing (I-O: 6.9 % of the sample), while the other half debuted organizationally (O-I: 5.8 %).
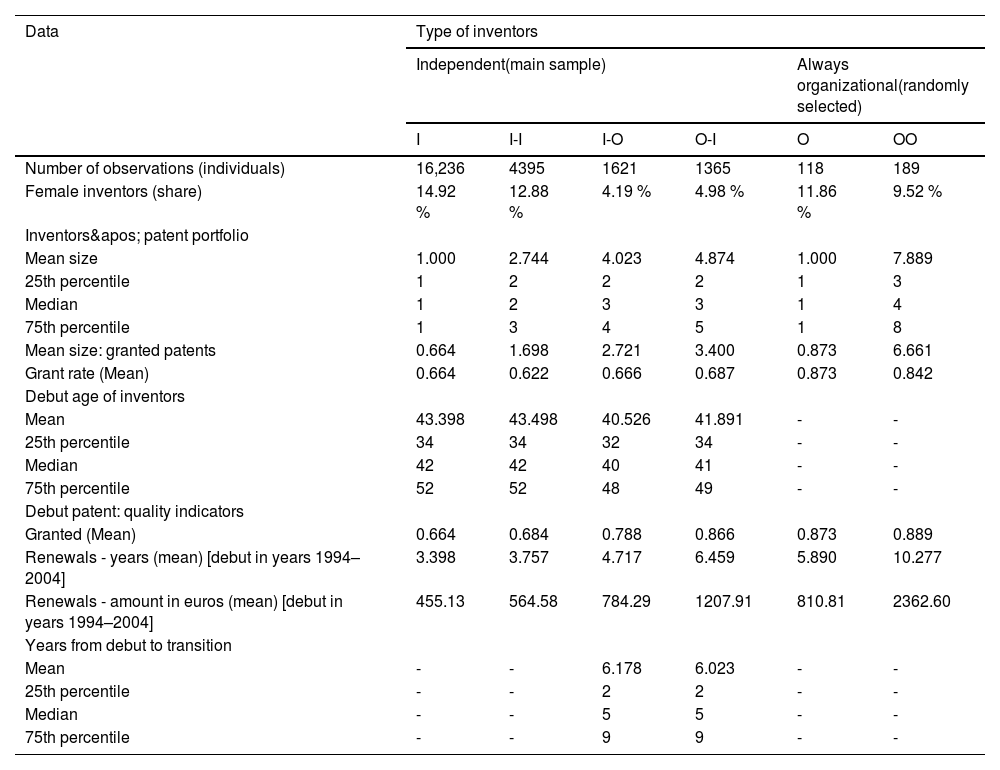
Table 4 reports descriptive statistics for the entire sample. The average time to switch status is similar in both directions: 6.2 years for I-O and 6.0 years for O-I (a difference of less than five months). Average portfolio size is larger for inventors who transition, and this difference is not solely due to group construction (I-O and O-I types have at least two patents by definition). For example, independent inventors with multiple patents (I-I) have a mean portfolio size of 2.7, whereas the I-O and O-I groups have portfolios averaging more than four patents. Debut age also differs: 40.6 years for I-O, 41.9 for O-I, and approximately 43.4 for both independent groups. The comparison between independent inventors and I-O is notable: those transitioning to organizational status file their first patent almost three years earlier than those who remain independent. The most striking result concerns female representation: it is much lower among transitioning inventors (I-O or O-I). This difference does not appear to be driven by portfolio size: among inventors with at least two patents, the female share in the I-I group is 12.9 %, which remains substantially higher than in the I-O and O-I groups.
Mean values and key percentiles for inventor characteristics: independent inventors (by transition status) and always-organizational inventors (with one or more patents).
To contextualize these findings, a random sample of inventors who were always organizational during the study period was constructed. This group includes 307 inventors who never filed an independent patent (details in the Appendix). “O” inventors have only one patent, while “OO” inventors have more than one. Female representation is lower among organizational inventors (O or OO: 10.4 %) than among independent inventors (I or I-I: 13.7 %). Overall, the results suggest that female innovators are more likely to appear among independent inventors than among companies, particularly when considering those who transition (I-O or O-I).
Variables describing the quality of inventive output, such as grant rates, renewal duration, and renewal investment, show differences across career types. At the portfolio level, grant rates are higher for organizational inventors than for independent ones, including I-O and O-I inventors, who exhibit slightly higher rates than consistently independent innovators. Focusing on debut patents, both grant rates and renewal-based indicators (duration and monetary value) reveal clear distinctions: always-independent inventors display the lowest average patent quality, while more nuanced differences emerge among I-O, O-I, and consistently organizational inventors. Transitioning inventors (I-O and O-I) are associated with higher average quality than those who remain independent, but lower quality than consistently organizational inventors. These aggregate differences are partly explained by resource availability, generally greater for organizations, and by selection mechanisms through which independent inventors either establish ventures or are hired by companies (becoming I-O). Organizational inventors typically have superior financial and informational resources, not only for equipment but also for hiring experienced patent attorneys, which can influence drafting and prosecution and ultimately affect grant rates and renewal decisions (Klincewicz & Szumiał, 2022).
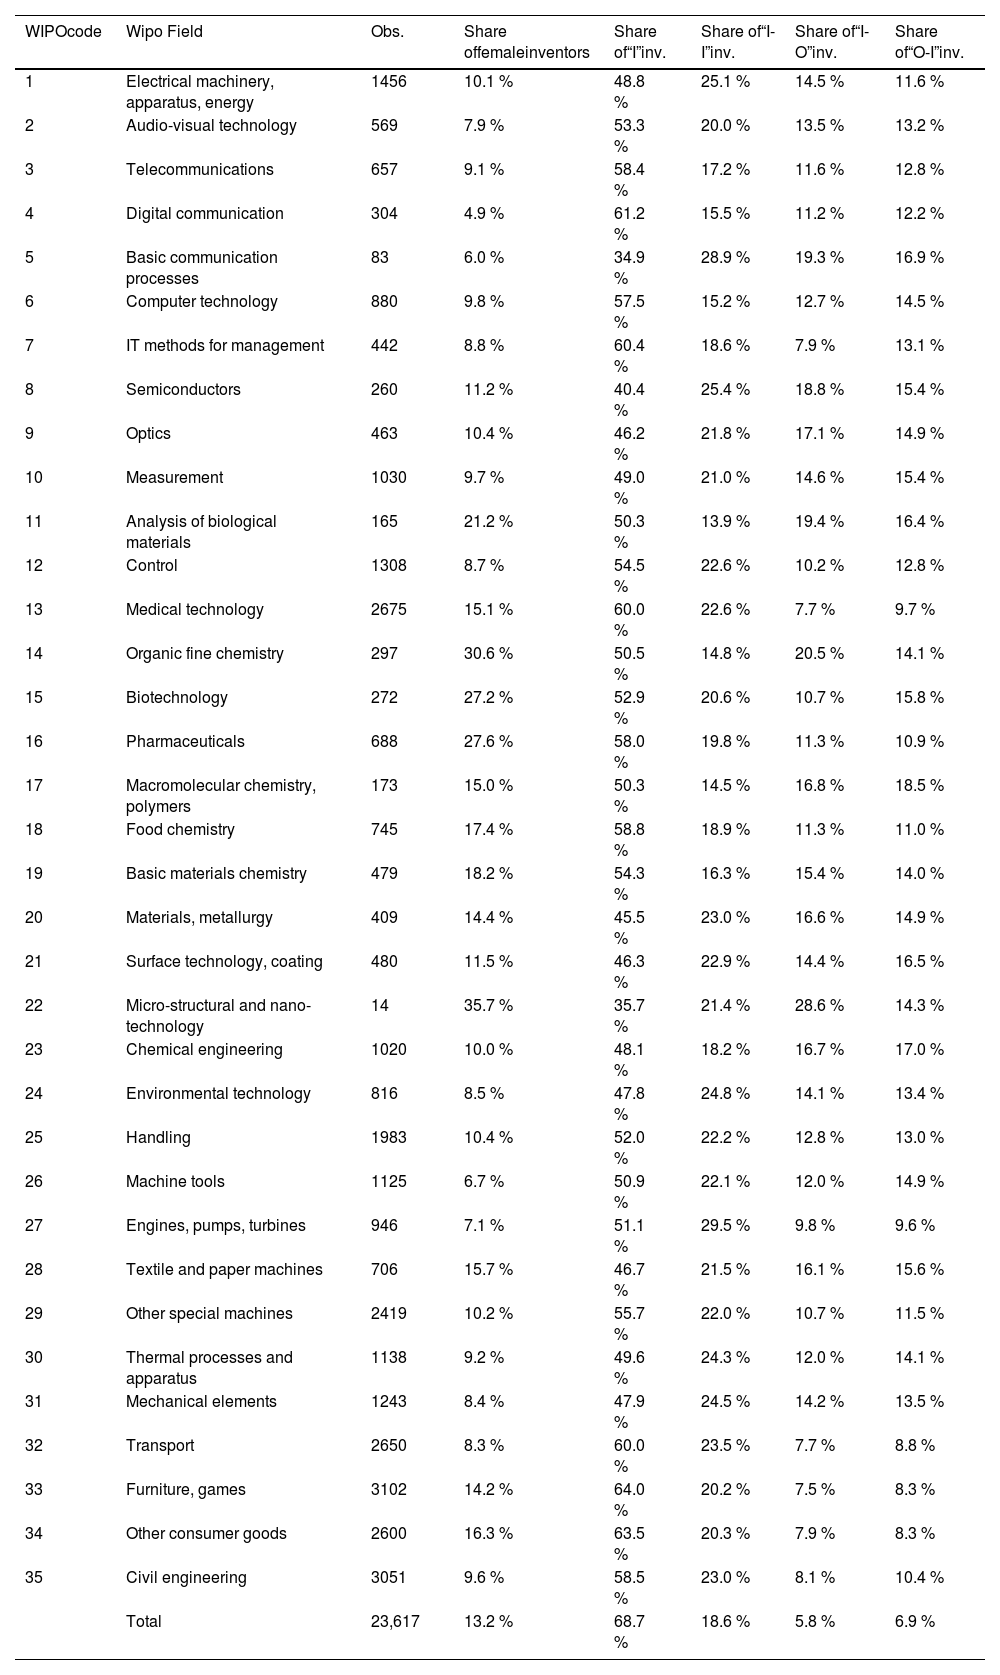
Table 5 presents descriptive statistics for the first ten years following patenting debut, disaggregated by the 35 WIPO technical fields. It highlights sector-specific patterns across independent and organizational inventors. Female representation aligns with prior literature identifying gendered fields and sectors in patent data (Caviggioli et al., 2022; Mayer & Rathmann, 2018; Wullum Nielsen & Börjeson, 2019). Fields with the highest share of female inventors (above 20 %) include “Micro-structural and nano-technology”, “Organic fine chemistry”, “Pharmaceuticals”, “Biotechnology”, and “Analysis of biological materials”. Fields with the lowest female share (below 8 %) include “Audio-visual technology”, “Engines, pumps, turbines”, “Machine tools”, “Basic communication processes”, and “Digital communication”. This distinction will also be used in robustness tests to account for technological field-specificities.
Main characteristics of the sample by WIPO 35 technical fields: share of female inventors, always-independent inventors (both single-patent and multi-patent), and inventors transitioning between independent and organizational status.
The five fields with the highest share of I-O inventors include some with high female representation (“Micro-structural and nano-technology”, “Organic fine chemistry”, “Analysis of biological materials”) and others with low female representation (“Basic communication processes”, “Semiconductors”). Fields in which I-O transitions are less frequent include “IT methods for management”, “Other consumer goods”, “Medical technology”, “Transport”, and “Furniture, games”, in which female shares range from 8 % to 16 %. This heterogeneity underscores the need for multivariate analyses incorporating dummy variables for technical fields as controls.
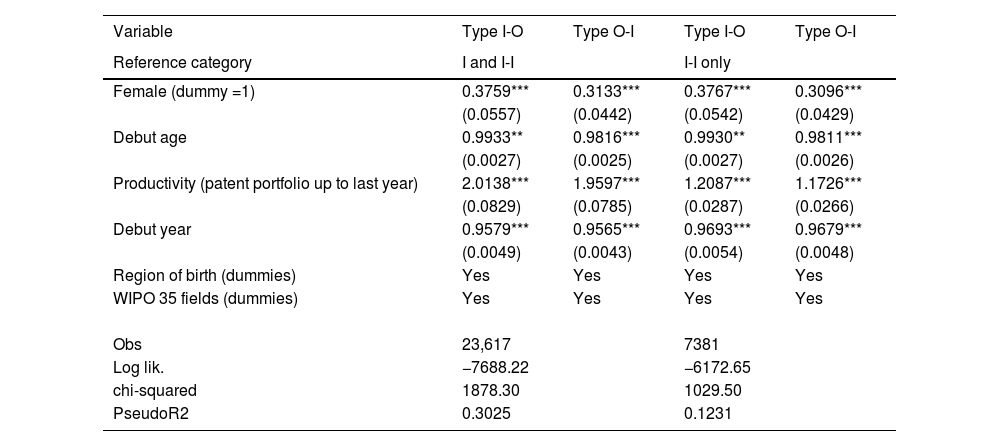
Demographic comparisons across career types are first conducted using multinomial logit models. These models simultaneously account for sex, age, total productivity, and debut year, while also controlling for birth region and technical field. Table 6 reports relative risk ratios, with always-independent inventors (I or I-I) as the reference category in the first two columns and the I-I group in the last two. The second set of models is restricted to inventors with portfolios of at least two patents. Results are very similar to those for the full sample, suggesting robustness.
Results of multinomial logit models: the first two columns consider type I or I-I as reference; the last two columns use the I-I type only. Relative risk ratios are shown.
Robust standard errors are in parentheses. *** p < 0.01, ** p < 0.05, * p < 0.10.
The I-O group appears broadly similar to the O-I group, but both differ significantly from always-independent inventors. Female inventors are markedly underrepresented among transition types (I-O or O-I) compared to I and I-I groups: the female dummy variable is 62–69 % less correlated than in the I group. Debut age differences are statistically significant but small: transition inventors are about 1 % younger than those in I or I-I types (roughly five months younger on average). Finally, the average productivity of always-independent inventors is lower than that of other groups, even when the analysis is restricted to inventors with at least two patents.
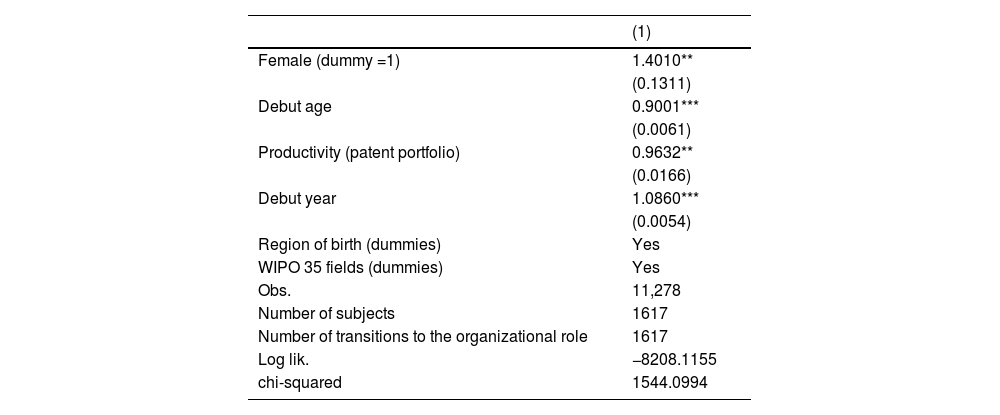
Role of sex and age in the transition to organizational inventorsTo account for differences in observation periods across individuals, a set of Cox proportional hazards models9 (Cox, 1972) is used to analyze the time to transition to the organizational inventor role. The hazard is assumed to be:

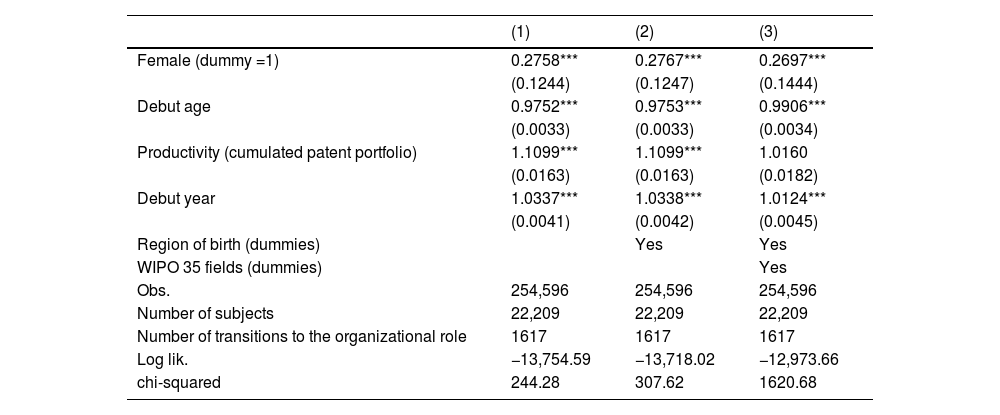
The Cox proportional hazards model estimates the baseline cumulative hazard H0(t), the baseline survivor function, and the coefficients βi for the regressors xi. The sample comprises 22,209 inventors whose first patent was independent.10 The first subsequent organizational patent represents the “failure” event. For inventors who transition to organizational status, the failure event is observed (“non-censored” individuals); for others, no organizational patent is observed within the study period (“right censored”).11 The survival-time data have the following characteristics: 1617 failures in single-failure-per-subject data, 254,596 total analysis time at risk and under observation (i.e., the sum of years during which the individuals are observed and at risk of experiencing the failure event). Model specifications are tested using standard errors clustered at the individual level to account for within-group correlation.
Results are reported in Table 7. All else equal, being female is associated with a significant delay in becoming organizational, or, in other words, a significant decrease in the likelihood of filing an organizational patent (−73 % in model 3). Corresponding sex-specific survival functions are plotted in Fig. 8 (Appendix). On average, an increase of one year in debut age is associated with a risk reduction of approximately 1–2 %. Productivity (measured as yearly cumulative patents) is positively associated with the filing of an organizational patent. Each additional patent is associated with an 11 % increase in the likelihood of observing the failure event in Models 1 and 2. However, this coefficient is not statistically significant in Model 3 (p-value = 0.384) when sector dummies are included, suggesting that these controls absorb differences in portfolio size.
Results of survival analysis using proportional hazards models via maximum likelihood. Filing of the first organizational patent is the “Failure” event. Analysis time starts at age 15. Sample: all inventors debuting with an independent patent.
Standard errors are clustered on individuals (in parentheses). *** p < 0.01, ** p < 0.05, * p < 0.10.
. “Failure” indicates filing of the first organizational patent. Analysis time starts at age 15.")
Survival functions for female and male independent inventors (Model 3, Table 6). “Failure” indicates filing of the first organizational patent. Analysis time starts at age 15.
This section reports results from additional analyses designed to provide robustness checks for baseline Model 3 in Table 7, focusing on specific subsamples and introducing further variables.
The first test examines the subsample of inventors who filed at least two patents by the end of the study period (Table 17 in the Appendix). The analysis confirms a lower transition rate for female inventors, consistent with the baseline model. In this subsample, the correlation with debut age remains negligible but positive.
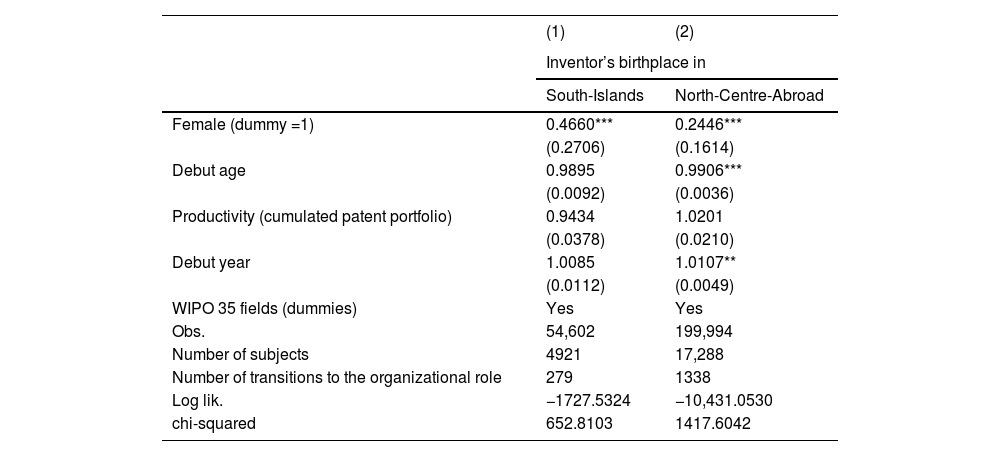
The second set of tests compares inventors born in southern regions and islands (NUTS1: ITF and ITG) with those born elsewhere in Italy or abroad. Results in Table 8 confirm a lower transition rate among female innovators and a modest role for variations in debut age. Interestingly, the reduction in transition likelihood associated with being female is greater for individuals born in the North (−75 %) than for those born in the South (−53 %).
Results of survival analysis using proportional hazards models via maximum likelihood. The filing of the first organizational patent constitutes the “failure” event. Analysis time starts at age 15. Model 1 includes inventors who debuted with an independent patent and were born in Southern regions or Islands; Model 2 includes those born elsewhere in Italy or abroad.
Standard errors are clustered on individuals (in parentheses). *** p < 0.01, ** p < 0.05, * p < 0.10.
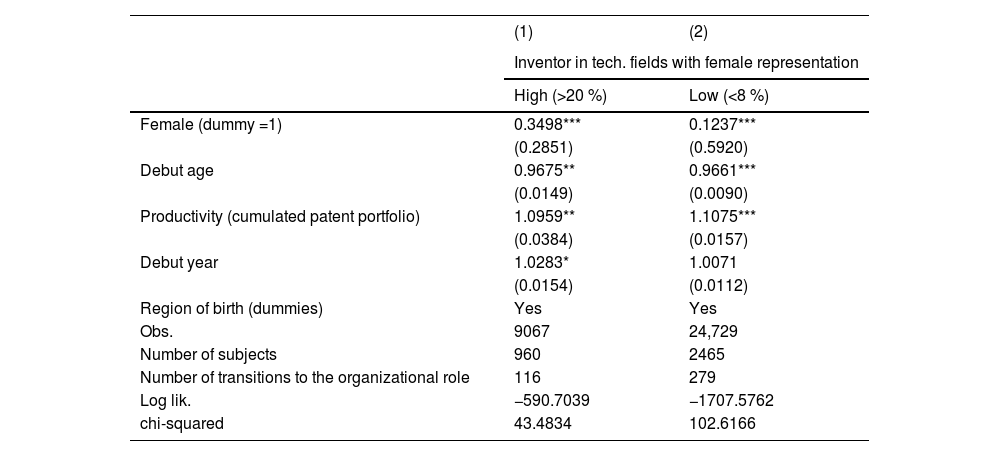
The results of the third group of robustness checks are reported in Table 9. Model 1 focuses on the five technological fields with the highest female representation (above 20 %): “Micro-structural and nano-technology”, “Organic fine chemistry”, “Pharmaceuticals”, “Biotechnology”, “Analysis of biological materials”. Model 2 examines the five fields with the lowest female representation (below 8 %): “Audio-visual technology”, “Engines, pumps, turbines”, “Machine tools”, “Basic communication processes”, and “Digital communication”. In both subsamples, female inventors are associated with a lower transition rate, and the difference is more pronounced in fields with extremely low female representation than in those with very high female representation (−88 % versus −65 %, respectively).
Results of survival analysis using proportional hazards models via maximum likelihood. The filing of the first organizational patent constitutes the “failure” event. Analysis time starts at age 15. Model 1 includes inventors debuting with an independent patent in the top five technological fields by female share (>20 %); Model 2 includes those in fields with the lowest female share (<8 %).
Standard errors are clustered on individuals (in parentheses). *** p < 0.01, ** p < 0.05, * p < 0.10.
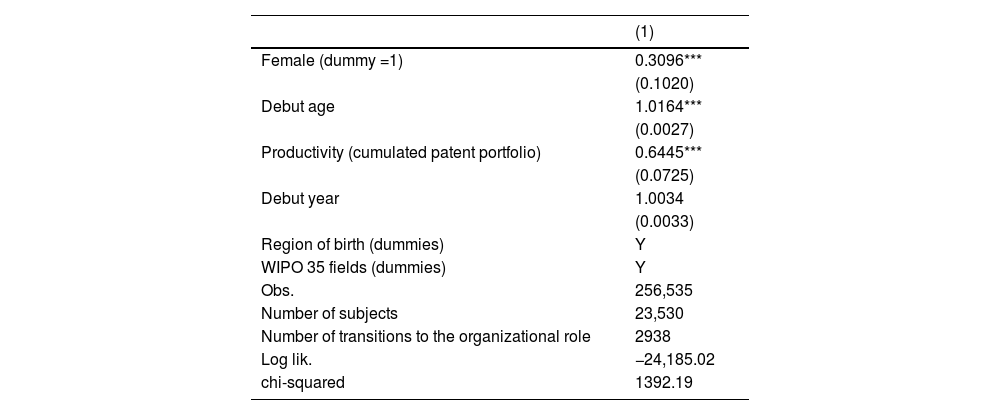
The next robustness test focuses on the subsample of inventors who transitioned to organizational status. Results (Table 10) indicate that, among those who successfully became organizational inventors, female innovators transition more quickly on average than their male counterparts. This suggests that I-O female inventors may represent a highly selected group of exceptional individuals—those able to transition rapidly. Male independent inventors, whether exceptional or not, are likely to continue their careers within organizations, whereas non-exceptional women appear more likely to be excluded from organizational inventive activity.
Results of survival analysis using proportional hazards models via maximum likelihood. The filing of the first organizational patent constitutes the “failure” event. Analysis time starts at age 15. Subsample: inventors transitioning from independent to organizational.
Standard errors are clustered on individuals (in parentheses). *** p < 0.01, ** p < 0.05, * p < 0.10.
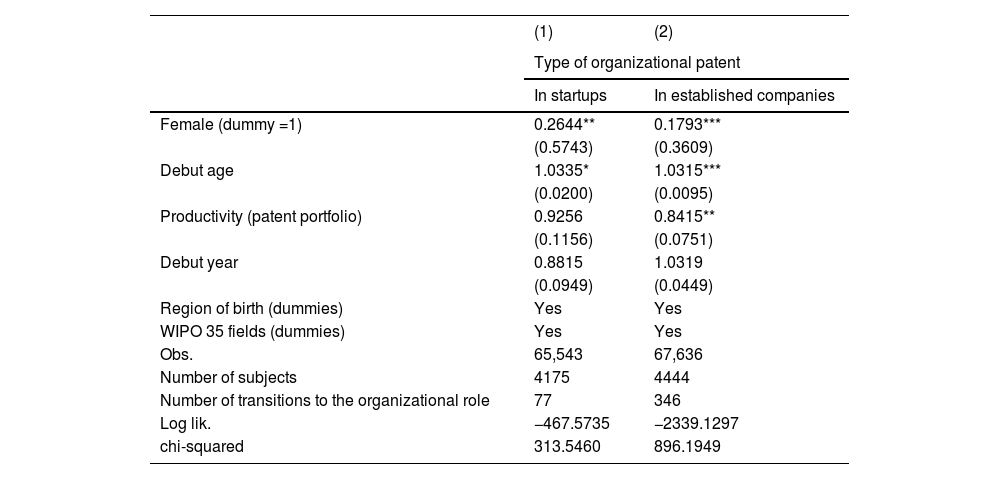
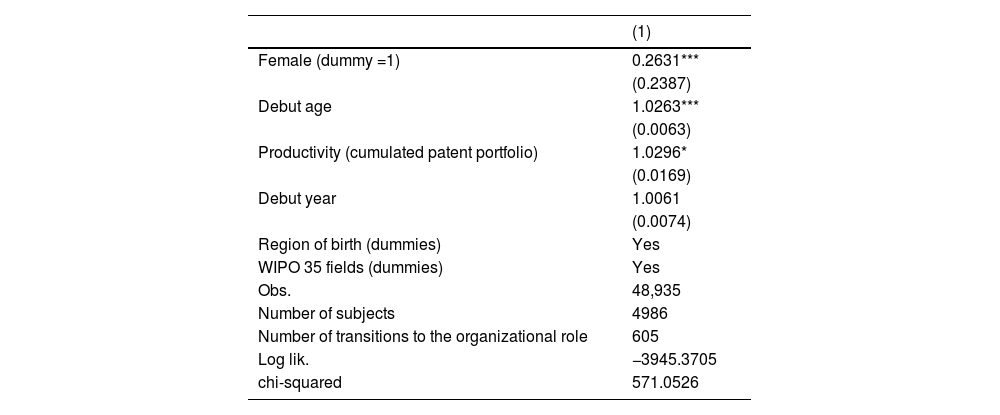
Since the definition of organizational patent treats all organizations monolithically, an additional robustness test distinguishes two main career types: inventors involved in “startups” and those hired by “established companies.” The first group comprises individuals who become organizational inventors when their patents are assigned to a newly founded company. Inventors in these firms are more likely to be entrepreneurs (or, if not founders, to have an entrepreneurial mindset) and thus to be highly involved in company decisions, while operating with fewer organizational, technical, and financial resources than inventors in the “established company” group.
This test was conducted on a subsample of independent inventors who debuted between 2000 and 2004 (details in Appendix 7.6). This empirical setup compares inventors in new ventures (either their own or those in which they are highly involved) with those likely to be hired by established companies. Results, reported in Table 11, confirm the baseline model. Additionally, the lower transition rate for female inventors is more pronounced among those hired by existing companies.
Results of survival analysis using proportional hazards models via maximum likelihood. The filing of the first organizational patent constitutes the “failure” event. Analysis time starts at age 15. Subsample: inventors debuting from 2000 to 2004. Model 1 considers organizational inventors in startups, whereas Model 2 considers them in established companies.
Standard errors are clustered on individuals (in parentheses). *** p < 0.01, ** p < 0.05, * p < 0.10.
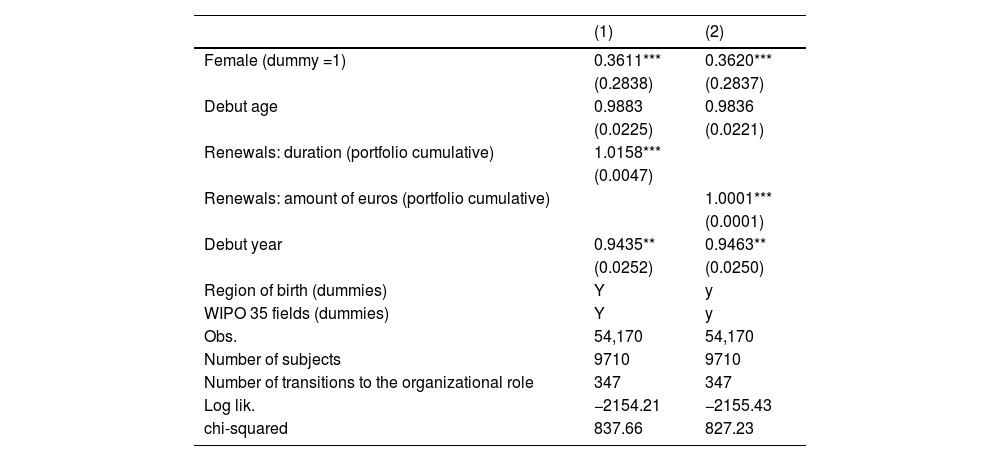
Finally, the baseline model was tested by including variables measuring the quality of inventors’ patent portfolios. These variables were calculated using renewal information (duration and monetary investment) available in 2024; therefore, the examined sample covers the period 1994–2004. Results reported in Table 12 confirm a lower transition rate among female inventors. Quality indicators suggest only a minimal positive correlation with the likelihood of transition.
Results of survival analysis using proportional hazards models via maximum likelihood. The filing of the first organizational patent constitutes the “failure” event. Analysis time starts at age 15. Sample: inventors debuting with an independent patent from 1994 to 2004.
Standard errors are clustered on individuals (in parentheses). *** p < 0.01, ** p < 0.05, * p < 0.10.
This study analyzes a sample of inventors who filed at least one independent patent at the UIBM during their careers between 1994 and 2017 and who also debuted in the same period. For these inventors, the Italian tax code is available, enabling the identification of sex at birth and date/place of birth. The patent portfolios of more than 23,000 individuals were reconstructed using their first and last names. The final sample accounts for 22 % of all patent applications recorded at UIBM during the period. Analyses reveal a substantial underrepresentation of female inventors, although their share increased from 9 % to 16 %, slightly higher than global statistics for the same period (Lax Martinez et al., 2016; Tahmooresnejad & Turkina, 2022; USPTO, 2019).
The average age at debut in the sample is 43.1 years. For comparison, Sirilli (1987) reported an average age of 46.5 for Italian inventors in 1981, though that figure included both debutants and experienced inventors. Female inventors debut at an average age of 41.0, compared to 43.5 for men. Female inventors thus file their first patent earlier than male inventors, consistent with U.S. findings by Kaltenberg et al. (2023). For both sexes, the debut age increased over the study period, with female inventors increasing at a faster rate and nearly reaching the male average by 2017. This trend contrasts with Jung and Ejermo (2014), who observed a decline in debut age among Swedish inventors, from 43 to 45 in 1985–1997 to 40.4 in 2007. However, the overall shift toward older debut ages aligns with evidence of growing participation by experienced individuals in scientific and innovative activities (Bloom et al., 2020; Cui et al., 2022; Jones, 2009). This global trend reflects increases in life expectancy, patenting propensity, the time required to acquire knowledge and skills, and the complexity of science and technology. As more people innovate later in life, it is reasonable to observe debut inventors entering at older ages, having accumulated experience, knowledge, and resources.
In the examined sample, the increase in debut age appears to be driven by two primary shifts: a relative decrease in the share of inventors filing their first patent before the age of 35 (particularly among male inventors), and a rise in those debuting between ages 45 and 64 (especially among female inventors). These findings suggest that, in the context of a global trend toward delayed debut age, the overall increase in female participation spans all age groups, with a notable concentration in the 45–54 age range.
This pattern aligns with demographic changes in Italy, where the average age of mothers rose from 28 to 32 during the same period, likely contributing to a reduced propensity to patent within that cohort. In 2014–2017, the distribution of debut age between male and female inventors became more similar than in previous years, although an anomaly persists around age 35. Until 2009, the data indicate an overrepresentation of debuting female inventors up to age 45; thereafter, the threshold appears to shift earlier, to around age 35.
Several potential explanations may account for the persistence of sex-related differences in the distribution of debut age. The recent increase in female participation may reflect individuals who did not patent earlier, delaying their first patent to a later stage in life. On one hand, this can be interpreted positively, as evidence of improved access to the innovation system. On the other hand, entering significantly later may limit their overall contribution, as valuable “inventing” time is lost. This is particularly relevant given that, although high-quality inventions can occur throughout a career, the early years tend to be the most productive (Kaltenberg et al., 2023).
The observed sex differences in the central age interval (30–45) may be attributable to childbirth, either directly or through sample selection effects, particularly during the 1994–2009 period. Prior to 2010, female inventors may have represented a selective group more likely to postpone or forego childbirth. In recent years, the broader pool of female innovators entering patenting activity may include more mothers, whose time resources are directly affected by childcare responsibilities, potentially leading them to anticipate or delay activities associated with patent filing.
This sex-related bias in the 30–45 age range is particularly significant, given that this window overlaps with the typically considered most prolific period for inventive output (Bell et al., 2019; Jones et al., 2014; Schettino et al., 2013; Väänänen, 2010). Future research could investigate the multiple contributing factors further and disentangle them.
The dynamic process of being an independent or an organizational inventor is then considered. The classification scheme proposed by Dahlin (2021) is adapted to the individual level, distinguishing between always-independent inventors (I and I-I), individuals transitioning from independent to organizational (I-O), and those moving in the opposite direction (O-I). The analysis reveals distinctive characteristics among always-independent inventors. Female representation is substantially lower among organizational inventors, whether I-O or O-I (less than 5 %), than among always-independent inventors (13.7 %). For reference, the share of female innovators among always-organizational inventors is 10.4 %. This evidence confirms a sex-related difference in patenting participation between independent and organizational inventors.
Multivariate analyses (controlling for sectoral and regional specificities) further indicate a significant reduction (−73 %) in the likelihood that independent female inventors file an organizational patent. In contrast, the effect of debuting at an older age is negligible.
Several potential explanations for the observed sex differences in transition patterns warrant investigation in future research. On the one hand, firms may exhibit a lower propensity to hire female independent inventors. On the other hand, female inventors may, on average, have had fewer resources than their male counterparts, such as less time to develop inventive skills or to continue practicing, due to disproportionate family or domestic responsibilities. Additionally, an initial lack of recognition could have been more detrimental for female inventors, consistent with literature on psychological differences in coping with failure and competition (e.g., Niederle & Vesterlund, 2007; Shastry et al., 2020; Thaler, 2021). These same factors may also contribute to a lower propensity among female innovators to launch startups based on patented technologies or to secure funding (Pistilli et al., 2023). This interpretation aligns with broader evidence of female underrepresentation across STEM fields and with findings by Dohse et al. (2021) on entrepreneurial attitudes among German scientists.
It is also plausible that women are more effective—or more inclined—toward independent invention, whereas men benefit more from the structure and support provided by organizations. Similarly, the higher rate of male inventors transitioning between statuses may reflect greater access to networks, capital, or negotiation power. These patterns suggest the presence of gendered dynamics within the innovation ecosystem, but further research is needed to disentangle underlying causes and assess whether they stem from inefficiencies, preferences, or structural constraints.
Several robustness checks confirm the lower transition rate for female inventors: when focusing on specific technological fields, distinguishing between inventors born in Southern Italy (or the Islands) versus those born elsewhere (including abroad), and when comparing inventors employed in startups versus those employed in established firms. Notably, the smaller transition rate for female inventors persists even among individuals with more than one patent, indicating that the result is not solely attributable to women being less likely to obtain a second patent. Interestingly, delayed transitions to employment for female innovators are more pronounced among those born in Northern Italy than in the South. This finding appears to contrast with the general evidence on economic, social, and cultural indicators, which typically show worse performance in Southern regions (Alaimo & Nanni, 2018; Bigoni et al., 2019; De Santis et al., 2021; Felice, 2018; Ostuni et al., 2022). However, it is important to note that the data refer to birthplace, and individuals born in the South may be more likely to relocate to Northern regions. Consequently, identifying female innovators born in Southern regions may capture a selective group with distinct characteristics relative to those born elsewhere in Italy. Future research could refine this interpretation by incorporating mobility data, starting from applicants’ residences at the time of filing.
When examining the subsample of inventors who transitioned into organizational roles, the sex dummy variable shows a different pattern: female inventors transition more quickly. This finding suggests that women in this group may represent a self-selected subset of highly motivated, resilient, and skilled individuals capable of overcoming structural obstacles to pursue their careers. Conversely, female inventors with fewer resources or less exceptional profiles are more likely to be filtered out. In contrast, men in similar circumstances may still manage to enter organizational roles, either as entrepreneurs or employees. This dynamic contributes to a higher number of “unrealized female innovators”.
This interpretation is consistent with evidence from Caviggioli et al. (2022), based on U.S. patent data (2008–2010), indicating that among the subsample of outstanding individuals, women outperform men in both the quantity and quality (measured by citations) of inventive output.
The underrepresentation of female independent inventors transitioning into organizational roles suggests that society may be losing their potential contribution to innovation. Frictions that limit access to human capital accumulation or entry into innovative occupations, such as those historically faced by women and minorities, can have substantial negative consequences for aggregate productivity and economic growth. Hsieh et al. (2019) estimate that improved allocation of talent across gender and race accounted for up to 40 % of U.S. output growth over the past half-century.
While organizations are the primary engine of innovation today, the role of independent inventors remains significant: their inventions can influence technological trajectories, and their potential could flourish with organizational support. To address these disparities, policies should aim to facilitate the transition from independent to organizational inventors and remove structural barriers. Examples include targeted support for early-career female inventors and reforms in institutional engagement with independent innovators. Such measures could also increase the visibility of role models, fostering innovation among underrepresented groups (Bell et al., 2019). Another potential area of intervention is IP law, which in its current form appears gendered (Lai, 2020a), leaving room for practices that fail to recognize women as legitimate inventors (Lai, 2021, 2024). Future research could further explore this issue, particularly by estimating the extent of exclusion experienced by female inventors.
Finally, the Italian context presents unique socio-legal and cultural characteristics that may help explain some of the differences observed compared to other jurisdictions. Italy exhibits substantial regional disparities in innovation capacity, gender norms, and economic development, with Southern regions generally lagging in industrial productivity and R&D investment (Di Giacinto et al., 2014; Felice, 2018). These disparities are compounded by persistent gender stereotypes, particularly in the South. For example, the unequal distribution of domestic responsibilities can hinder women's ability to sustain inventive activity or pursue organizational roles (Alaimo & Nanni, 2018; Ostuni et al., 2022). Moreover, the structure of the Italian industry, with its prevalence of small and medium-sized enterprises and relatively few large R&D-intensive firms, may limit opportunities for independent inventors to transition into organizational roles, especially for women. These factors suggest that Italy’s innovation ecosystem creates distinct patterns and constraints that future research should compare with those of other countries.
CRediT authorship contribution statementFederico Caviggioli: Writing – review & editing, Writing – original draft, Supervision, Resources, Methodology, Investigation, Formal analysis, Data curation, Conceptualization.
Patent data collected from the UIBM website include the following applicant fields: last name, first name, and tax ID. For organizations, the name is recorded in the “last name” field. There are two main types of tax IDs reported. For individuals, the tax ID is derived from personal data and encodes information such as sex, date of birth, and place of birth. For example, the code RSSMRA80A01L219M corresponds to a male born in Torino on 01/01/1980 (see the following paragraphs for further details). For organizations, the VAT number or tax ID is a progressive numeric code, such as 00583860986.
Italian patents list the individual tax ID for inventors when no organization is listed among the applicants. When an organization is the applicant, its VAT number is reported.
The individual tax code follows a 16-character format. It includes: six characters derived from the first and last name; five characters representing birth date and sex at birth; four characters indicating place of birth; one final character used as a control digit.
Official information can be accessed in the Internet Archive here: https://web.archive.org/web/20250115092558/https://www.agenziaentrate.gov.it/portale/web/guest/schede/istanze/richiesta-ts_cf/informazioni-codificazione-pf (last access in July 2025).
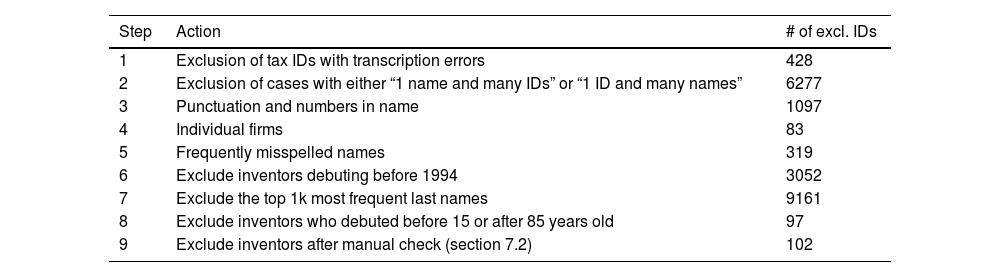
The selection process is summarized in Table 13. The first step excluded IDs with transcription errors that prevented identification of sex at birth, birth year or place, or contained inconsistencies in the final control digit.
Selection process: actions and IDs affected. Initial sample: 51,080.
The second step excluded cases in which a combination of first and last name was associated with more than one ID, or in which an ID corresponded to multiple names. This reduces the presence of homonyms. However, since the probability of spelling errors increases with the number of entries, this step may disproportionately exclude the most productive inventors.
Names containing punctuation marks or company descriptions (e.g., Italian words for “consultancy,” “professional firm,” “individual firm”) were excluded in steps 3 and 4, respectively.
Step 5 excluded first names that are frequently misspelled (e.g., “Giampiero,” “Gianpiero”). Notably, no spelling mistakes or missing letters in first names were found in the final sample.
The sample focuses on inventors with at least one independent patent filed between 1994 and 2017. Since the UIBM dataset does not cover years prior to 1994, a crawler was implemented to search Google Patents and identify inventors with patents filed before 1994, based on first and last names. This sixth step excluded an additional 3052 inventors.
The presence of homonyms (same first and last names) is the primary source of error in the matching process. To mitigate this, inventors with common Italian last names were excluded. These names (e.g., “Rossi,” “Russo,” “Bianchi”) were identified from a list of the 1000 most frequent surnames compiled from an analysis of Italian phone books from the 1990s.1212 https://www.mappadeicognomi.it/classifica_cognomi_piu_diffusi.php last accessed in January 2023.
Filtering by last name is not expected to significantly affect sex or age distribution; however, regional concentration of specific surnames could indirectly influence results if regions exhibit different aging patterns, which does not appear to be the case for Italy during the period considered.
In step 8, the sample was refined by excluding inventors with debut ages younger than 15 or older than 85 to remove outliers. This step also addressed issues related to birth-year coding in Italian tax IDs, which were introduced in 2000 (e.g., 1900 coded as 2000, 1901 as 2001). A few remaining cases with uncertain birth years were manually checked and confirmed.
The final step excluded IDs identified as incorrect matches during reliability tests described in the next section. Whenever checks indicated that patents from different individuals were incorrectly grouped (false positives) or that patents belonging to one individual were missing from their portfolio (false negatives), those IDs were removed from the analysis.
The identification of potential patents assigned to an inventor's organization was performed by matching the concatenated string of last and first names (excluding spaces). This string was searched across the entire UIBM inventor dataset to consolidate records for a single individual. Whenever an inventor’s name matched the string, the record was treated as belonging to the same individual.
This procedure may lead to two types of errors: i) different individuals sharing the same name and being incorrectly merged (false positive); ii) patents belonging to an individual being excluded from their portfolio (false negative) due to variations in name spelling. Although these errors are unlikely to affect sex-based statistics, they may distort the debut year and the timing of first independent or organizational patents.
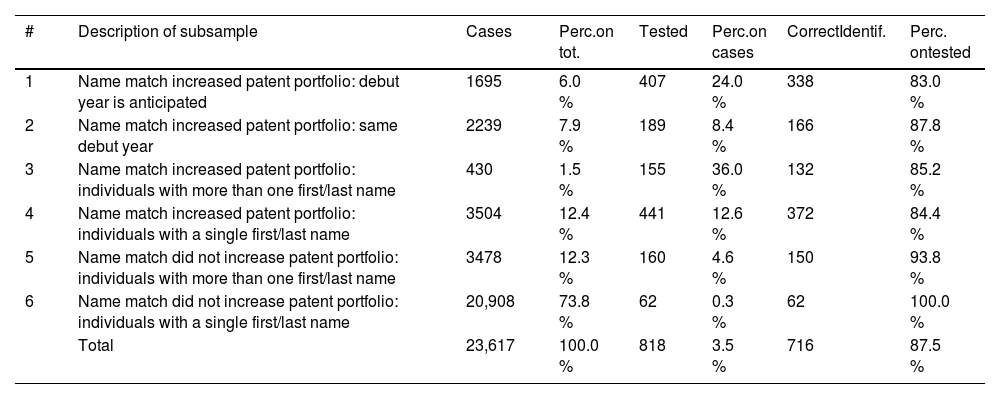
Random manual checks were conducted on subsamples at higher risk of error. These checks involved comparing patent data (e.g., whether coinventors were the same, whether invention titles were related, whether assignees were located in the same town) and verifying the inventor’s presence online (e.g., LinkedIn, news sources, other social media) to corroborate the matching procedure. In several cases, direct contact was made via email or LinkedIn to clarify uncertainties. If validation did not yield an explicit confirmation, the case was classified as a potential error and counted as a wrong match in Table 14, which summarizes the accuracy tests.
Accuracy tests.
False positives may occur when name matching artificially increases the portfolio size of independent inventors. In 1695 cases (6 % of the sample), the match resulted in an anticipated debut year; for this subsample, 83 % of tested individuals were correctly matched. In 2239 cases (8 %), the match did not alter the debut year but could misidentify the transition between independent and organizational status; 88 % of tests in this subsample were correct.
False negatives arise when a patent is excluded from an inventor’s portfolio due to misspellings or name variations (e.g., inclusion/exclusion of a second name). Evaluation focused on common sources of error, such as names with spaces (e.g., “Del Piero” vs. “Delpiero”), addition of middle names (e.g., “Mario Rossi” vs. “Mario Luigi Rossi”), or multi-part names (e.g., “Camillo Benso Cavour”). Last names composed of multiple words (1822 records) often begin with prefixes such as “Di,” “De,” “Del,” “Della,” “Degli,” or “Dei” (31 % of cases). Checks of these names revealed no mistakes, and no potential spelling errors were identified.
False negatives could also occur in the remaining sample, where inventors reported a single first and last name in their tax code. It is unlikely that additional name components would appear in other patents; tests confirmed that there were no errors in these cases.
Some inventors in the sample are researchers who, at some point, filed an independent patent. This group could transfer IP rights to their employing university or research center, retain them under the “Professor’s Privilege” (active from 2001 to 2023), or assign them to a collaborating organization. Partnerships and collaborations are common among researchers at universities and government centers, but these do not necessarily indicate employment with a company. Consequently, inventors affiliated with universities or similar institutions cannot be immediately classified as independent or organizational under the theoretical definition and its operationalization. For this reason, they were excluded from the analyses.
Identification relied on the presence of a university, research center, or government agency among the assignees. This process also excluded inventors who were not employed by such institutions but collaborated with them. The identification in patent data was based on two fields. First, UIBM data includes a field specifying the type of organization, from which universities, national agencies, and government entities were selected. Second, the assignee name fields were searched using keywords and wildcard characters to capture universities (e.g., “cnr”, “consiglio nazionale*ricer*”, “politecnico”, “universit*”, “scuola”, “istituto naz*” etc.). Foreign universities were also tagged.
Data on the retirement or death of individuals are not available; therefore, the exact moment when an inventor exits the pool of potential patent applicants cannot be determined with certainty. Inventors who were never identified as organizational before 2017 could transition to that status in subsequent years, outside the observed timeframe. Additionally, some independent inventors resume patenting after long breaks. Two considerations partially mitigate this issue: i) Dahlin (2021) found that 93 % of patenting activity occurs within five years from the starting date; ii) the empirical model employs a survival analysis approach to account for exposure time to the risk of transitioning to organizational status.
The selected sample focuses exclusively on patents filed through the national route. Inventors may submit applications abroad or to regional offices such as the EPO without corresponding family members in Italy. While this cannot be ruled out, such cases are expected to constitute a tiny fraction, particularly given that independent inventors typically have limited resources and that, since 2008, the Italian Patent Office (UIBM) has forwarded all new filings directly to the EPO for examination.
University patents are associated with a higher representation of female inventors (Whittington & Smith-Doerr, 2005). Consequently, the career dynamics of inventors involved in academia or research centers, whether as employed researchers or independent individuals collaborating with academics, may differ substantially from those examined in this study.
Due to the absence of tax ID data for always-organizational inventors, a random sample of 500 names (first and last) was extracted from the examined dataset. Each name underwent a disambiguation process to ensure that all patents included in the inventor’s portfolio belonged to the same individual. This verification relied on manual checks of patent content and external sources (e.g., LinkedIn profiles, company websites), particularly when multiple assignees appeared in an inventor’s patenting history. Google Patents was also consulted to identify any patents filed prior to 1994. The screening process resulted in the identification of 307 organizational inventors, for whom gender was probabilistically determined using the website “genderize.io”.
The subsample of independent inventors debuting between 2000 and 2004 includes 459 “I-O” individuals. This time range was selected to ensure a sufficient number of cases for manual examination, considering the difficulty of retrieving information on startups prior to widespread online presence, while leaving enough years after debut for observation. For each inventor, the organization that served as the applicant for the first “O” patent was examined to obtain information on its founding year. Organization names and tax IDs were searched in the global company repository Orbis and, when not found, in public sources such as the Italian Chamber of Commerce registry, company and inventor profiles on LinkedIn, and general web searches.
This process enabled the identification of the foundation year for 92.2 % of the companies associated with the examined inventors, with sufficient accuracy. In some cases, the exact year of founding was unavailable, but evidence indicated that the company was founded several years prior to the filing date. The organization’s foundation was considered strictly connected to the “O” patent when its foundation year was within two years prior to the patent filing date (18 % of cases). For the sensitivity analysis, an alternative definition using a three-year window (23 % of cases) was tested, yielding very similar results (available upon request).
Table 15 compares inventors’ productivity during the first ten years after debut, restricting the subsample to those with an initial filing before 2008. This criterion excludes 43 % of the subjects. Within the subsample, most inventors (67.8 %) filed only one patent; 29.2 % filed between two and five patents; and 2.9 % filed more than five. The average productivity of male inventors in the first decade of patenting is higher than that of female inventors (1.74 vs. 1.45). This difference is statistically significant according to the t-test. Furthermore, 66.8 % of male inventors hold a portfolio of one patent, compared to 75.5 % among female inventors.
Results of survival analysis using proportional hazards models via maximum likelihood. Filing of the first organizational patent is the “failure” event. Analysis time starts at age 15. Sample includes all inventors with at least one independent patent (I, I-I, I-O, and O-I).
Standard errors are clustered on individuals (in parentheses). *** p < 0.01, ** p < 0.05, * p < 0.10.
Results of survival analysis using proportional hazards models via maximum likelihood. Filing of the first organizational patent is the “failure” event. Analysis time starts at age 15. The sample includes inventors who debuted with an independent patent and filed at least two patents by 2017.
Standard errors are clustered on individuals (in parentheses). *** p < 0.01, ** p < 0.05, * p < 0.10.
The definition in this study follows the constructs in Bates et al. (2022): “sex” is a biological construct and “gender” is a social and psychological construct, including gender identity (how individuals perceive themselves) and gender expression (how they present themselves to others). Since the tax ID provides data on the sex at birth, the notation “female/male inventor” is preferred over “woman/man”.
Last access in December 2022: https://uibm.mise.gov.it/index.php/it/.
Each patent portfolio in the examined sample of inventors includes at least one independent patent (i.e., the individual tax ID is reported in the applicant field). The portfolio may include other patents that report the same inventor’s name and contain diverse applicant data (the same individual’s tax ID or an organizational applicant with its tax ID and/or name).
In some cases, regional borders changed through time, and the affected cities were allocated following the most recent configuration.
Data on renewals are considered up to 2004 to cover up to 20 years of available data.
Source: https://www.oecd.org/els/family/database.htm.
https://www.wipo.int/ipstats/en/docs/ipc_technology.xlsx (last accessed in March 2023).
Two-thirds of the applications with no IPC code are recorded with a “withdrawn” or “rejected” status (or the like), 9% have unclear status, and the rest (24%) are granted.
Stcox command in Stata 17.
A robustness test considering also the “O-I” inventors was performed. The results are very similar and reported in the appendix (Table 16).
Further details on how censoring is accounted for by the model (i.e., partial Likelihood, risk sets, Breslow's method for handling tied events) can be found in Breslow (1974) and Cox (1972).
articles