


In recent years information and communication technology (ICT) development and its relationship with carbon emissions has become a significant research focus. Using data from 30 Chinese provinces and cities covering 2010–2022, we conduct an empirical study on the impact mechanism of ICT on carbon emissions employing a spatial Durbin model. Six relevant results emerge. 1) ICT development increases local carbon emissions and reduces surrounding carbon emissions but reduces overall carbon emissions. 2) ICT development can indirectly reduce local carbon emissions by promoting industrial structure upgrading and technological innovation. 3) Technological innovation has significant spillover effects, wherein ICT development reduces carbon emissions in surrounding areas, which is generated by technological innovation, but the spatial spillover effect of industrial structure optimisation is insignificant. 4) Heterogeneity tests reveal that ICT development in western and eastern regions increases local carbon emissions, reduces carbon emissions in surrounding areas and reduces total carbon emissions. Furthermore, the carbon emissions reduction effect in the western region is better than that in the eastern region, ICT development in the northeast region reduces carbon emissions in local and surrounding areas and ICT development in the central region has no significant impact on local and surrounding carbon emissions. In addition, the carbon emissions reduction effect of ICT is better in ICT-intensive areas. 5) Segmented regression reveals that the inhibitory effect of ICT development on carbon emissions during the 2010–2016 period was greater than that during the 2016–2022 period. 6) We also compare and analyse the impact of ICT manufacturing and service sectors on carbon emissions, the impact of ICT input on carbon emissions in the production process of different industries and the moderating effect of energy structure on the impact of ICT development on carbon emissions. Finally, we present targeted policy recommendations and propose future research directions.
Since industrialisation, the widespread use of fossil fuels has dramatically increased the concentration of carbon dioxide (CO2) in the atmosphere, resulting in global warming and extreme weather and frequent climate events. According to International Energy Agency statistics, global energy-related CO2 emissions in 2023 amounted to 37.4 billion tonnes, an increase of 1.1 % from 2022, while China’s CO2 emissions were 12.6 billion tonnes, representing an increase of 4.13 % from the previous year, which is the largest increase in nearly 60 years.2
The Paris Agreement proposed to ‘limit the increase in global average temperature to 1.5 °C above pre-industrial levels’ by the end of this century. To achieve the Paris Agreement’s temperature control goal, the United Nations Framework Convention on Climate Change required each country to determine its own national contribution to reducing carbon emissions. Subsequently, the Chinese government made a solemn commitment at the 75th session of the United Nations General Assembly to ‘strive to peak carbon dioxide emissions by 2030 and strive to achieve carbon neutrality by 2060′, which is known as China’s ‘dual carbon goal’.
Information and communication technology (ICT) development has profoundly altered the economic, cultural and global environment (Asongu, Le Roux & Biekpe, 2017). In recent years many developing countries have issued policies on green development and low-carbon economy, implementing multiple policies that emphasise the role of ICT and digital technology in environmental protection. China’s Ministry of Industry and Information Technology and seven other ministries jointly released the Action Plan for Green and Low-Carbon Development of the Information and Communication Industry (2022–2025) on August 22, 2022, emphasising the need to digitise and green society through ICT industry development and guiding enterprises to assume a green facilitating role.
Although the ICT industry has emerged as a significant enabler in the fight against climate change (GeSI, 2019), controversy remains in the academic community as to whether ICT development promotes or inhibits carbon emissions. Some scholars have argued that ICT reduces carbon emissions by accelerating energy restructuring through deeper integration with other industries (Chien et al., 2021; Dogan & Pata, 2022). Other scholars have contended that energy consumption and carbon emissions from digital infrastructure are on the rise as digital demand continues to grow (Danish, 2019; Lange & Santarius, 2020). For example, electronic device manufacturing, data centres’ power consumption and the transportation of goods all increase CO2emissions (Kou, Yüksel & Dinçer, 2022; Mathiesen & Lund, 2009). Furthermore, with rapid ICT development, the future disposal of outdated products will also increase CO2 emissions (Hayford, Ofori, Gyamfi, & Gyimah, 2023). Therefore, examining whether ICT development will promote or inhibit China’s carbon emissions, and how it will affect the carbon emissions relative to the dual carbon target in China is of great theoretical and practical significance. Therefore, based on the current status of China’s ICT development and carbon emissions, this study examines the impact mechanism and effects of ICT on China’s carbon emissions.
The main innovation of this study is the proposed spatial mediating effect model to examine the mechanisms of the impact of ICT development on carbon emissions and explore how ICT affects carbon emissions through industrial structure optimisation and technological innovation mediating variables and whether this indirect impact has spatial spillover effects. Second, in addition to the spatial differences in the impact of ICT on carbon emissions, we also examine the differences in the impact of ICT on carbon emissions over different time spans. Third, this study analyses the differences in the impact of ICT on carbon emissions in ICT-intensive regions and non-intensive regions. Fourth, the extended portion of the study investigates the differing impacts of ICT services and manufacturing sectors on carbon emissions and the varying impacts of ICT input on carbon emissions within different industries. Finally, we examine the moderating effect of energy structure on carbon emissions.
The remainder of this paper includes the following parts. Section 2 presents a literature review and research hypotheses, Section 3 details the empirical analysis of the effect of ICT development on carbon emissions, encompassing the benchmark regression, spatial panel data regression, spatial mediating model regression and spatial and temporal heterogeneity tests. Section 4 presents extended research comparing the impact of ICT services and manufacturing sectors on carbon emissions, the impact of ICT input in different industries on carbon emissions and the regulatory influence of energy structure on the impact of ICT on carbon emissions. Section 5 details our conclusions and policy recommendations, and Section 6 examines the limitations of the study.
Literature review and research hypothesesThe impact of ICT development on carbon emissions can be divided into four levels. First, whether ICT will increase or reduce carbon emissions; second, whether the impact of ICT development has a spatial spillover effect on carbon emissions; third, through what mechanisms ICT affects carbon emissions, and whether these mechanisms have spatial spillover effects; and fourth, the impact of ICT investment on carbon emissions in different industries. Next, we review the literature based on these considerations and propose hypotheses.
The rapid development of the ICT industry has increased energy consumption. According to the definition of the China Academy of ICT (CAICT), the ICT industry covers electronics and information manufacturing, telecommunication, software and information technology (IT) services and internet industries (CAICT, 2023; GeSI, 2015, 2019).
In recent years, China’s ICT industry has been rapidly developing, becoming an engine pulling China’s economic growth. According to 2023 statistics, the scale of China’s ICT industry reached ¥ 92 trillion, accounting for 7.6 % of GDP.3 In 2020 China’s data centres and 5 G used 2011 billion kWh of electricity, accounting for 2.7 % of the nation’s total social electricity consumption.4 At the same time, ICT emits 120 million tonnes of CO2, equivalent to 1 % of China’s CO2 emissions(He, Zheng & Zhang, 2020). For example, some scholars have argued that ICT development increases energy consumption and releases large amounts of CO2, posing a serious threat to the environment (Salahuddin, Alam and Ozturk (2016)).
In contrast, some scholars have asserted that ICT development reduces total CO2 emissions (Haini (2021); Danish (2019); Ozcan and Apergis (2018)). Furthermore, Higón, Gholami and Shirazi (2017) and Shahnazi and Dehghan Shabani (2019) concluded that ICT has an inverted U-shaped relationship with carbon emissions.
Therefore, we propose the following hypotheses based on the above analysis.
Hypothesis 1 ICT development increases carbon emissions.
Hypothesis 2 ICT development decreases carbon emissions.
ICT development not only has a significant impact on local carbon emissions but also affects the environments of surrounding areas. Moreover, significant spatial correlations of carbon emissions are evident in each region, with a relatively stable trend (Wu, 2015). The technological spillover effect of ICT plays a crucial role in supply chain management (Zhang, Van Donk and van der Vaart (2016)), technological innovation collaboration (Tian and Lu (2023)) and other related areas.
Different types of technological innovations have different diffusion paths. ICTs themselves predominantly rely on networks and platforms to achieve cross-regional dissemination. Green technologies are primarily promoted through policies and regulations, national demonstrations and regional cooperation such as local government policy support for green buildings, green transportation, smart grids and incentives such as subsidies and tax breaks. Therefore, we propose the following hypothesis based on the above analysis.
Hypothesis 3 ICT development curbs carbon emissions in surrounding areas.
In recent years, China’s industrial structure has undergone significant changes. From 2010 to 2023, the added value of the primary industry decreased from 10 % to 7.1 %, the added value of the secondary industry decreased from 46.5 % to 38.3 % and the added value of the tertiary industry rose from 44.2 % to 54.6 %. Cloud computing, big data analytics and artificial intelligence (AI) have given rise to new service industries such as digital content, financial technology, telemedicine, and others that directly increased the proportion of the tertiary industry (Crawford, 2021). ICT is a significant driver of the advanced industrial structure (e.g. the proportion of the service industry rising) (Gan, Zheng & Yu, 2011).
Globally, ICT manufacturing and service industry development is unbalanced, and ICT service industry growth has been more rapid than the ICT manufacturing industry, and the value added of global ICT service industry reached 30.57 billion euros in 2018, which is far more than the value added of ICT manufacturing industry of 6.23 billion euros.5 The theory of endogenous economic growth asserts that IT input has a significant effect on improving labour productivity, and its overall contribution to the tertiary industry’s labour productivity is the largest,6 subsequently promoting industrial structure upgrading.
Compared with the manufacturing industry, the service industry has a lower energy consumption intensity (EnerData, 2016). The environmental Kuznets curve indicates that in a growing economy in which a country’s economic development level is low, the degree of environmental pollution is light, but as the economy grows the degree of environmental degradation intensifies. When economic development reaches a ‘tipping point’, the degree of environmental pollution diminishes and environmental quality improves (Grossman and Krueger (1991)).
Another reason is that the agricultural economy traditionally has low-carbon emissions, and carbon emissions lower again amid industrialisation and the increased proportion of the service industry (Dinda, 2004). Some scholars have demonstrated this through empirical research. For example, Sun, Wu and Bao (2018) revealed a correlation between industrial structure rationalisation, seniority and carbon emissions respectively, confirming that industrial structure rationalisation and seniority have positive impacts on carbon emissions reduction.
Industrial structure optimisation also reduces carbon emissions, and an increased proportion of tertiary industry value added in relation to that of the secondary industry implies economic structure transformation in service and high-technology industries, which usually have lower energy and carbon emissions intensity (Sun, Wu & Bao, 2018). Therefore, ICT development has a mediating influence on curbing carbon emissions. This was also confirmed in related studies. For example, Wang, Chen, Ramsey and Hewings (2022) demonstrated that ICT significantly reduces carbon emissions through industrial structure upgrading and energy efficiency improvement, and Zhou and Shan (2023) showed that intelligent manufacturing advances carbon efficiency by promoting industrial structure upgrading.
Based on the above analysis we propose the following hypothesis.
Hypothesis 4 ICT development inhibits carbon emissions by optimising industrial structure.
ICT can also drive innovation by facilitating collaboration between researchers. Kleis, Chwelos, Ramirez and Cockburn (2012) found that IT investment has a significant positive effect on corporate innovation. ICT makes it easier for inventors to access a wider range of ideas and potential collaborators, which may result in new inventions. Furthermore, ICT facilitates knowledge exchange, which increases productivity and innovation activity, and ICT has a significant positive impact on converting innovative works into patents (Wernsdorf, Nagler & Watzinger, 2022).
In addition, ICT development can promote enterprises’ green technology innovation through multiple paths, and green technology innovation itself can improve energy efficiency (Xu & Chen, 2024), reduce environmental pollution and reduce carbon emissions. First, telecommunications infrastructure improves corporate governance by reducing information asymmetry, improving management efficiency and curbing unsound decision-making (Tang, Xu, Hao, Wu & Xue, 2021), subsequently promoting green technology innovation in enterprises. Second, IT directly promotes renewable energy technology development through the application of technologies such as smart grids and sensors (Kim & Park, 2016; Yap, Chin & Klemeš, 2022) that can reduce fossil fuel dependence and carbon emissions.
Li, Wang and Wan (2024) demonstrated that inefficient industrial technology in China is the reason for the upwards trend in potential carbon emissions reduction. Yang, Zhu and Jia (2019) concluded that CO2 emissions reduction primarily relies on technological progress. These findings suggest that if ICT development can promote industrial technological innovation, it can curb carbon emissions. Moreover, technological innovation has considerable spatial spillover effects, and interregional technological cooperation and linkages can improve carbon emissions efficiency (Xu, Zou, Su, Zhang and Ge (2023).
Based on the above analysis, we propose the following hypothesis:
Hypothesis 5 ICT development curbs carbon emissions by promoting technological innovation.
The impact of ICT on carbon emissions is also related to its impact on various industries’ energy efficiency. ICT can improve energy efficiency by reducing resource waste, enabling other industries and promoting productivity improvement. For example, ICT can reduce energy consumption through production process simulation, intelligent design and manufacturing of products and services, intelligent distribution and logistics, mass customisation and remote work (Berkhout and Hertin (2001))). The use of the Industrial Internet of Things (IoT) can improve energy efficiency in the manufacturing industry (Beier, Niehoff and Xue (2018)). The application of digital equipment and processes can improve energy efficiency in industries such as agriculture, transportation, real estate and manufacturing (Horner, Shehabi & Azevedo, 2016; Mickoleit, 2010). IT can optimise clean energy systems’ performance through accurate predictions and real-time monitoring, improving clean energy systems’ efficiency and reducing carbon emissions (Owusu & Asumadu-Sarkodie, 2016). In addition, financial technology has significantly reduced carbon emissions intensity in Chinese provinces and improved energy efficiency (Chen, Wang & Ye, 2024).
In contemporary China, enterprises adopt ICT by deploying IoT sensors, AI algorithms, intelligent control systems, and other forms in production and operation to optimise energy utilisation efficiency. For example, Artificial intelligence algorithms enhance operational efficiency within the textile industry (Farooq, Bao, Raza, Sun & Ma, 2021). Information and communications technology (ICT) can significantly contribute to industrial energy conservation and emission reduction by improving production and management efficiency (Wang, Wen, Cao and Dinga (2022)). Faenza, a company based in Southern China, employs an EMS to implement a sustainable smart manufacturing strategy across its entire production process (Ma, Ding, Liu, Ren, & Yang, 2022). In contrast, Huida, located in Northern China, achieves sustainable smart manufacturing and enhances energy efficiency through ‘cradle-to-gate’ lifecycle big data analytics (Ma et al., 2022).
Therefore, we propose the following hypotheses based on the above analysis.
Hypothesis 6 ICT development improves industry’s energy efficiency, reducing carbon emissions.
Fig. 1 illustrates the theoretical framework of this study.

Although some scholars have examined the impact of ICT on carbon emissions, the conclusions remain controversial. For instance, Tang and Yang (2023) argue that digital infrastructure has increased total carbon emissions, per capita carbon emissions, and carbon intensity. In contrast, Li, Gao and Shi (2024) contend that ICT enhances carbon emission efficiency. Pang, Zhao and Zhang (2023) demonstrated that the agglomeration of the ICT industry exhibits a significant inverted U-shaped effect on carbon emission efficiency. Zhou, Zhou, Wang and Su (2019) found that the impact on carbon emissions varies significantly across different industries. Zhong, Cao and Zou (2022) acknowledge the potential of ICT in reducing carbon emissions but also highlight that this potential has not been fully realized in the production methods of most provinces. They suggest that ICT needs to be better aligned with low-carbon transformation in the future. Therefore, further research is needed to explore the direction and mechanisms through which ICT impacts carbon emissions.
This study examines the impact of ICT on carbon emissions at the provincial level and considers the spatio-temporal heterogeneity of this impact, using a spatial mediation effect model to empirically analyse the mechanisms by which ICT affects carbon emissions. The findings have significant practical value for guiding government development of relevant policies to advance China’s dual carbon goal.
Research methodologyModel constructionBenchmark regression model constructionTo examine the relationship between ICT development and carbon emissions in a more comprehensive and systematic way, we construct a panel double fixed effects model as the control group for the benchmark regression, the specific model is as follows:
where CE and ICT respectively represent carbon emissions and ICT, C is the relevant control variables affecting carbon emissions intensity, ε0 is the random perturbation term and β is the estimated coefficient or constant of the variable.
Our literature review indicates that ICT and carbon emissions are spatially related; therefore, we adopt a spatial model to analyse this relationship. For this purpose, we use spatial panel models to explore the spatial dependence between the two. The most commonly used spatial econometric techniques are the spatial Durbin model (SDM), the spatial autoregressive (SAR) model and the spatial error model (SEM). The SDM model synthesises the assumptions of the SAR model and the SEM and simultaneously captures the spatial interaction between the dependent variable and explanatory variables.
We reference Ma and Zhao (2022) and construct the following model:
where CEit and ICTit respectively denote carbon emissions and ICT, Cit is the relevant control variables affecting carbon emissions, εit, δit and εit are random perturbation terms, α and β are variable estimated coefficients or constants, and W denotes the spatial weight matrix.Mechanism model construction


To examine the influence of our proposed mechanism variables and explore the mechanisms’ impact, we choose the SDM, which can flexibly capture dependency patterns at different spatial scales using a spatial weight matrix (e.g. based on distance, adjacency or economic connections). The SDM can also quantify direct effects (local impacts) and indirect effects (spatial spillovers) and is suitable for analysing spillover scenarios such as policy diffusion and pollution transmission.
Therefore, we reference Cheng and Wang (2023) and construct the following SDM model:
where Y is the carbon emissions explanatory variable, X denotes the ICT explanatory variable, M denotes the mediating variables, C denotes the control variables, δ is the random error, β and α are the coefficients or constants and W denotes the spatial weight matrix. Eq. (5) tests the relationship between the explained variables and the explanatory variables, Eq. (6) tests the relationship between mediating and explanatory variables and Eq. (7) tests the relationship between explanatory variables, mediating and explained variables.


The specific testing steps are threefold. First, test the coefficient of the explanatory variable β11 (α11) of Eq. (5). Second, test the coefficient of the explanatory variable β22 (α22) of Eq. (6) and the coefficient of the mediating variables of Eq. (7) in turn β33 (α33). If both are significant, this indicates that the mediating effect is evident. Finally, test whether the coefficient of the explanatory variable β34 (α34) is significant. If it is significant, this indicates that the direct effect exists and the mediating effect is partially supported; if it is insignificant, this indicates that the direct effect is not evident and the mediating effect is fully supported.
Variable selection and data sourcesVariable selection(1) Explained variables
Carbon emissions (CE): The majority of literature regarding the representative variable of carbon emissions has directly adopted the absolute value of carbon emissions as its representative variable (Pang, Zhao & Zhang, 2023), and some studies have employed carbon emissions efficiency as the representative variable of carbon emissions (Zhou, Zhou, Wang & Su, 2019). On August 2, 2024, the General Office of the State Council issued the Work Program for Accelerating the Construction of a Dual-Control Degree System for CE, which stated that reducing CE intensity would be taken as a binding indicator for national economic and social development during the Tenth Five-Year Plan period. Referencing Ji and Wang (2025), we select CE intensity to quantify CE, which is specifically expressed by the ratio of CE to GDP in each region. This index effectively measures the efficiency of energy consumption and CE in the process of regional economic development. The CE calculation is based on Fu, Ma and Song (2015), according to the CE coefficients published by the Intergovernmental Panel on Climate Change and standard coal conversion coefficients, which are based on kerosene, diesel fuel, fuel oil, gasoline, crude oil, coke, coal and natural gas consumption converted and summed for each province.
(2) Core explanatory variables
ICT: Previous research has not yet established a unified standard for measuring ICT development. Some studies have used the proportion of internet users in the population and the number of mobile cellular subscriptions per 100 people, the degree of integration of the ICT industry and ICT manufacturing and service sectors’ output value as representative variables (Pang, Zhao & Zhang, 2023; Zhou, Zhou, Wang & Su, 2019). Because ICT service can overcome geographical limitations through knowledge sharing and platform digitalisation and the spatial spillover effect across regions is stronger, we use the proportion of software and IT service industry revenue to GDP in each province as the representative variable of ICT.7
(3) Mechanism variables
Industrial structure (IS): We reference He and Gu (2025), using the proportion of tertiary industry added value to that of the secondary industry to measure industrial structure adjustment and optimisation.
Technological innovation (TI): Combined with indicators from the National Bureau of Statistics (NBS), we use the intensity of research and experimental development (R&E) investment, i.e. the ratio of R&E investment to regional GDP. This indicator can effectively measure the scale and level of a country’s or region’s independent innovation investment.
(4) Control variables
Referring to Xu and Chen (2024), we select economic growth (EG), foreign direct investment (FDI), environmental regulation (ER), urbanisation (URB), market development (ML) and per capita energy consumption (PEC) as control variables. EG is measured and standardised using the per capita GDP of each region. FDI is expressed by the ratio of the amount of FDI to the regional GDP. ER is measured by the ratio of the amount of investment in industrial pollution control to the GDP, referencing Huang (2017). Urbanisation is expressed using the proportion of urban population to the total resident population. Market development is measured by the ratio of fiscal expenditure to GDP, and PEC is expressed by the ratio of total energy consumption to the year-end resident population.
Data sources(1) Data sources and processing
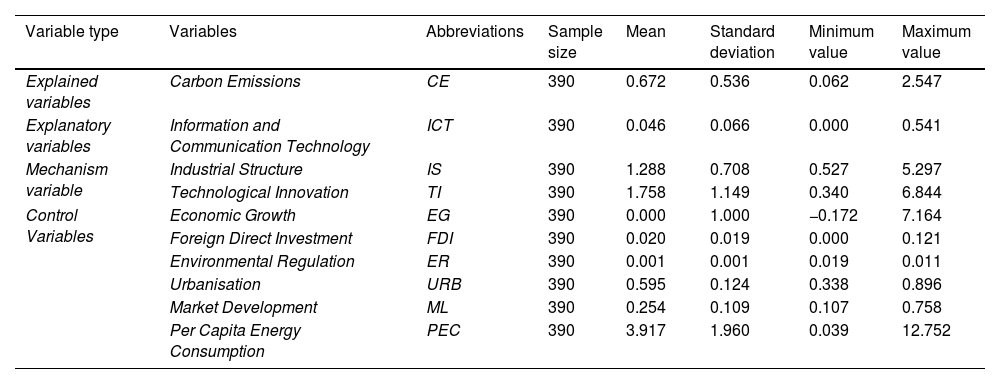
Due to the lack of data from Tibet and the difficulty of obtaining data from Hong Kong, Macao and Taiwan, we use data from 30 provinces, autonomous regions and municipalities directly under the central government for the 13-year period from 2010 to 2022, excluding Tibet, Hong Kong, Macao and Taiwan. The CE data are obtained from the NBS and the National Energy Statistical Yearbook, data related to the ICT are sourced from the National Statistical Yearbook and the remaining data are obtained from the NBS, provincial statistical yearbooks and the China Industrial Statistical Yearbook. The descriptive statistics of each variable is shown in Table 1.
Descriptive statistics.
(2) Spatio-temporal analysis of core variables
To illustrate the changes from the ICT development more intuitively, we analyse the spatio-temporal correlation between ICT and carbon emissions by using the absolute value of software and IT service industry revenue to represent ICT (denoted as ICT*), and by using carbon emissions intensity to represent CE (Figs. 2 and 3).
. Data sources: The data on ICT* is from the National Statistical Yearbook, and CE is calculated by summing up the carbon emissions of various energy sources based on the National Energy Statistical Yearbook.")
Annual changes in ICT development and average carbon emissions intensity (2010–2022).
Data sources: The data on ICT* is from the National Statistical Yearbook, and CE is calculated by summing up the carbon emissions of various energy sources based on the National Energy Statistical Yearbook.
. Note: CE denotes carbon emissions intensity, with a darker orange colour indicating strengthened carbon emissions intensity. According to different intensities, carbon emissions are divided into 0.001–0.5, 0.5–1.0, 1.0–1.5, 1.5–2.0 and 2.0–2.5 gradients, where the white colour indicates no data. ICT* indicates the ICT industry, with widening dots indicating that ICT industry development continues to increase, which is divided into 0–100, 100–1000, 1000–5000, 5000–10,000 and greater than 10,000, where white indicates missing data. 1Shanxi Province is denoted by shanxi, and Shaanxi Province is denoted by shaanxi, and the remaining provinces are denoted by their respective pinyin.")
Spatial distribution of ICT and carbon emissions intensity by province1 (2010, 2016, 2022).
Note: CE denotes carbon emissions intensity, with a darker orange colour indicating strengthened carbon emissions intensity. According to different intensities, carbon emissions are divided into 0.001–0.5, 0.5–1.0, 1.0–1.5, 1.5–2.0 and 2.0–2.5 gradients, where the white colour indicates no data. ICT* indicates the ICT industry, with widening dots indicating that ICT industry development continues to increase, which is divided into 0–100, 100–1000, 1000–5000, 5000–10,000 and greater than 10,000, where white indicates missing data.
1Shanxi Province is denoted by shanxi, and Shaanxi Province is denoted by shaanxi, and the remaining provinces are denoted by their respective pinyin.
Fig. 2 illustrates the annual changes in ICT development and CE from 2010 to 2022, revealing that the ICT industry has continuously developed from 2010 to 2022, with an overall rising trend, from 4295.6 million yuan in 2010 to 5393.004 billion yuan in 2022. CE intensity in 2010–2022 shows a decreasing trend, from 0.932 in 2022 to 0.526 in 2010, indicating a decrease of nearly 45 %. Overall, ICT development and CE intensity move in opposite directions.
To illustrate the spatial trajectory of CE and ICT development in various regions more clearly and intuitively, Fig. 3 uses ArcGIS software. Figures (a)–(c) reveal that the carbon emissions intensity of various provinces and regions declined significantly from 2010 to 2016 and in 2022, indicating that China has successfully advanced emissions reduction.
The ICT development speed in eastern coastal areas is more rapid than that in central and western regions. This may be attributable to the region’s superior economic development, stable infrastructure and more universities and research institutions, which provide good conditions for ICT development. Overall, with the exception of Jiangsu and Guangdong, other regions’ ICT revenue did not reach 1000 billion yuan in 2010. By 2016, Shandong Province’s ICT revenue exceeded 1000 billion yuan, and that of Beijing, Shanghai, Zhejiang, Fujian and other provinces exhibited significant growth, indicating that the ICT industry development trend in these regions continued to improve. In 2022, the ICT revenue in Beijing, Henan, Zhejiang, Jiangxi, Anhui, Shandong, Beijing, Chongqing, Sichuan, Shanghai, Fujian and other regions exceeded RMB 100 billion. Moreover, as shown in Fig. 3, with continuous ICT development, various regions’ overall carbon emissions intensity has continued to decrease.
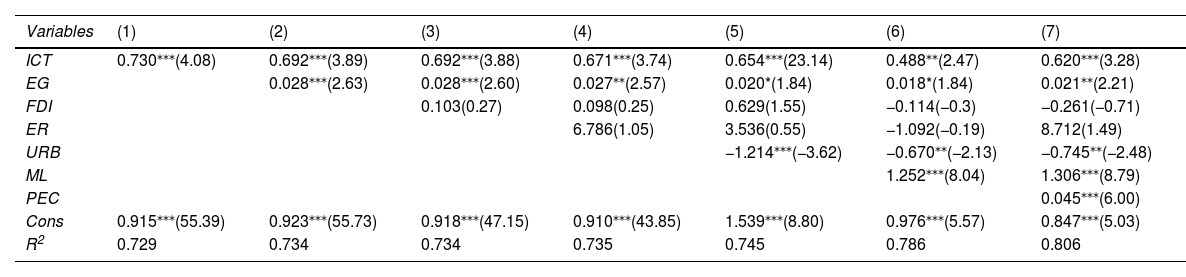
Empirical analysisPanel dual fixed effects model estimationWe first explore the relationship between local ICT and CE using a double fixed effects model prior to conducting the spatial analysis, and the results are presented in Table 2.
Panel double fixed effects model results.
Note: t-values are in parentheses; *,** and ⁎⁎⁎ denote significance at 10 %, 5 % and 1 % levels, respectively.
Table 2 reveals that as control variables are progressively introduced, the coefficients of the core variables do not change significantly and remain robust. The coefficient of ICT in column (1) is significantly positive, indicating that with only the core explanatory variables, every 1 % increase in local ICT industry development increases CE intensity by approximately 0.73 %. The final model (7) presents the estimation results after adding all control variables, and the results reveal that the coefficient of ICT remains significantly positive, and the impact of ICT industry development on CE intensity is positive. Comparing columns (1)– (7) reveals that the coefficients of the core variables are significantly high, which is likely due to the existence of spatial autocorrelation between regions, while the double fixed effects cannot estimate the spatial effects. Therefore, we further examine the relationship between ICT development and CE in each region using the SDM.
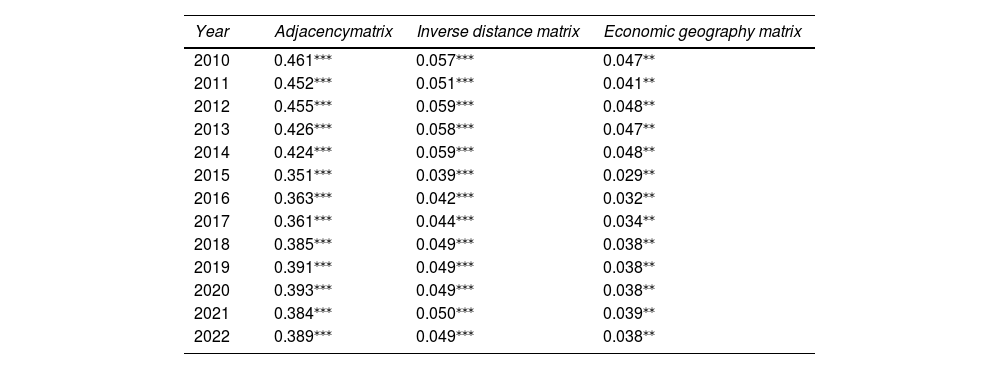
Spatial econometric model estimationSpatial autocorrelation testA spatial autocorrelation test is required prior to conducting spatial regression analysis. According to the results of the three spatial weight matrices of neighbour matrix, inverse distance and economic geography (as shown in Table 3 below), the Moran’s Index (Moran’s I) of CE intensity is significantly positive, exhibiting a significant positive relationship. Since CE intensity exhibits considerable correlation with economic development factors, we further apply the economic geography weight matrix to draw a local Moran’s I diagram.
Global Moran’s I of Chinese provinces’ carbon emissions intensity.
Note: *,⁎⁎ and ⁎⁎⁎ denote significance at 10 %, 5 % and 1 % levels, respectively.
Fig. 4 reveals that the Moran’s I of CE intensity in each province in 2010 and 2022 is primarily concentrated in the first and the third quadrant, exhibiting high and low agglomeration characteristics, indicating that CE intensity is a significant spatial factor.
Spatial measurement model selection
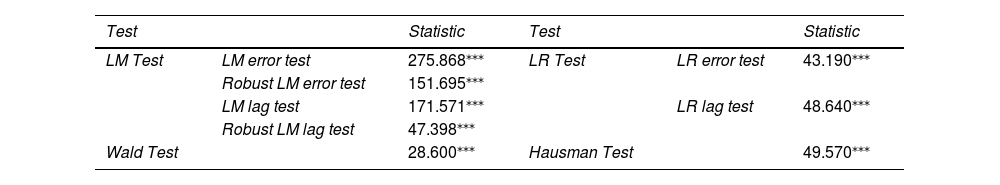
Before using the spatial model for regression, we determine which spatial regression model should be used. We adopt the Lagrange Multiplier (LM) test to determine whether the SDM can be used. The results in Table 4 reveal that the SEM and SAR model pass the test, indicating that the independent variable and the dependent variable are spatially correlated and the error term is also spatially correlated. Therefore, we use the SDM, which can simultaneously capture these characteristics. Second, we perform a likelihood-ratio (LR) test, and the results reveal that both significantly reject the original hypothesis at the 1 % level, indicating that bias may emerge when using the SEM and the spatial lag model to examine the spatial spillover effects of CE; therefore, the SDM is chosen.
LM, LR, Wald and Hausman tests.
Note: ⁎⁎⁎ denotes 1 % significance.
We also use the Wald test to determine whether the SDM will degenerate into the spatial lag model and the SEM. This passed the significance test, indicating that it would not degenerate, and confirming the final choice of the SDM. Finally, based on the SDM, the Hausman test to determine the use of fixed or random effects, the original hypothesis was significantly rejected at the 1 % level, and the fixed effects SDM is selected. The results are presented in Table 4.
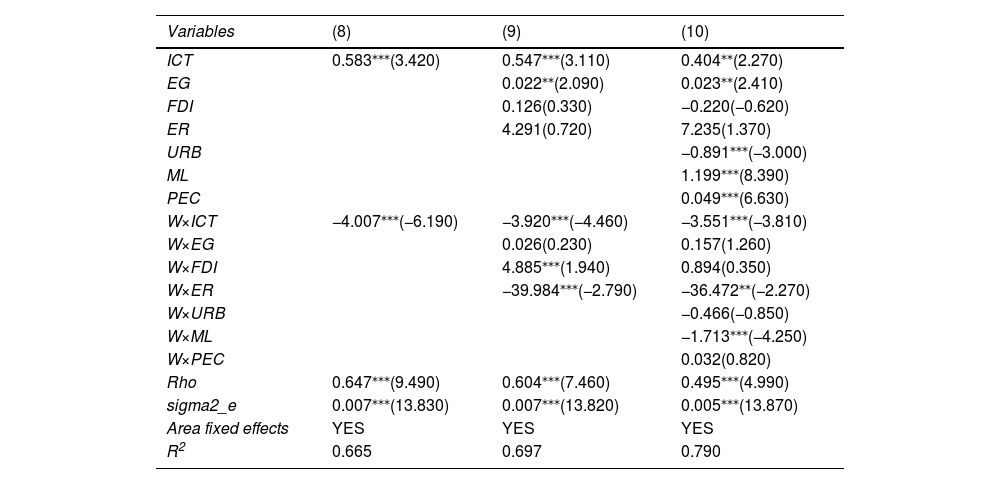
Benchmark regression resultsThe results in Table 5 reveal that the coefficients of ICT and W× ICT in column (8) are 0.583 and −4.007 respectively, both of which are significant at 1 % level, indicating that ICT industry development increases local CE (which coincides with the regression results in the previous section), and reduces CE in the surrounding area. For every 1 % growth in the region’s ICT industry, local carbon intensity will increase by 0.58 % and that of the surrounding region will decrease by about 4 %.
Benchmark regression results.
Note: t-values are in parentheses; *,⁎⁎ and ⁎⁎⁎ denote significance at 10 %, 5 % and 1 % levels, respectively.
The increase in local CE caused by ICT development may be attributable to ICT industry development requiring considerable infrastructure support such as communication base stations and data centres, which increases local CE. Moreover, areas with better ICT industry development host a large number of related industries, and ICT industry concentration results in local industrial specialisation, an influx of high-skilled labour and capital and frequent economic activities, which will further increase local CE. Furthermore, if the area of ICT industry concentration is dominated by coal power, it will directly increase local CE.
ICT development reduces surrounding areas’ CE because it can improve the surrounding areas’ energy utilisation efficiency through technology diffusion or promote industrial digital upgrading and reduce CE per unit output. For example, data centres in Inner Mongolia primarily rely on thermal power, which increases local CE but cloud computing services help enterprises in the surrounding provinces reduce the duplication of IT facilities, lowering overall national CE.
The coefficients of ICT and W× ICT do not change significantly with the progressive introduction of control variables, indicating that the estimation results are robust, and the signs of most control variables also largely align with our expectations. In addition, the coefficients of Rho in columns (8) – (10) are all significant at the 1 % level, indicating that CE have a spatial spillover effect.
To further identify the interaction in the spatial model, we further decompose the results of the baseline regression into direct, indirect and total effects, presenting the results in Table 6. The results reveal that the coefficient of ICT in column (11) is significantly positive, indicating that ICT development increases CE. ICT development significantly enhances the CE in local region, and the coefficient of ICT in column (12) is significantly negative at 1 % level, indicating that ICT development in the region can significantly reduce surrounding regions’ CE. That is, although the of ICT development increases local CE, it facilitates a significant reduction of CE in surrounding areas, indicating an obvious spatial spillover effect. The total effect results reveal a significantly negative coefficient of ICT, indicating that ICT development can reduce overall CE.
Spatial effects decomposition.
Note: t-values are in parentheses; *,⁎⁎ and ⁎⁎⁎ denote significance at 10 %, 5 % and 1 % levels, respectively.
To verify the robustness of our model and regression results, we refer to He and Gu (2025) and conduct the following robustness tests. 1) Replacing the explanatory variables by using the urban employment in the ICT industry (ICT2) as the representative variable of ICT to conduct the robustness test, which is standardised for this indicator. 2) Adjusting the sample period. As the overall economy was affected by the COVID−19 pandemic, we exclude the data from 2020 to 2022 for a robustness test. The specific results are presented in Table 7, revealing that the direction, size and significance of the coefficients of ICT and W× ICT in Columns (14) and (15) basically did not exhibit any significant changes, verifying that the benchmark regression results are robust.
Robustness test results.
Note: t-values are in parentheses; *,⁎⁎ and ⁎⁎⁎ denote significance at 10 %, 5 % and 1 % levels, respectively.
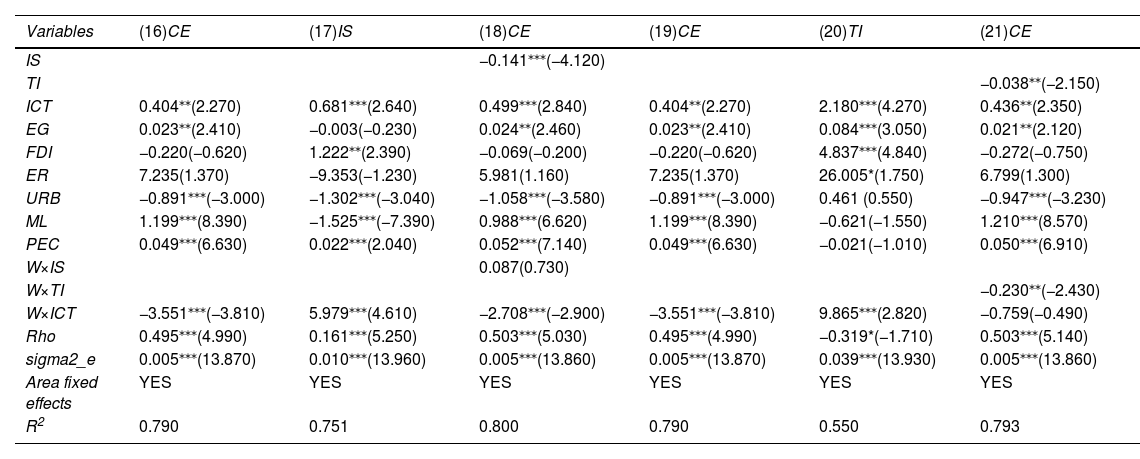
Based on our theoretical analysis and spatial mediation model, and referencing Wen and Ye (2014), we further analyse the intrinsic mechanism of the impact of ICT industry development on CE using step-by-step regression method, presenting the regression results in Table 8. The results in Table 8 reveal that the coefficient of ICT in column (16) is 0.404 and the coefficient of W× ICT is −3.551, both of which pass the significance test. This is consistent with the previous results, confirming that ICT development increases CE but decreases CE in surrounding areas.
Mediating effects test.
Note: t-values are in parentheses; *,⁎⁎ and ⁎⁎⁎ denote significance at 10 %, 5 % and 1 % levels, respectively.
The coefficients of ICT and W× ICT in column (17) are significantly positive, demonstrating that ICT development optimises local IS, which and indirectly reduces local CE. However, the coefficient of IS in column (18) is significantly negative but the coefficient of W× is insignificant, indicating that the mediating effect is only evident in the local area. In other words, no spatial spillover effect of is apparent. Therefore, ICT development can reduce local CE through IS optimisation but will not reduce the surrounding areas’ CE through this channel.
Column (20) of Table 8 reveals that the coefficients of ICT and W× ICT are significantly positive, indicating that ICT development can promote TI in local and surrounding areas through spatial spillover effects.
The coefficients of TI and W× TI in column (21) are significantly negative, indicating that technological innovation can reduce local and surrounding CE through spatial spillover effects. Furthermore, the results in column (21) reveal that the coefficient of ICT is significantly positive, and the coefficient of W× ICT is insignificant. This differs from the benchmark regression results, indicating that ICT development has a positive impact on local CE and a negative impact on surrounding CE. This implies that the inhibition effect of ICT development on CE in surrounding areas is generated through TI spillover effects. In other words, the spatial spillover effect of ICT itself does not reduce the surrounding areas’ CE, but ICT development promotes local TI, reducing surrounding areas’ CE through technology diffusion.
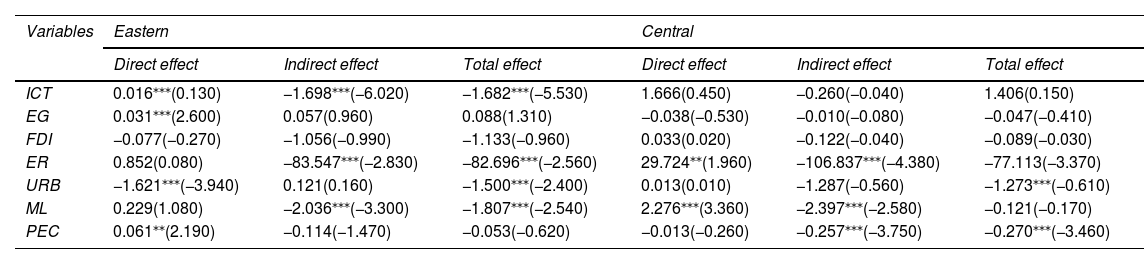
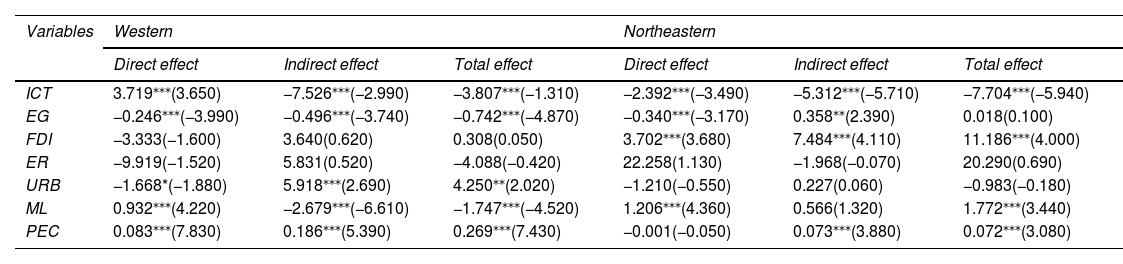
Heterogeneity analysisThe economic development and geographical environments of different regions have unique characteristics, which will lead to differences in the relationship between CE intensity and ICT development. Therefore, we examine the relationship between ICT and CE in different regions by dividing the 30 provinces into east, west, central and northeast regions according to the NBS division standard.8 The results are presented in Tables 9 and 10.
Decomposition of spatial effects in each region (1).
Note: t-values are in parentheses; *,⁎⁎ and ⁎⁎⁎ denote significance at 10 %, 5 % and 1 % levels, respectively.
Decomposition of spatial effects in each region (2).
Note: t-values are in parentheses; *,⁎⁎ and ⁎⁎⁎ denote significance at 10 %, 5 % and 1 % levels, respectively.
According to Tables 9 and 10, ICT development in western and eastern China positively impacts local CE, increasing local CE while decreasing that in surrounding areas. Overall, ICT development in the western and eastern regions has reduced CE, and ICT development in the western region has a more significant inhibitory effect on CE, which may be due to the eastern region having a better degree of economic development, a relatively diversified IS, a higher proportion of service and high-tech industries and a more balanced ICT development, resulting in a smaller spatial spillover effect from ICT development and the subsequent effect on CE reduction is also smaller.
ICT development in the central region has no significant impact on CE in local and surrounding areas. This is mainly because the central region includes Shanxi, Anhui, Jiangxi, Henan, Hubei, Hunan and other provinces and regions, where ICT industry development is relatively low, and most are experiencing labour outflows. Furthermore, economic development is relatively poor in the central region, and the inter-provincial economic ties are inadequate. Therefore, ICT development is difficult to radiate to surrounding provinces and regions, and the impact on CE in surrounding areas is relatively weak.
ICT development in northeast China has a suppressive effect on CE in local and surrounding areas. This is mainly because the northeast China is a traditional industrial area with a relatively homogeneous IS and the development of emerging industries dominated by the ICT industry can significantly optimise the local IS. In addition, ICT development can drive TI in local and surrounding areas, reducing CE.
To further explore the heterogeneity of the impact of ICT development on CE, we divide the 31 provinces, cities and districts into ICT industry-intensive areas and ICT industry-non-intensive areas according to the scale of ICT industry and perform separate regressions. According to the National Informatisation Development Report (2023), Zhejiang, Beijing, Shanghai, Guangdong, Jiangsu, Fujian, Shandong, Sichuan, Chongqing and Tianjin are among the top 10 provinces and cities in the country in terms of comprehensive informatisation development. Therefore, we consider these 10 provinces and cities as ICT industry-intensive areas, and the remaining provinces as ICT industry-non-intensive areas to compare the impact of ICT development on CE in the two types of regions.
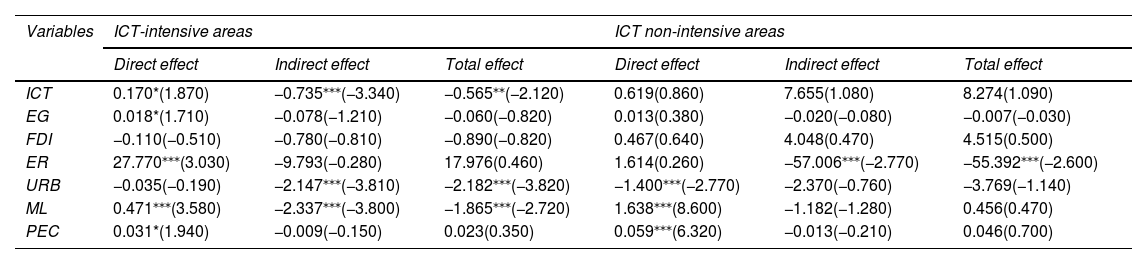
The results in Table 11 reveal that ICT development will increase local CE in ICT industry-intensive areas but will reduce CE in surrounding areas and overall CE. However, in ICT industry-non-intensive areas, the impact of ICT on CE is insignificant, demonstrating that in ICT industry-intensive areas, the CE in surrounding areas will be reduced through technology diffusion.
Spatial effects decomposition in ICT-intensive and ICT non-intensive areas.
Note: t-values are in parentheses; *,** and ⁎⁎⁎ denote significance at 10 %, 5 % and 1 % levels, respectively.
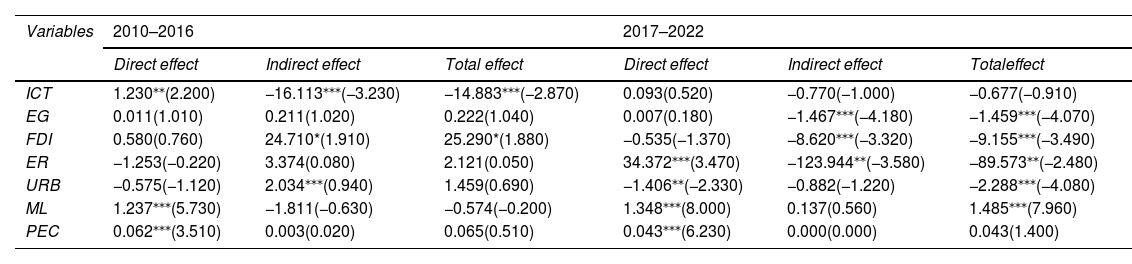
Across the expansive time span of our data, the scale and policy background of China’s ICT development have significantly changed during this period. Referring to Figs. 2 and 3 above, ICT development has significantly changed since 2016. To further explore the impact of ICT development on CE at different stages, we divide the time period into 2010–2016 and 2017–2022 for regression.
Table 12 reveals that the direct effect of ICT on CE was positive from 2010 to 2016, and the indirect effect was negative. This indicates that although ICT increases local CE, it suppresses CE in surrounding areas and reduces overall CE. Notably, the direct, indirect and overall effects of ICT on CE are insignificant from 2017 to 2022.
Staged regression results.
Note: t-values are in parentheses; *,⁎⁎ and ⁎⁎⁎ denote significance at 10 %, 5 % and 1 % levels, respectively.
The rationale for this outcome is as follows. On the one hand, although ICT has rapidly developed since 2016, the ICT manufacturing industry has dominated because the development of the ICT industry requires considerable information infrastructure. For example, a large number of data centres were built after 2016, which consume a large amount of energy. According to a report from Huajing Industrial Research Institute, China’s data centre electricity consumption has continued to rise since 2018, and by 2020, the country’s data centre electricity consumption accounted for 2.7 % of the nation’s electricity consumption.9 Therefore, the increased energy consumption associated with a large amount of information infrastructure construction is offset by reduced CE from ICT development.
On the other hand, the 2019–2022 COVID-19 pandemic weakened economic ties between regions, diminished the ICT spatial spillover effect and reduced the inhibitory effect on CE. Therefore, the impact of ICT development on CE was more significant in 2010–2016 than in 2017–2022.
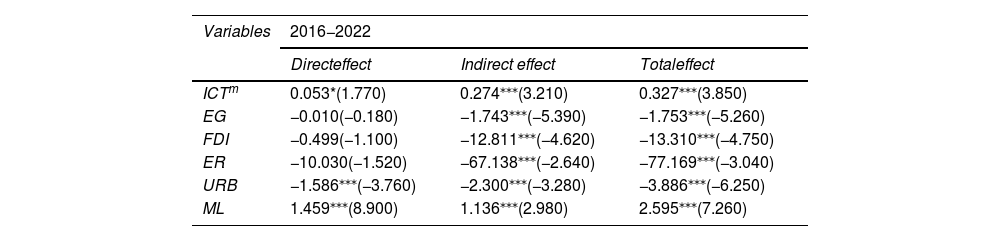
Different ICT sectors’ impact on carbon emissionsTo explore the impact of different ICT sectors on CE, we next examine the impact of ICT manufacturing (ICTm) (measured using the operating income of the computer, communication and other electronic equipment manufacturing industry) on CE intensity and compare the differences in the impact of ICT services and manufacturing on CE. The regression results are presented in Table 13 revealing that the coefficient of ICTm from 2016 to 2022 is significantly positive in direct, indirect and total effects, demonstrating that the ICT manufacturing sector increases CE intensity in the region and raises CE in surrounding areas. This may be because the core production links of the ICT manufacturing sector require considerable ICT infrastructure construction, high energy intensity and electricity consumption, raising CE in the region.
Regression results of ICT manufacturing sector.
Note: t-values are in parentheses; *,** and ⁎⁎⁎ denote significance at 10 %, 5 % and 1 % levels, respectively.
Moreover, starting from 2016, ICT manufacturing sector development relied on related supporting industries’ development. Based on this economic dependence effect, surrounding areas may have developed related supporting industries (such as packaging and logistics), and the increased CE from these related industries effects surrounding areas. In addition, with continuous ICT development, core cities have begun to focus on ICT research and development and design, transferred manufacturing links (such as electronic assembly and waste treatment) to surrounding underdeveloped areas and establishing a pollution haven effect that will also increase CE intensity in surrounding areas. For example, the Yangtze River Delta urban agglomeration moved printed circuit board production to Anhui and Jiangxi, raising the latter’s industrial CE.
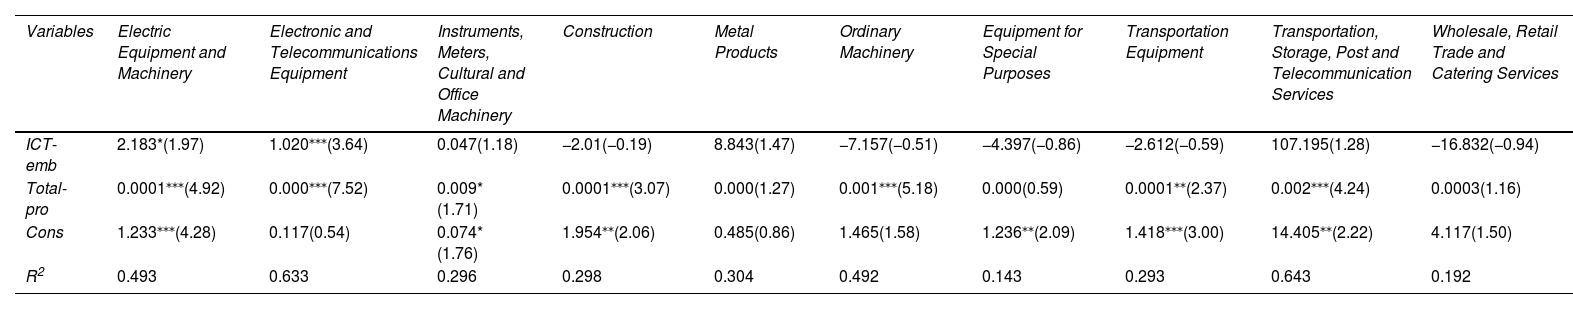
Impact of ICT development on carbon emissions in various industriesTo explore the impact of ICT on CE in various industries, we calculate the ICT input ratio of each industry based on the industry input–output table10 from each province, quantifying the proportion of ICT input to all inputs of the industry output. According to the proportion of ICT input, we select the top 10 industries with the highest ICT input rate and use the panel data fixed effects model to perform regression, taking each industry’s ICT input rate as the independent variable, CE as the dependent variable and output as the control variable. The results are presented in Table 14. ICT input is represented by ICT-emb and the industry’s total output is represented by Total-pro.
The impact of ICT on industry carbon emissions.
Note: t-values are in parentheses; *,⁎⁎ and ⁎⁎⁎ denote significance at 10 %, 5 % and 1 % levels, respectively.
Table 14 reveals that only Electric Equipment and Machinery and Electronic and Telecommunications Equipment industries passed the significance test, and the coefficient of ICT-emb is positive, indicating that ICT increases the CE of these two industries. This may be due to other industries’ low ICT input rate, with limited impact on CE, or it may be that only a few companies in most industries such as Conch Cement, Jiangsu Yonggang and ZEEKR noted above use ICT to reduce CE but most companies have not yet reduced emissions using ICT.
Moderating effect of energy structureSince the ICT industry is characterised by high energy consumption, the regional energy structure will affect ICT industry distribution. For example, China’s strategic deployment of East Data and West Computing was intended to leverage the energy advantages of the west and establish data centres in western regions such as Guizhou, lowering the ICT industry’s energy consumption. To examine the moderating effect of regional energy structure changes on ICT emissions reduction, the proportion of coal-fired power (measured by the proportion of thermal power generation in total power generation, expressed as Procoal-fired) is introduced into the panel fixed effect model from Subsection 4.1 for analysis and regression. The regression results are presented in Table 15 below.
Moderating effect of energy structure.
Note: t-values are in parentheses; *,⁎⁎ and ⁎⁎⁎ denote significance at 10 %, 5 % and 1 % levels, respectively.
When the ICT coefficient in the main effect is significantly positive, if the coefficient of the Procoal-fired moderating variable is significantly positive, and the coefficient of the Procoal-fired × ICT interaction term is negative, indicating that ICT and Procoal-fired have an obvious substitution relationship in affecting CE. This indicates that the CE reduction effect of ICT may be more effective in areas dominated by coal burning (high Procoal-fired), offsetting the high energy consumption of ICT itself, whereas the CE reduction effect of ICT is limited in areas dominated by clean energy (low Procoal-fired), and its own energy consumption becomes the main contradiction.
Conclusions and policy recommendationsResearch conclusionsICT development increases local CE and reduces surrounding CE but lower overall carbon intensity. ICT development can indirectly reduce local CE by promoting IS upgrading and TI. TI has a significant spillover effect, wherein ICT development reduces surrounding regions’ CE through the spatial spillover effect generated by TI, but the spatial spillover effect of IS optimisation is not obvious.
Heterogeneity tests show that ICT development in the western and eastern regions can increase local CE but reduce surrounding regions’ CE. In general, ICT development in western and eastern regions reduces CE, and the CE reduction effect in the western region is better than that in the eastern region. ICT development of in northeast China can reduce CE locally and in surrounding areas, and ICT development in the central region has no significant effect on local and surrounding CE.
We also divide 31 provinces into ICT industry-intensive areas and non-intensive areas according to ICT development level and conduct separate regressions. The findings reveal that ICT increased local CE in ICT industry-intensive areas, but reduced CE in surrounding areas and overall CE. In contrast, the impact of ICT on CE was insignificant in ICT non-intensive areas.
We then conduct staged regression and compare the impact of ICT manufacturing and ICT service sectors on CE. Staged regression reveals that ICT development during in 2010–2016 had a greater inhibitory effect on CE intensity than in 2016–2022. Furthermore, the impact of the ICT manufacturing sector on CE differs from that of the ICT service sector. The ICT manufacturing sector not only increases local CE but also increases CE in surrounding areas, and the ICT service sector increases local CE but reduces CE in surrounding areas, reducing overall CE. The industry-specific regression results reveal that ICT development has increased CE in electrical equipment and machinery and electronics and telecommunications equipment industries but has had no significant impact on CE in other industries.
Finally, we analyse the moderating effect of energy structure on ICT’s impact on CE, demonstrating a substitution effect between the impact of energy structure and ICT development on CE. In areas where the proportion of coal burning is high, the CE reduction effect of ICT may be more effective, while in areas where the proportion of coal burning is low, the CE reduction effect of ICT is limited.
Policy recommendationsStrengthen regional cooperation and establish a cross-regional carbon compensation systemThis study demonstrated a certain correlation between CE between regions. For example, central cities or regions can transfer CE to other regions through industrial transfer. Therefore, the government should cooperate with enterprises, universities and research institutions to establish a cross-regional carbon compensation system. The government should establish a carbon database to track the dynamic changes and carbon footprints of various regions, industries and enterprises to make the carbon compensation mechanism more scientific. When surrounding areas accept the ICT industries of central regions or cities, they can require central regions or cities to provide certain compensation in terms of CE reduction based on the established carbon database.
Promote industrial structure adjustment and increase green innovation inputsOptimising the IS and enhancing scientific and TI levels can significantly reduce CE intensity. Therefore, the government should actively promote IS transformation to low carbonisation through policy guidance and market mechanisms. Specifically, the government should incorporate green GDP considerations into local government officials’ performance evaluation system and provide financial subsidies or tax incentives to enterprises that reduce energy consumption per unit of output value. In addition to this, the government can promote green technology innovation through low-carbon policies, encouraging economic actors to advance green transformation (Wang et al., 2023; Yu, Peng, Yuan, Li & Shi, 2023). For example, the government can impose carbon taxes on CE in a timely manner and use the tax revenue to support clean energy projects and mitigate climate change.
Differentiate local economic policies and optimise data centres’ layoutTo advance China’s dual carbon goal, ICT development should be actively encouraged in the northeastern and IT (e.g. industrial internet, AI) should be used to transform the traditional industries, improve energy use efficiency and reduce traditional industries’ CE. In the eastern region, duplicate construction of data centres should be avoided in the Yangtze River Delta, Pearl River Delta and other regions with high economic integration, full consideration should be given to the IT industry’s CE and the proportion of clean power use should be increased. For the central and western regions, CE should be reduced by actively promoting ICT development, strengthening the links between local economies through regional integration policies and fully leveraging IT industries’ spatial spillover effects.
LimitationsAlthough the study examines the impact of ICT on CE from multiple dimensions, it still has some limitations. First, the ICT diffusion path obviously differs from traditional technology as it is based on network diffusion. Due to length limitations, this study does not quantify the technical diffusion path of ICT and does not conduct an empirical analysis of the relationship between its diffusion path and CE, which is a future research direction.
Second, this study does not introduce a detailed case comparative study because it is difficult to obtain case data. Analysing the impact of ICT on CE through case studies is also the future research direction.
CRediT authorship contribution statementXiaoqin Zheng: Methodology, Formal analysis, Conceptualization. Tian Liu: Software, Resources. Wenli Xu: Validation, Formal analysis.
We have no known competing financial interests or personal relationships that could have appeared to influence the work reported in this paper.
Shanxi Finance and Taxation College, Taiyuan City, Shanxi Province, China (Xiaoqin Zheng)
Carbon Emissions Report 2023, published by the IEA.
China ICT 2023 Research Report.
China’s social electricity consumption in 2020 data from National Energy Administration.
ICT Industry Innovation and Development White Paper (2020), China Academy of Information and Communications Technology (CAICT)
Research Report on the Development of China’s Digital Economy (2024), China Academy of Information and Communications Technology (CAICT).
Notably, the data used for the ICT explanatory variables include the proportion of revenue from the software and IT service industry to GDP. The only exception is in the Subsection 4.6 Further research, where we use operating income data of the ICT manufacturing industry to distinguish the impact of ICT manufacturing and services on carbon emissions.
The eastern part of the country includes Beijing, Tianjin, Hebei, Shanghai, Jiangsu, Zhejiang, Fujian, Shandong, Guangdong and Hainan; the central region includes Shanxi, Anhui, Jiangxi, Henan, Hubei and Hunan; the western region includes Inner Mongolia, Guangxi, Chongqing, Sichuan, Guizhou, Yunnan, Xizang, Shaanxi, Gansu, Qinghai, Ningxia and Xinjiang; and the northeastern region includes Liaoning, Jilin and Heilongjiang.
articles