


The continuous expansion of income disparities poses serious threats to sustainable socioeconomic development. Concurrently, as a key driver of technological advancement, the influence of innovation on shaping income inequality trends has been extensively debated. This study employs panel structural vector autoregression to examine the complex effects of innovation on income inequality using panel data from 59 countries spanning 1995–2021. The two-stage empirical analysis reveals that innovation shocks negatively affect income inequality in developed countries while positively impacting it in developing countries. Further qualitative investigations indicate that differences in developed and developing countries’ institutional guarantees may be a key reason for this distinction. We also determine that innovation only accounts for a small proportion (≤8 %) of the causes of income inequality changes in either case, and fluctuations in and solidification of income distribution patterns are the most significant influences within the scope of this study. Recommendations include strengthening institutional guarantees to ensure equitable distribution of innovation benefits, enhancing educational attainment, and promoting targeted skills training programs to bridge workforce skills gaps. By addressing these issues, policymakers can develop more effective strategies to balance the pursuit of innovation and the imperative goal of improving income distribution.
The continuous spread and expansion of income inequality have aroused long-term vigilance and concern of many governments and all sectors of society worldwide (Tang et al., 2022). Growing public confusion and discontent concerning this trajectory highlight the urgency of addressing the inequality problem. Severe income inequality can foment complex issues that cascade from the bottom up. Not only will poverty and social exclusion at the household level increase (Davidescu et al., 2022), but stability and cohesion at the societal level will also be significantly reduced, and the process of human development may even be impeded (Brzezinski, 2018). The destructive nature of expanding income disparity is reflected in the exacerbation of the existing social ills and the spawning of new dilemmas. Researchers and practitioners are actively seeking effective approaches to eliminate the threat of inequality in pursuit of sustainable development. This requires identifying the causes of its formation and deterioration and taking appropriate measures to address them.
Over the past few decades, the notion that innovation is a primary catalyst for economic growth and progress has become widely accepted. Innovation capabilities ensure that a country has vigorous momentum for long-term development (Gürlek and Tuna, 2018). Innovation is often associated with higher productivity, competitiveness, and job creation (Zhu et al., 2021), which positively affects individuals, businesses, and communities. However, the benefits of innovation are not always shared equitably among stakeholders, particularly those who have less chance for their voices to be heard than others. Growing concerns have emerged that these circumstances may contribute to widening the income gap (Sinha et al., 2020). A growing body of literature focuses on the interplay between innovation and income inequality, as both are crucial for nations’ long-term prosperity and stability. Achieving a balance between these two factors is a prerequisite for ensuring sustainable development. Moreover, the debate regarding the effect of innovation on income inequality remains inconclusive, with research conducted across various metrics and empirical contexts generating conflicting findings.
In the quest for progress and breakthroughs, while addressing the social issue of income inequality, attempts are made to explore innovative initiatives from various perspectives that can consider multidimensional needs. For example, as resources are diminished and environmental concerns intensify, a global push toward more energy-efficient and environmentally friendly approaches to development. As a result, concepts such as green innovation, environmental innovation, and energy innovation are gaining increased attention (Vona and Patriarca, 2011). Dong et al. (2022) suggested that governments can raise the benefits of energy efficiency by promoting technological evolution and green innovation to reduce income inequality and energy poverty simultaneously.
Comparatively, we are more familiar with the relevant theories of technological innovation and have long felt the big and small changes it brings to our daily lives. Undoubtedly, it has significantly contributed to economic performance, overall life quality, and job creation (Gagliardi et al., 2016). However, not everyone can adapt swiftly and securely to novel concepts and new processes to capitalize on fresh prospects amid profound technological change. Many individuals still need to catch up with each round of technological innovation, particularly those with initially low standards of living. Without proper guidance and support, the gap between the rich and the poor will widen and become more comprehensive amid factor-biased technological change (Violante, 2008).
While a consensus has emerged that innovation has a crucial influence on the dynamics of income inequality, researchers must also analyze it in combination with specific backgrounds to explore the extent to which innovation affects income distribution, how it does so, and at what scale. Industrial revolutions typically lead to swift advances in productivity, economic expansion, and population growth in developed nations like the United States (US) (Kemeny et al., 2025). The advantages and disadvantages of technological change become evident in these economies earlier and more dramatically. Around the 1980s, member states of the Organization of Economic Co-operation and Development, including the US and United Kingdom, suffered from rising unemployment and wage inequality as consequences of skill-biased technological change (Berman et al., 1998; Weiss and Garloff, 2011). The impacts of large-scale technological innovation are much more far-reaching, and its effect on income distribution must be dealt with in the long run. However, it is essential to acknowledge that developed countries have the advantage of making expedient economic and institutional preparations based on practical experience due to previous knowledge and established infrastructure.
Developing countries also grapple with the challenge of addressing the effects of innovation on income inequality and adapting to these changes. While these countries need to catch up to developed countries in terms of innovative strength and indigenous innovation output, they are also under pressure from the persistent problem of income inequality (Pi and Zhang, 2018). The competitive international environment is pushing many developing countries to pursue core technologies, expand into international markets, and enhance their national economic strength to secure more rights and interests and narrow the gap with other countries. Therefore, despite the fact that income inequality violates the principles of people-oriented development and poses challenges to sustainable development, some developing countries still continue to encourage innovation to achieve their goals (Montenegro et al., 2021). In other words, different developing countries may pursue distinct strategic pathways when weighing the priorities of innovation and income inequality, based on unique circumstances and urgent needs (Gharleghi and Jahanshahi, 2020).
The relationship between innovation and income inequality involves heterogeneous and complicated forms as economies develop diverse fundamental conditions under various choices; therefore, it is not expected to be uniform. Nevertheless, given the strategic significance of the two and their relationship to sustainable national development, this study conducts an empirical study of the association between innovation and income inequality using the panel data for 59 countries. As the portrayal and selection of the research context shape the conclusions, we divide the sample into developed and developing countries and analyze both in detail using the panel structural vector autoregression (PSVAR) model. This approach enables us to make cross-Section l comparisons and determine how economic development affects the impact of innovation activities on changing income inequality directions.
The contributions of this study are threefold. (1) We conduct impulse response and variance decomposition analyses on panel time series data from developed and developing countries to reveal the dynamic impacts of innovation on income inequality. (2) The empirical results demonstrate that innovation shocks adversely affect income inequality in developed countries, with a positive effect in developing countries. However, innovation accounts for a relatively small share of the causes driving income inequality changes in both cases. (3) Based on the comparison of the conclusions obtained from the two samples, we further investigate whether institutional guarantees have increased the operability of leveraging innovation to improve income inequality, proposing corresponding policy recommendations.
The remainder of this study is organized as follows. Section 2 provides a comprehensive review of relevant theoretical and empirical studies and develops our research hypotheses. Section 3 describes the study’s data source, variable setting, and empirical model, and illustrates the overall research framework. Section 4 presents the results of the impulse response and variance decomposition analyses for developed and developing countries. Section 5 further examines the complex relationship between innovation and income inequality revealed by our empirical findings and proposes corresponding policy implications. Finally, Section 6 summarizes the work completed in this paper.
Theoretical background and hypotheses developmentIncome inequality and innovationIncome inequality is a long-term global challenge of considerable importance. Exploring the determinants of income inequality and identifying appropriate preventions and solutions based on different economies’ characteristics, including economic, social, geographical, demographic, environmental, and many other aspects, is a significant challenge for countries at all levels of development (Song et al., 2021; Khatatbeh and Moosa, 2022). Debates surrounding this issue have continued for a significant time, and the scope and intensity of these discussions is expanding in response to the increasingly complex international landscape, resulting in a large and rapidly growing body of literature on the topic.
The formation and exacerbation of unequal distribution and income across various classes or groups involve a wide range of influencing factors. Common explanations for this phenomenon include changes in labor market demographic composition, economic restructuring, technology, institutional structure, globalization, and financial development (Morris and Western, 1999; Breau and Rigby, 2010; Law et al., 2020). For example, Berman and Aste (2016) present a quantitative analysis framework to measure the impact of mass immigration on economic inequality in Western countries. The authors find that the direct effect of immigration on income inequality is negligible in most cases, while immigration growth may significantly reduce inequality under certain conditions. In contrast, Slettebak (2021) analyzes panel data from 2005 to 2016 in Norway, determining that labor migration contributes to the increase in income inequality. Moreover, in contrast to alternative perspectives, researchers consistently endorse the perspective that higher female labor force participation in the market improves income inequality (Elgin and Elveren, 2021; İşcan and Lim, 2022).
In addition to studies that address single-element effects, richer results emerge from investigations of the dynamics of income inequality under the combined effects of multiple elements. For example, Bogliaccini (2013) argues that increased trade liberalization promotes deindustrialization, increasing inequality. Likewise, Kollmeyer (2018) contends that financialization, public sector austerity, and unemployment induce income inequality while de-unionization further widens inequality in the context of deindustrialization and offshoring. Moreover, technological change, globalization, and policy measures are often considered and examined concurrently, given their extensive impact and complex correlations (Nolan and Valenzuela, 2019; Tica et al., 2022; Zhuang, 2023).
As technology advances, the means of production and life undergoes radical changes, and the income distribution mechanism and its rationality are under rising scrutiny and investigation amid the continuous impact of transitions from the old to the new. Therefore, innovation as a critical driver for stimulating technological change and economic growth receives broad attention for providing relevant ideas and outcomes (Cetin et al., 2021; Kemeny et al., 2025).
Accordingly, innovation is also recognized as a non-negligible factor of income inequality, with several studies on the dynamic interrelation between the two. Studies such as Law et al. (2020) and Aghion et al. (2019) demonstrate positive correlations between innovation and income inequality, whereas some scholars come to the opposite conclusion (Antonelli and Gehringer, 2017; Tchamyou et al., 2019). For example, Kanwal and Eyisi (2023) find a significantly negative correlation between frontend innovation and income inequality using gross value added to measure frontend innovation. Notably, the relationship between various types of innovation and income inequality is inevitably affected by how they are measured and the specific research backgrounds. For instance, Sinha et al. (2020) demonstrate three distinct effects of energy innovation on income distribution across countries in the Next 11 group alone.
Many theoretical frameworks are proposed, applied, and extended in related research to explain the complex and multidimensional relationship between innovation and income inequality. One of these is the skill-biased technological change (SBTC) hypothesis, which holds that the emergence and development of new technologies are more conducive to raising the demand for skilled labor relative to unskilled labor, eventually widening the wage gap between them (Card and DiNardo, 2002; Acemoglu and Autor, 2011). For example, Violante (2008) finds that the increasing wage disparity between skilled and unskilled workers since the mid-1970s has coincided with the rapid advancement of information and communication technology (ICT). The author explains that the vital element of SBTC is the synergy between technology and skills, which can also be described as the interplay between capital and skills, human capital development, and the adoption of skill-oriented organizational structures.
Based on this hypothesis, researchers engage in extensive theoretical research to disentangle the multiple approaches by which technological innovation worsens income inequality. Berman et al. (1998) reveals that pervasive SBTC around the world would release low-skilled workers from industries, raising the global supply of unskilled-intensive products and reducing their relative wages. Weiss and Garloff (2011) demonstrate that the SBTC increases unemployment for unskilled workers when social benefits are endogenous. Jung et al. (2017) applies a computable general equilibrium model (GEM) to investigate the effects of factor-biased technology innovation on economic systems. The authors find that the economic growth achieved with SBTC favors high-skilled labor and deepens income inequality. Similarly, Pi and Zhang (2018) use GEMs to explore the impacts of SBTC on skilled and unskilled workers’ wage inequality in developing countries, demonstrating consistent conclusions that an increased magnitude of SBTC widens wage inequality in the basic model and several extended models considering five diverse cases.
The superstar firm hypothesis is another theory for explaining the relationship between innovation and income inequality. Superstar firms are the most productive companies in each industry, with above-average markups and below-average labor shares (Stiel and Schiersch, 2022). Initially proposed by Autor et al. (2020), this hypothesis offers a new explanation for the decline of value added labor share based on the rise of superstar firms. Valuable insights into the link between innovation and economic inequality can be gained through research related to this theory.
On the one hand, companies with outstanding competitiveness gradually occupy a large share of the market under superior efficiency and innovation capabilities (Abraham and Bormans, 2020), triggering a series of chain reactions such as higher market concentration, lower labor income share, and expanded wage inequality (Fernández-Villaverde et al., 2021). Superstar firms erect various competition barriers to crowd out new entrepreneurs, secure their dominant positions, and protect the profits generated by their innovations (Gordon, 2021). As a result, large enterprises with an innovative edge, e.g., high-tech companies such as Google, Amazon, and Microsoft can reap a significant share of the benefits of innovation, resulting in a disproportionate concentration of capital and income (Autor et al., 2017). This concentration of earnings and wealth is likely to increase income inequality when workers and other stakeholders do not share the benefits of innovation equitably.
On the other hand, superstar firms can positively impact the economy by boosting productivity and lowering consumer prices, which aids a broader population (Ai et al., 2020). In fiercely competitive industries, companies usually prioritize innovation to gain competitive advantage (Gürlek and Tuna, 2018). However, the first-mover advantage is eventually defused by imitation (Makadok, 1998). When innovative technology is transferred to other companies, individual firms’ innovation could effectively improve overall productivity, benefiting the industry as a whole (Hafeez et al., 2020). Therefore, how leading enterprises’ innovative activities affect income distribution depends on whether the benefits created by innovation are allocated equitably to stakeholders and whether the range of groups benefiting from innovation achievements can be expanded as much as possible (Breau et al., 2014). With the active collaboration of enterprises, industry, and government, innovation has the potential to promote income equality.
The relationship between innovation and income inequality is examined from various perspectives in many relevant theoretical and empirical studies, but full consensus is yet to be reached. Moreover, the interplay between the two cannot be isolated from the specific economic background, nor is it immutable. Therefore, this study diverges from common thinking using real-time data and endeavors to obtain additional insights under various conditions to provide more valuable practical references. As previously described, this study considers developed and developing country contexts and uses panel time series data to empirically analyze the nature of innovation’s impact on income inequality. Additionally, we engage in further exploration to examine the underlying factors driving the observed results.
Hypotheses developmentOur literature review revealed that the numerous studies on the relationship between innovation and income inequality yield divergent results. According to the SBTC hypothesis, some studies suggest that biased technological change favors skilled labor over unskilled labor, increasing wage inequality. This hypothesis contends that innovations in ICT or biotechnology tend to require workers with higher education levels and more sophisticated training (Violante, 2008; Lee & Song, 2022), resulting in higher demand for skilled workers and higher pay for those workers. Therefore, we propose the following research hypothesis:
H1 Innovation is positively associated with income inequality.
However, some studies demonstrate that innovation could have positive effects on promoting more equitable income distribution. Specifically, innovation promotes the creation of new industries and the development of small and medium-sized businesses (Aghion et al., 2016), which increases employment opportunities and economic growth that benefits all people and society. If the benefits are equitably shared, superstar firms’ innovations can enhance industry-wide productivity, reduce consumer prices, and improve people’s quality of life. In this regard, we propose the second research hypothesis:
H2 Innovation is negatively associated with income inequality.
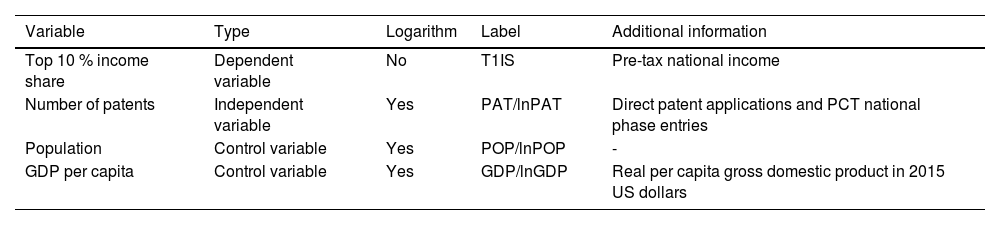
To investigate the relationship between innovation and income inequality, we conduct an empirical analysis using a sample of 59 countries from 1995 to 2021. The annual data obtained from the World Inequality Database (WID) on January 29, 2023, include countries’ top 10 % income share, the number of patents, population, and gross domestic product (GDP) per capita.
The top 10 % income share represents the proportion of total national income held by the wealthiest group, in this case, the top 10 % (Hartwell et al., 2022). Similar indicators such as the top 1 % or 5 % income share and the bottom 10 % or 50 % income share are often applied in relevant studies to measure the economic inequality phenomenon (Piketty et al., 2019; Chancel et al., 2023). In this study, we choose the top 10 % income share as the proxy variable for income inequality across countries. Correspondingly, we use the number of patents, i.e., the total patent applications (direct and Patent Co-operation Treaty national phase entries), as the proxy for innovation in our empirical analysis.
The emergence and extent of income inequality under different social contexts are attributable to complex combinations of multitudinous elements. Apart from innovation, population change (Rougoor and Van Marrewijk, 2015; Butler et al., 2020) and GDP per capita (Gil-Alana et al., 2019) are also two significant factors that have long been considered to be closely associated with income inequality. To reflect the impact of the innovation effect on income inequality in the empirical results more logically and reliably, we include total population and GDP per capita as control variables in the research model.
Table 1 presents further details about the variables in this study. We transformed all variables into natural logarithms except for the top 10 % income share.
Description of the variables.
Source: Authors’ summary.
As economic inequality varies across economies at different development levels, we do not generalize the relationship between innovation and income inequality under different economic conditions. Therefore, we divide the sample of 59 countries into two groups based on the International Monetary Fund World Economic Outlook (2022), comprising 31 developed countries and 28 developing countries, as shown in Table 2. Conducting empirical analysis on the perfectly balanced panel time-series data for two separate groups of countries enables us to explore the effect of innovation on income inequality in more specific contexts and compare the two sets of results for additional insights.
Groups of the sample countries.
Source: IMF World Economic Outlook (2022).
As noted, this study uses the PSVAR model (Pedroni, 2013) to analyze the correlation between innovation and income inequality. The PSVAR model allows all variables in the system to be endogenous and can estimate purely exogenous shock dynamics (Góes, 2016). Additionally, it improves not only the panel estimations by specifying intersectoral heterogeneities across the entire response dynamics but also the intertemporal estimations (Zhou et al., 2019). Using this approach, the orthogonality conditions that arise from standard forms of structural identification allow the decomposition of unobserved structural shocks into idiosyncratic and common components in a way that can be conducted for relatively short panels (Hao et al., 2017).
To do so, our empirical model considers a vector yi,t of four endogenous variables, encompassing the top 10 % income share (T1IS), the log of the number of patent applications (lnPAT), the log of population (lnPOP), and the log of GDP per capita (lnGDP), with subscript i denoting panel unit and t denoting time period. Following Pedroni (2013), we construct the following heterogeneous PSVAR model (Skare et al., 2021; Wang et al., 2022):
where Bi is a contemporaneous coefficient matrix, Ai(L)=∑j=0JiAjiLj is a lagged polynomial with country-specific lag length Ji, and Aji is a coefficient matrix. εi,t is a vector of composite shock with white noise that takes the following form:where ε‾.,t is a vector of common shocks with white noise, and ε˜i,t is a vector of idiosyncratic shock with white noise.

The composite white noise errors are as follows:
where Λi is a diagonal matrix with loading coefficients.
A composite structural shock vector with white noise takes the following form:
where λilnPAT and λiy denote the country-specific loading for the common structural shocks.

This study applies long- (Blanchard and Quah, 1989) and short-run (Keating, 1996) identifying restrictions (recursive) to acquire structural shock estimates for composite, common, and idiosyncratic shocks. We also compute bootstrapped standard errors for the 25 %, median, and 75 % responses with Monte Carlo 500 repetitions. Based on the PSVAR model code in EViews (Góes, 2025; Luvsannyam, 2018; Luvsannyam et al., 2021), we determine how innovation shocks on income inequality transmit across countries and globally by estimating the impulse responses of T1IS to a unit shock when lnPAT shock occurs.
Fig. 1 illustrates the framework of this study, wherein we analyze two groups of panel data from both developed and developing countries using the PSVAR model. The study investigates the various possible effects of innovation on income inequality considering total population and GDP per capita.
Empirical results
In this section, we present the basic statistical characteristics of the sample data and conduct tests to confirm the stationarity of our variables. On this basis, we further capture the relationship between innovation and income inequality in developed and developing countries through impulse response and variance decomposition analyses.
Preliminary analysisDescriptive summaryTable 3 summarizes the descriptive statistics of the variables for the two groups. Observing the performance of all variables in terms of mean, standard deviation (SD), maximum and minimum enables us to understand the distribution and volatility of the sample data. The variables’ mean and SD values are within acceptable ranges, indicating that both data sets are relatively concentrated and stable. However, circumstances in which high-income groups account for a disproportionate share of national income is more pronounced in developing countries than in developed nations, while total patent applications are relatively higher in developed countries. These discrepancies again remind us of the necessity of separately examining how innovation activities affect income inequality in developing and developed countries.
Descriptive statistics of variables.
Source: Authors’ analysis.
Using scatter plots and linear regression lines, we visually depict the relationship between T1IS and the relevant factors in the model, then present the results for developed and developing countries in Fig. 2 (a) and Fig. 2 (b), respectively. The descriptive evidence reveals that total patent applications, population, and GDP per capita correlate with the economic inequality predicament of the countries in both groups. As any of these factors increases, the top income share exhibits a certain degree of expansion or contraction. Considering the research purpose of this study, we focus on the correlations between T1IS and the number of patents in the figures. The relationship between them is positive for developed countries, yielding a correlation coefficient of 0.2671. The association is also positive for developing countries, with a correlation coefficient of 0.1672. The impact of innovation on income inequality varies across economies at different development levels, which may be attributable to the synthetic action of economy, technology, and demographic structure. Therefore, we use the PSVAR estimation, which accommodates complete heterogeneity across countries, to further examine the dynamic relationship between income inequality and innovation in each context.
Panel unit root tests. Developed countries. (b). Developing countries. Source: Authors’ analysis. Notes: The red lines represent the linear regression lines, and the shaded areas represent the 95 % confidence interval.")
Before proceeding with formal model estimation, we perform unit root tests on the panel data to ensure all variables’ stationarity. We apply LLC (Levin et al., 2002), IPS (Im et al., 2003), ADF–Fisher (Choi, 2001), and PP–Fisher (Choi, 2001) tests simultaneously to achieve this purpose. The LLC test is used to detect common roots in panels, while the last three are more suitable for unit root tests in heterogeneous panels. Therefore, we primarily refer to IPS, ADF–Fisher, and PP–Fisher test results. The results of these unit root tests for each variable are presented in Table 4. The null hypothesis of all four tests is that all panels contain unit roots, and all variables in both sample groups can reject more than half of the null hypotheses of the involved tests at 1 %, 5 %, or 10 % confidence levels. That is, all variables are sufficiently stationary for further PSVAR model estimation.
Results of panel unit root tests.
| Variable | LLC test | IPS test | ADF-Fisher test | PP-Fisher test | |||||
|---|---|---|---|---|---|---|---|---|---|
| statistic | p-value | Statistic | p-value | statistic | p-value | statistic | p-value | ||
| Developed countries | T1IS | 1.4707□ | 0.9293 | -4.0059° | 0.0000⁎⁎⁎ | 168.8824□ | 0.0000⁎⁎⁎ | 128.2133° | 0.0000⁎⁎⁎ |
| lnPAT | -37.3564□ | 0.0000⁎⁎⁎ | -6.6564° | 0.0000⁎⁎⁎ | 167.7797□ | 0.0000⁎⁎⁎ | 155.3062° | 0.0000⁎⁎⁎ | |
| lnPOP | -0.0934□ | 0.4628 | 0.0315° | 0.5126 | 129.2104□ | 0.0000⁎⁎⁎ | 193.1958□ | 0.0000⁎⁎⁎ | |
| lnGDP | -8.4608□ | 0.0000⁎⁎⁎ | -1.6636° | 0.0481⁎⁎ | 146.0242□ | 0.0000⁎⁎⁎ | 44.8733□ | 0.9502 | |
| Developing countries | T1IS | -2.3844□ | 0.0086⁎⁎⁎ | -1.9474□ | 0.0257⁎⁎ | 84.2759° | 0.0086⁎⁎⁎ | 77.1963□ | 0.0317⁎⁎ |
| lnPAT | -13.9387□ | 1.0000 | -3.5201° | 0.0002⁎⁎⁎ | 76.9047° | 0.0334⁎⁎ | 104.0243° | 0.0001⁎⁎⁎ | |
| lnPOP | 0.1059□ | 0.5422 | -1.4030° | 0.0803* | 115.7608° | 0.0000⁎⁎⁎ | 216.1981° | 0.0000⁎⁎⁎ | |
| lnGDP | -2.7170□ | 0.0033⁎⁎⁎ | -2.2542° | 0.0121⁎⁎ | 88.0057° | 0.0041* | 62.3385° | 0.2610 | |
Source: Authors’ analysis.
First, we examine the 31 developed countries from 1995 to 2021 and conduct impulse response and variance decomposition analyses for the corresponding panel time series using the PSVAR model. We set the impulse response horizons and quantile interval to 10 and 0.5, and choose general to specific (GTOS) as the lag length criteria referencing Pedroni (2013).
Impulse response analysisFig. 3 illustrates the contemporary response of T1IS to composite lnPAT shock in developed countries and responses to common and idiosyncratic components in the composite shock. We present the median, 25th, and 75th percentile responses across countries for each kind of impulse response result to reflect intercountry heterogeneity (Zhou et al., 2019).

In Fig. 3 (a), the initial average response of top-income share to a unit composite shock in patent applications is negative. This declining trend continues into the second year and reaches its lowest point (−0.001 %) for the entire period. Although the response remains negative after that, it decreases and gradually converges to zero in 10 years. Furthermore, the initial responses at the 25th and 75th percentiles are positive and negative, with steeper tendencies to fall and rise relative to the median response. The former declines from the starting point by 0.023 % in two years and then dies out, while the latter climbs more gently from −0.025 % to −0.0008 % in 8 years and stabilizes at this level.
Fig. 3 (b) reveals that a shock in the number of patent applications is globally transmitted that negatively impacts top-income share. Compared with the effects of a composite shock, the response to a common shock exhibits a similar trend but to a lesser extent. The median response line is consistently below and close to the horizontal zero axis. Its slight downward and upward trend change over the first five years does not exceed the −0.0001 % level. The response at the 25th percentile falls below the positive 0.0027 % level, dropping to a negligible negative value. The response at the 75th percentile differs considerably from the impact of the other two types of shocks, as the initial negative trend persists for an additional two years before gradually tapering off and converging to −0.0001 %.
Fig. 3 (c) presents the top-income share’s response to a contemporary 1 % idiosyncratic shock in the total patents in developed countries. The uncertain country-specific shock has a persistently negative impact on the share held by top earners, lasting for over two years before gradually reverting to zero over 10 years. Common shocks have a much more limited impact on economic inequality than idiosyncratic shocks. Over the entire 10-year period, the total reactions to the idiosyncratic component in patent numbers are approximately 10 times greater than those to the common component. The globally transmitted impact of the common shocks is minimal. Therefore, the effect of the idiosyncratic shock is indistinguishable from that of the composite shock, regardless of whether it is at the 25th, median, or 75th percentile.
In summary, innovation shocks negatively affect the top-income share in developed countries. This indicates that innovation has potentially positive effects on mitigating income inequality in these countries. Furthermore, the country-specific shocks of total patent applications appear to amplify the impact of the global innovation shocks.
Variance decomposition analysisFig. 4 illustrates the variance decomposition following composite, common, and idiosyncratic shocks to explain the dynamics of income inequality in developed countries, revealing the relative contributions of all three shocks to variations in total patent applications over the period after the shock (Hao et al., 2017). Likewise, the 25 %, median, and 75 % quantiles of the sample distribution are plotted in these figures.

As shown in Fig. 4 (a), on average, the composite shock of total patents initially accounts for 7 % of the structural variance in top-income share, reaching a maximum of 8 % in the second year and gradually decreasing to zero over time. However, the shock effect accounts for a much higher proportion for the 25th percentile, starting at 26 % and declining to 7 % over 10 years. In contrast, the proportion accounted for by the output at the 75th percentile is negligible.
Fig. 4 (b) presents the variance decomposition due to the common shock. The bottom line overlapping the zero axis indicates that the total patent applications’ shock is not correlated with the structural variance in top-income share at the 75th percentile. At the same time, the decomposition results for the median and 25th percentiles exhibit similar trends in percentage change to those shown in Fig. 4 (a). On the one hand, the shock effect, on average, accounts for around 3 % and remains constant during the 10 years. On the other hand, the proportion drops from an initial 20 % to 7 % in the tenth year for 25 % of the sample.
Fig. 4 (c) decomposes the structural variance of top-income share due to the idiosyncratic shock. With similar trends to those of the other two shocks, the output in this case accounts for 2 %–8 %, 7 %–26 %, and around 2 % of the variance at the median, 25th, and 75th percentiles, respectively.
The structural variance decomposition analysis for top-income share demonstrates that income inequalities in developed countries are sensitive to innovation activities with the extent limited to 2 %–8 %, on average. However, combining the three exogenous variables of total patent applications, population, and GDP per capita in the PSVAR model accounts for only about 7 %–15 % of the structural variance in top-income share. In other words, most of the structural variance in income inequality is driven by its past change, about 60 %–90 %, with a monotonically increasing tendency over time. Therefore, innovation shocks are important but not necessarily crucial determinants of income inequality variance in developed countries.
Developing countriesWe next perform impulse response and variance decomposition analyses on the sample data of 28 developing countries from 1995 to 2021. The impulse response horizons, quantile interval, and lag length criteria of the PSVAR model are still set as 10, 0.5, and GTOS, respectively.
Impulse response analysisFig. 5 presents the median response of top-income share among developing countries as well as the 25th and 75th percentiles to the contemporary unity-sized composite, common, and idiosyncratic shocks in total patent applications. According to Fig. 5 (a), the top-income share responds positively at the median percentile to the composite shock in total patent applications most of the time. Concretely, the initial-median response is not sensitive as the shock occurs, and the positive trend only lasts two years before beginning to decrease and turning negative by the third year; however, the response quickly returns to positive in the next year and remains at 0.0006 % after the fifth year. For the 25th percentile, the composite innovation shock has a positive impact on the top-income share that gradually increases over the first four years and fluctuates around the level of 0.002 % thereafter. In contrast, the response at the 75th percentile exhibits a negative tendency that declines to −0.0018 % in the fourth year and reverses to −0.0002 % in the next two years.

Fig. 5 (b) presents the top-income share’s responses to the common shock in total patent applications, which is similar to the cyclical fluctuations depicted in Fig. 5 (a). A shock to the number of patents positively impacts the top-income share, which continuously fluctuates between 0 and 0.0001 % at the median percentile while having a negative impact in the range of −0.0001 %–0 at the 75th percentile. For the 25th percentile, the response shows a more evident positive trend and peaks at 0.00045 % in the fifth year before gradually stabilizing at 0.00025 % in nine years.
Fig. 5 (c) illustrates the contemporary response to a 1 % idiosyncratic shock in the total patent applications, revealing a country-specific shock effect on top-income share under the context of developing countries. The trend and magnitude of this kind of response are once again almost identical to the results in Fig. 5 (a). Overall, the impact of the idiosyncratic component shocks on the top-income shares is positive. For the 25th, median, and 75th percentiles, the response magnitudes are approximately six, ten, and five times greater than those to the common shock, respectively.
Substantial gaps between impulse responses at the 25th and 75th quantiles indicate significant intercountry heterogeneity across developing countries. However, the finding that a shock to the number of patents positively affects the top-income share in these countries is confirmed by the impulse response results of the available panel data, which is a worrying sign. While the average top-income share in the developing country sample data is already higher than that of the developed country sample, the advancement of innovation hardly answers this dilemma and may even have a negative impact. Therefore, it is necessary to further examine the driving factors of income inequality dynamics and their proportions to develop more targeted strategies.
Variance decomposition analysisFig. 6 presents the variance decompositions due to all three kinds of shocks in developing countries. In Fig. 6 (a), the composite total patent applications shock accounts for 6 % of the structural variance in top-income share on average, and the percentage becomes 3 % for the 75th percentile. However, the shock effect for the 25th percentile accounts for a higher proportion over time, reaching 18 % by the tenth year, and although the upward trend slows, it does not stop completely.

Fig. 6 (b) presents the dynamic variance decomposition due to the common shock. For the median percentile, the percentage accounted by the output rises from 0 to 6 % in five years, then drops to a steady 4 % level in 10 years. In the meantime, the shock effect accounts for 12 % at the 25th percentile, which rapidly rises to 11 % in the first year, then oscillates up to this level over the following four years, while it barely accounts for any structural variances at the 75th percentile.
Finally, Fig. 6 (c) decomposes the structural variance due to idiosyncratic shock in total patent applications in developing countries. The impact of the country-specific shock accounts for 16 %, 6 %, and 3 % at the 25th, median, and 75th percentiles, respectively, which is highly consistent with Fig. 6 (a).
Similar to the findings for developed countries, total patent applications can only explain a small part of the structural variance in top-income share in developing countries, about 6 %. Even when including the other two exogenous variables of population and per capita GDP in the PSVAR model, the combined percentage rises to only about 20 %. Again, most of the structural variance in top-income share in developing countries is driven by past changes in the share. Notably, past change is initially the absolute dominant factor of structural variance, and the percentage gradually declines from 100 % to 40 %–70 % within 10 years, which differs from the increasing trend in the context of developed countries. Therefore, although innovation shock is a non-negligible factor of income inequality, it is also not necessarily decisive in developing countries.
Robustness testsTo assess the validity of our baseline results, we re-estimate the empirical relationship between innovation and income inequality by replacing the explanatory variable in the PSVAR model with the bottom 50 % income share (B5IS). This indicator can be defined by referring to the T1IS variable, except that it reflects a more significant proportion of low-income groups’ national income share rather than the top-income groups’ share, enabling us to measure the income inequality degree. The B5IS data for developed and developing countries between 1995 and 2021 are also obtained from the WID. After passing the panel unit root tests, we perform PSVAR estimations for the two sample groups. The corresponding impulse response results are presented in Fig. 7 and Fig. 8.


For the sample of developed countries, the responses of bottom-income share are all positive on average to the composite, common, and idiosyncratic shocks in total patent applications. Moreover, this impact fluctuates between 0 and 0.0004 % and gradually converges to 0 in 10 years. Although the shock effects on the bottom-income share are lower in extent than those on the top-income share, both results demonstrate that innovation shocks in developed countries have positive impacts on reducing national income inequality.
For the sample of developing countries, the shock effects of total patent applications on bottom-income share are primarily adverse, with mean reversion to a level close to zero. Likewise, the results remain consistent with the responses of top-income share to the same shocks, particularly the positive-negative-positive trend changes, but to an even lesser extent. The promotion and diffusion of innovation in developing countries are once again proving likely to exacerbate income inequality to some extent.
Therefore, the robustness of our baseline results is validated. Opposite conclusions emerge once again when assessed using data from separate developed and developing country samples for the relationship between innovation and income inequality. This indicates that the role of innovation must be strategically considered and integrated when addressing income inequality, taking full account of the circumstances of economies at different levels of development to develop correspondingly appropriate policies. Although the impact of innovation activity is significant, it is not the central driver of economic inequality improvement, regardless of the context of an economy’s development level. Technological and other types of innovation can produce relevant approaches for solving this problem. Nevertheless, it is essential to consider innovation in conjunction with the root cause of income inequality itself and other relevant influences to develop more effective solutions.
DiscussionWe obtain conflicting results by conducting an empirical examination of the relationship between innovation and income inequality using panel data for developed and developing countries. For the developed countries sample, shocks to the total number of patent applications negatively impact the top 10 % income share, indicating that innovation advancement can positively reduce income inequality, whereas the top 10 % income share responds positively to shocks in the total number of patent applications for the developing countries sample, implying that innovative activities exacerbate income inequality. Therefore, we are prompted to ponder how disparities in economic development influence the relationship between innovation and income inequality, yielding divergent outcomes.
Developed countries have superior socioeconomic conditions to developing countries, and solid scientific and technological capabilities and highly developed productivity make it easier for them to nurture various innovations that drive national progress (Santos et al., 2019). Meanwhile, the welfare systems in these countries are relatively well-developed, and policies such as minimum wages and unemployment insurance encourage innovation by enterprises to actively improve efficiency and facilitate the rapid diffusion of innovative technologies (Boyer, 2016). In other words, higher overall economic development enables the government to focus more on income inequality and other essential social and livelihood concerns (Binder and Haupt, 2022), rather than indiscriminately prioritizing the pursuit of industrial development and economic growth. As a result, the high-quality institutional guarantees established on national strengths can increase innovation and benefit a broader range of people than high-income groups from new technologies and knowledge, reducing income inequality (Claudia et al., 2018).
By contrast, developing countries’ economic structures, modernization, and social systems vary, which makes it difficult to fully identify the complexity and heterogeneity within developing countries from a macro perspective. However, these countries are committed to building integrated industrial systems, promoting stable economic growth, and improving national governance systems (Li et al., 2016). Therefore, in the absence of mature and robust institutional guarantees, innovations in developing countries not only struggle to be diffused to broader populations but also run the risk of contributing to barriers to competition that are tough to break through in the long term (Sinha et al., 2020). Furthermore, innovations’ profits and new opportunities are less likely to be equitably distributed among stakeholders, including workers. Alternatively, they are more likely to flow heavily to the wealthy classes (Seo et al., 2020), resulting in more severe income inequality.
The SBTC hypothesis indicates that innovations’ adverse effects on income distribution may tend to be more acute for developing countries. The preference for skilled workers amid the technological changes driven by innovation is predictable and understandable, and the resulting short-term rise in income inequality is unavoidable in both developed and developing countries (Jung et al., 2017). However, companies and societies in developed countries have superior capacities and experience to support unskilled workers during the transition period through special training and social security. The relatively high level of inclusiveness provides more opportunities for unskilled workers in developed countries to realize role transformation (Boyer, 2016). The more skilled the workers are with new technologies, the greater the chance of diminishing short-term income inequality and narrowing the gap between rich and poor. In developing countries, less-skilled workers can be easily overlooked amid biased technological change, and the short-term inequalities related to technological innovation are likely to become long-term challenges in the absence of timely and effective policy guidance. Similarly, superstar firms in developing countries are less willing to assume the tasks of improving the industry’s ecology and fulfilling their social obligations actively or passively (Autor et al., 2017).
Therefore, improving the quality of institutional guarantees and ensuring full co-operation between the government, enterprises, and individuals is critical. Intense supervision and guidance measures are needed to regulate the behavior of those with decision-making power at the top to assure that the benefits of innovation are reasonably distributed to all stakeholders (particularly workers) and further narrow the income gap. Furthermore, a fair and broader welfare system is also required to increase the willingness of innovators and those with vested interests to share and spread the fruits of innovations voluntarily and protect the rights and interests of the disadvantaged parties. In this regard, developing countries could learn from developed countries’ successful experiences and avoid repeating their failed attempts. For example, tax policies (Wang et al., 2025), labor distribution shares in different sectors (Ling et al, 2025), and people-public-private partnerships (Gustafsson and Amer, 2023) require in-depth investigation.
Furthermore, the level of education should be raised more generally and the development of targeted specialized skill training must be promoted in an organized manner. Technological progress inevitably incurs greater demand for high-skilled labor than low-skilled labor. Improving overall educational attainment can reduce the skills gap among the workforce at its roots, enabling more people to transition smoothly through the changes from technological and knowledge innovation and earn higher incomes (Zuo et al., 2025). More importantly, people with higher education have relatively more agile thinking and more robust adaptability and are better able to become practitioners of innovation-based improvements in the structure of income distribution (Mao and Huang, 2025). However, some people will always become part of the low-skilled labor force and susceptible to falling further behind in income, and some people will be unsuited to the conventional path of public education. Therefore, the conscious provision of large-scale specialized training in advance to expand the pool of skilled workers and timely assistance to unskilled workers through skills training during the transition process are of great significance for lowering income inequality.
Additionally, while the impulse response results indicate that the impact of innovation on income inequality is contradictory across economies at different development levels, the variance decomposition findings also demonstrate that innovation is not the primary driver of income inequality dynamics in either case. Instead, the formation and solidification of polarization between the rich and the poor are the key reasons that the vicious cycle of income inequality is so difficult to break. Thus, there are more effective ways to address income inequality than focusing solely on the correlated effects of innovation activities. For example, policymakers could holistically consider whether innovation and other important determinants such as population, GDP per capita, and globalization are causally related and how they have combined effects in influencing income distribution (Hailemariam et al., 2021). The emergence and spread of new income inequalities should be actively prevented in advance while gradually implementing efforts to narrow the gap between the rich and the poor.
From another perspective, income inequality also affects the creation and promotion of innovations. A more equitable income distribution increases the incentive to innovate and accelerates the pace of innovation, improving resource allocation efficiency and steadily promoting economic growth (Sokoloff and Khan, 1990). But the pioneer consumer effect also illustrates that moderate inequality contributes to specialization in more complex technologies (Gürlek and Tuna, 2018), i.e., income gaps existing within reasonable range help to generate far-reaching innovations. Improving income inequality is a crucial task that must be unswervingly pursued over the long term. Nevertheless, while advocating a balanced approach by policymakers to support innovation, the pursuit of absolute equality is unrealistic, impractical, and pointless. A more sensible and sustainable approach would be to raise income mobility and reduce the income gap to an appropriate level to leave room for innovation and other necessary activities for development and progress.
ConclusionsInnovation and income inequality are two seminal research interests, and the complex and fluid relationship between them has attracted increasing attention. Understanding and balancing their relationship is of considerable practical significance from perspectives of productivity, economy, technology, and social stability. Therefore, this study examines the correlation between the two and applies the PSVAR model to assess the impact of innovation on the income gap in developed and developing country contexts, respectively.
The empirical results reveal that promoting innovation negatively affects income inequality in developed countries while positively affecting income inequality in developing countries. The results of our robustness analysis replacing the response variable with the bottom 50 % income share also validate the opposite correlation between innovation and income inequality in developed countries (negative) and developing countries (positive). Moreover, innovation only accounts for a small proportion of the drivers of changes in income inequality, implying that the factors exacerbating or mitigating income inequality are numerous and preexisting unequal income distribution itself has huge impacts on income inequality dynamics.
The contradictory findings from the evaluations of the two sample groups lead us to consider how developed and developing countries may manage the impact of various innovations on income distribution patterns differently. As our qualitative investigation deepens, it becomes increasingly clear that institutional guarantees are essential for ensuring the proper distribution of innovations’ benefits and guiding the diffusion of technology or knowledge innovations more broadly. Advanced economies have obvious advantages in this regard, creating the conditions for innovation to reduce income inequality. Accordingly, our findings provide important inspiration for policy development.
To understand the relationship between innovation and income inequality more objectively and provide a valuable practical reference, it is essential to consider the heterogeneity of the research context. Our sample division into developed and developing countries for the empirical analysis is constraining as it offers only a macro research perspective. Future research should examine different samples and more specific (micro) perspectives to address the limitations of this study and obtain richer and more convincing information and conclusions.
Ethical approvalAll procedures performed in studies involving human participants were in accordance with the ethical standards of the institutional and/or national research committee and with the 1964 Helsinki declaration and its later amendments or comparable ethical standards.
CRediT authorship contribution statementYu Qian: Writing – review & editing, Writing – original draft, Software, Methodology, Investigation, Formal analysis, Data curation. Zeshui Xu: Writing – review & editing, Writing – original draft, Validation, Supervision, Resources, Project administration, Investigation, Funding acquisition, Formal analysis. Yong Qin: Writing – review & editing, Writing – original draft, Supervision, Methodology, Formal analysis, Data curation. Marinko Skare: Writing – review & editing, Visualization, Validation, Supervision, Conceptualization.
Yu Qian declares she has no conflict of interest. Zeshui Xu declares he has no conflict of interest. Yong Qin declares he has no conflict of interest. Marinko Škare declares he has no conflict of interest.
No funding.