


Environmental regulations have been extensively studied in the context of advocating green development. As one of the most stringent laws in history, the new Environmental Protection Law (EPL) of 2015 has greatly affected the production and development of enterprises. In this context, and in the face of the incentive problem of green technology innovation, what impact does this legislation have on the quantity and quality of green technology innovation activities of manufacturing enterprises? This study takes the new EPL as a representative policy of environmental regulation, and the A-share listed companies from 2010 to 2022 as a sample, and uses the differences-in-differences model to explore the impact of environmental regulation policies on green technology innovation. The results show that although the implementation of the new environmental protection law has enabled an expansion of the quantity of green technology innovation, it has also led to a decline in the quality of related innovation activities. It also finds differences based on the nature of enterprise property rights, with the quantity and quality of green technology innovation of state-owned enterprises being significantly higher than that of non-state-owned enterprises. Differences based on enterprise scale are also noted; compared with small-scale enterprises, the number of green technology innovations of large-scale enterprises is higher under the new environmental protection law, while the quality is not significantly different. The conclusions of this study provide theoretical support and counter-measures for deepening the reform of environmental regulation-related systems and formulating differentiated policy support measures for enterprises with different ownership types and scales.
Green reform of China's production structure, strengthening of environmental regulations on heavy-polluting industries and other pollution behaviors, and controlling pollution emissions from the production sources of enterprises have become imperative to achieve carbon peak and carbon neutrality, and to promote the realization of green and low-carbon technologies. Since the 18th National Congress of the Communist Party of China (CPC), environmental issues have received unprecedented attention from the Party and the government, and China's environmental protection has moved to a higher level, through the principle of “adhering to the priority of economy first, protection first, and natural restoration”. The 19th National Congress of the CPC has further taken “adhering to the harmonious coexistence of man and nature” as one of the basic strategies for upholding and developing socialism with Chinese characteristics in the new era. The report of the 20th National Congress of the CPC put forward that "we should develop green and low-carbon industries, improve the market-oriented allocation system of resources and environmental factors, and accelerate the research and development and promotion of advanced technologies for energy conservation and carbon reduction." Under the guidance of these ideas, China has promulgated a series of policies and regulations to promote the construction of ecological civilization.
An understanding of green technology innovation is as important a theoretical concern for academia, as the promotion of green technology innovation is a pressing practical problem that needs to be solved by society. Based on the patent applications accepted by the China Intellectual Property Office, this study examines the problem of green technology innovation, and analyzes the impact mechanism of the existing environmental regulatory policies on it. The following are the key questions the study aims to answer: what role does environmental policy play in the rapid growth of China's green technology innovation activities, and are there differences in environmental regulation in terms of green technology innovation?
Among various policies, the new Environmental Protection Law (EPL) is considered the most stringent EPL revision in history. The policy officially came into force on January 1, 2015, providing the most powerful legal backing for the world's second largest economy plagued by environmental problems, and helping it to reverse the deterioration of the ecological environment caused by its rapid economic development. The revised EPL specifies the government's oversight and management responsibilities for environmental protection; improves basic environmental protection systems such as red lines for ecological protection, total pollutant control, environmental monitoring and impact assessment, and joint prevention and control across administrative regions, strengthens the responsibility of enterprises for pollution prevention and control, and imposes greater legal sanctions on environmental violations. There are also systematic provisions for the government and enterprise disclosure of environmental information and public participation and supervision of environmental protection. The implementation of the new EPL has effectively broken the obvious incompatibility between the old EPL and the characteristics and new concepts of economic and social development, and there are problems such as weak operability and weak environmental law enforcement. It provides better institutional support for further clarifying the green development of economic and social development, and also provides good policy background support for the study of environmental regulation.
As the backbone of the real economy, China's manufacturing enterprises are an important site of supply side structural reforms as well as the main battlefield of technological innovation. They are the pillars on which the modern economic system is constructed, and the high-quality development of manufacturing industry is an important component of exceptional economic development. The State Council's "Guiding Opinions on Accelerating the Establishment and Improvement of a Green, Low-Carbon and Circular Economic System" proposes to take the lead in making breakthroughs with the focus on energy conservation and environmental protection, clean production, clean energy, etc., and address the task of integrating development in agriculture, manufacturing, service industry and information technology, so as to comprehensively promote the green upgrading of primary, secondary and tertiary industries and infrastructure. Therefore, the implementation of the new EPL has placed greater pressure on manufacturing enterprises to regulate the environment, and those who continue to follow the original production model may be severely penalized. This disincentive will make companies more inclined to adopt green innovation in their production. Jiang (2015) concluded that environmental regulation has a significant positive impact on the expansion and intensification margin of R&D innovation in Chinese manufacturing enterprises, and that enterprises facing stronger environmental regulations are more inclined to carry out R&D innovation and invest more in R&D. Against this backdrop, this study adopts the new EPL to represent the government's environmental regulation policies and examines whether it can promote green technology innovation in manufacturing enterprises. Li et al. (2024) believe that the green responsibility of manufacturing enterprises is reflected in improving resource utilization efficiency and reducing waste emissions in the production process.
The empirical literature on the mechanism by which environmental regulation influences green technology innovation shows conflicting evidence on the relationship between these two variables. Kneller and Manderson (2012) find that environmental regulation has no significant positive impact on the total R&D and capital accumulation of green technology innovations. Conrad and Wastl (1995), Gray and Shadbegian (2003), and Greenstone et al. (2012) argue that environmental regulations inhibit firms' green technology innovation by increasing costs. Other authors find contrary evidence, especially when the environmental regulations are well-designed. Popp et al. (2010) argue that environmental regulatory policies can induce innovation by making environmental inputs more expensive, either implicitly or explicitly. Zhang (2020) used the difference-in-difference (DID) model to investigate the impact of the "two control zones" policy on enterprise upgrading, and found that environmental policies can significantly improve the green production efficiency and R&D innovation expenditure of enterprises in the "two control zones". Li et al. (2020) also use the DID method to show that pollution charges enhance the green innovation of heavily polluting enterprises, and the stronger the resource base of enterprises, the more obvious the "backward" effect of pollution charges on enterprise green innovation. Chen et al. (2020) demonstrate that command-and-control environmental policy instruments have the most positive impact on end-of-pipe treatment and innovation related to green products. Liu and Liu (2023) find that pilot policies for carbon emissions trading can significantly encourage green technology innovation in industrial enterprises. Wang et al. (2023) find that the pilot policy of low-carbon cities promotes green development by promoting technological innovation and changing the industrial structure. Xie and Yang (2023) suggest that environmental regulations can significantly promote green technology innovation in advanced manufacturing industries at higher levels of R&D investment.
It is important to note that research in this domain should identify green technology innovation appropriately and measure it quantitatively and qualitatively in a scientifically sound manner. Scholars typically use the number of green invention patents as an indicator to measure green technology innovation, and only consider it at the quantitative level. For example, Han et al. (2024) measure green innovation using the cumulative number of citations of green patents applied for in each year. With the increasing availability of patent data and the in-depth mining of patent information, scholars have of late begun to extract data on the quality of enterprise innovation from the perspectives of patent inventors, claims, patent families, and citations. To illustrate, Zhang and Zheng (2018) employ the knowledge width measurement method to construct a patent quality index for enterprises using cited information on invention patents. Kang (2018) uses text interpretation and knowledge width measurement methods to measure patent quality and studies the impact of government subsidies on the patent quality of enterprises. Xi et al. (2022) find patent scale and knowledge breadth both to be important indicators for measuring innovation ability. Liu and Zhang (2024) also use the knowledge breadth method to measure the quality of green technology innovation in various Chinese provinces.
Despite the divergent findings in the literature, most scholars believe that environmental regulations can have a significant impact on green technology innovation. Existing studies have not yet arrived at a consensus on the exact relationship between environmental regulation and green innovation, as the conclusions drawn are based on data from different countries, industries, and diverse regulatory policy contexts, none of which may be universally applicable in China. The studies also focus more on the impact of environmental regulation on the number of green patents applied for or granted, and rarely involve the relationship between environmental regulation and the number of green inventions obtained independently. Further, appropriate indicators of green technology innovation quality are rarely considered, and number of green patents cited is often used, indicating the primacy of quantity over quality. Therefore, the evidence on the impact of environmental regulation on the quality of green invention patents of manufacturing enterprises is thin or non-existent. Additionally, the existing research does not examine this impact across different types of enterprises, and is therefore not comprehensive. Exploring these issues will help achieve a "win-win" for both environmental improvement and green technology innovation, while also forming a realistic basis for relevant environmental policies.
China's manufacturing industry is its hallmark for achieving superior economic development, and since the country focuses equally on economic development as well as on green development, we posit that enterprises in the manufacturing industry here may be more affected by environmental regulation policies. Therefore, this study considers the new EPL to be representative of environmental regulation policies and examines its impact on the quantity and quality of green technology innovation of enterprises. All A-share listed companies from 2010 to 2022 are included in the sample. The quantity of green technology innovation is measured by the number of green invention patents independently obtained. The quality of these patents is identified at the International Patent Classification (IPC) group level with the help of cited information on green invention patents of manufacturing enterprises. Using the DID model, this study examines the status of the quantity and quality of green technology innovation in the manufacturing industry compared with other industries before and after the implementation of the new EPL. In order to eliminate the self-selection bias of the DID method to a certain extent, the PSM-DID model is used to verify the robustness of the benchmark model. This study also examines the differential impact of the EPL across varying types and scales of property rights of manufacturing enterprises. Based on the results, the study illustrates the effect of environmental regulation policies on green technology innovation and proposes suggestions for formulating reasonable policies stimulating the vitality of such innovation, and implementing differentiated green technology innovation-driven policies.
This study makes three main contributions to the literature and policy domains. First, using the new EPL as a representative policy, we study the impact of environmental regulatory policies on green technology innovation in manufacturing enterprises. Given that manufacturing is the key driver of high-quality economic development in China, and the fact that the country emphasizes both economic development and green development of a high quality equally, we focus on this sector as it is the one most likely to be impacted by environmental regulatory policies. Second, departing from existing research that focuses more on the impact of environmental policies on the quantity and quality of innovation activities, this study adopts the new EPL and examines its impact of green technology innovation activities, in line with the current era of high-quality development orientation. Studies have found that the new EPL can significantly promote the growth of green technology innovation in manufacturing enterprises, while not being mindful of the declining quality of such innovation. This study offers new insights on the inconsistency between the quantity and quality of green technology innovation in manufacturing enterprises, and contributes to the growing body of research on the impact assessment of environmental regulation policies. Finally, prior research has typically measured the quality of green technology innovation using the number of enterprise invention patents or the number of citations of invention patents. This study improvises on this method and uses the breadth of knowledge to reflect the quality of green invention patents. The breadth of patent knowledge refers to the complexity and extensiveness of the knowledge contained in a patent, which in turn reflect its quality. In this study, the quantitative information of IPC classification symbols in the cited information of green invention patents is used to measure the quality of green patent innovation in manufacturing enterprises.
Literature review and hypothesesThe positive impact of the new EPL on green technology innovation activitiesThe "Porter Hypothesis" emphasizes the importance of industrial clusters and competitive strategies, arguing that environmental regulations may stimulate firms to innovate and improve their competitiveness. It argues that appropriate environmental regulations can encourage firms to engage in innovative activities that increase their productivity, thereby offsetting the costs of environmental protection and increasing profitability in the market (Poter,1991). Companies can reduce environmental costs and improve resource efficiency by adopting green technologies and improving production processes. This not only helps them reduce operating costs while complying with regulations but also creates market differentiation for businesses and meets consumer demand for environmentally friendly products. Consequently, environmental regulations can serve as catalysts for business to employ greener and more sustainable strategies. Porter and Van der Linde (1995) argue that the cost of complying with environmental regulations will be offset by the cost reductions from technological innovation encouraged by regulations. Jerad et al. (2014) examined the association between environmental regulations and innovation in Australian oil and gas companies, and show that firms facing high regulatory burdens are more likely to introduce product and service innovation, i.e., regulation stimulates innovation. Tian and Yao (2015) show that the introduction of regional environmental information disclosure regulations has led to an improvement in the quantity and quality of the content thus disclosed by local enterprises. Yu et al. (2019) concluded that environmental law enforcement supervision can effectively promote corporate green innovation. Compared with enterprises in areas that were not in areas under such supervision, those in areas being supervised showed significantly higher green innovation. Wang et al. (2020) argue that the new EPL will directly increase the cost of environmental violations by strengthening penalties, thereby "force" companies to carry out green innovation. Tang et al. (2023) believe that the new EPL promotes green technology innovation in heavily polluting enterprises through rewards and punishments. Zhao and Luo (2024) find that command-and-control, market incentives, and voluntary participation in environmental regulations have significant positive effects on green technology innovation.
Therefore, environmental regulation policies such as the new EPL allow for green technology innovation in manufacturing enterprises by incentivizing them to carry out green transformation. Concomitantly, they restrain high-polluting enterprises in the manufacturing industry, and force them to reduce pollutant emissions, carry out green technology innovation, and thereby increase the number of green innovations of manufacturing enterprises. Based on the above theoretical research, the following hypothesis is proposed.
H1 -The implementation of the new Environmental Protection Law promotes the increase in the number of green technology innovations of manufacturing enterprises.
Potential distortion of green technology innovation activities by the new EPLUnlike Porter's hypothesis, neoclassical economic theory asserts that markets can achieve efficient resource allocation without external intervention. Under this theoretical framework, environmental regulation is seen as a market intervention that may have a positive or negative impact on corporate green innovation. Neoclassical economics points out that environmental regulation can lead to higher costs for firms, thereby limiting their profitability margins. To comply with the regulations, companies may need to execute costly technological modifications and implement environmental protection measures, which reduces their profitability. This can lead to a negative corporate response to green innovation in the short- term, seeing it as a burden rather than an opportunity. Gregory and Robert (1981) estimated that the decline in labor productivity explained by public regulations between 1973 and 1977 was 12–21 %, using data from the manufacturing industry in the United States. Gray (1987) measured the impact of environmental and worker health and safety regulations on productivity growth in the U.S. manufacturing industry, and found that environmental regulation reduced annual productivity growth by 0.17–0.28 %. Thomas and Robert (1995) argue that environmental regulations may prevent new firms from entering the industry, implying that incumbents are consequently advantaged.
Empirical analysis also shows that environmental regulations inhibit the entry of new companies in various manufacturing industries. Liu et al. (2019) argues that strict environmental laws lead to higher environmental regulatory costs, public pressure, and legal actions related to environmental issues for listed companies in China. Lu (2011) argues that the "pollution control expenditure" caused by environmental regulations will increase the production cost of enterprises, thereby reducing both the scale of production and the number of workers absorbed by enterprises. Tao et al. (2021) believe that the resources set aside by enterprises towards innovation are insufficient to support high-quality innovation activities, which may lead to a decline in their quality. Xiao et al. (2024) find that the implementation of environmental regulations in China has a significant inhibitory effect on green technology innovation, with negative "compliance costs " playing a dominant role. Sun et al. (2024) believe that environmental regulations will encourage companies to reduce production and emissions, increase environmental investment to lower the "compliance cost" of environmental regulations, and reduce R&D investment in high-quality green innovation, thus inhibiting the quality of green innovation.
Therefore, there is a punitive effect of environmental regulatory policies. The implementation of the new EPL has ensured greater protection of the environment, while simultaneously punishing non-compliant enterprises. This has resulted in an increase in their costs, which may impose constraints on their green technology innovation, eventually leading to a decline in the quality of their innovation. Following from these theoretical propositions, the following hypothesis is proposed:
H2 -The implementation of the new Environmental Protection Law may cause the risk of the decline in the quality of green technology innovation of manufacturing enterprises.
Differentiated impact of the new EPL on green technology innovation activitiesManufacturing enterprises differ in many respects. For example, based on the property rights of enterprises, they can be categorized into state-owned and non-state-owned enterprises. There are also differences in business size. These differences may lead to varying policy effects of the new EPL, and therefore, this study proposes a heterogeneity analysis.
The attributes of enterprises based on the nature of property rights are different, as is their response to any policy. Generally, compared with non-state-owned enterprises, state-owned enterprises respond better to national policies for the following reasons: First, being controlled by the state, state-owned enterprises can shoulder major social responsibilities, and will more actively and readily implement policy directives issued by the state. Second, Lu (2014) believes that state-owned enterprises, as an important tool for the government to achieve political achievements, had a favorable external development environment and were also a lever for the government to control the macro-economy. The new EPL highlights the functions of the government, and implements the supervision and assessment of environmental target responsibility system for officials in relevant departments. As the main tool, state-owned enterprises will more firmly accept national policy suggestions, reduce pollution costs, carry out green technology innovation for themselves, and actively implement the outline of green transformation of national economic development. Based on the above theoretical research, the following hypothesis is proposed:
H3 -Compared with non-state-owned enterprises, the implementation of the new EPL has a greater impact on the green technology innovation of state-owned manufacturing enterprises.
Lastly, green technology innovation activities are usually related to enterprise scale. According to Sun et al. (2014), large-scale enterprises typically invest more in R&D and training. They have clear advantages in the use of funds, talent reserves, and technical capabilities. Green technology innovation requires sufficient capital, manpower, material and other resources; therefore, small-scale enterprises cannot as easily internalize the costs caused by environmental regulation given their capital and innovation technology constraints, and most of them will adopt means such as shutting down or transferring to other places with less stringent environmental regulations. Strong large-scale enterprises on the other hand, can reallocate a variety of resources through transfers, upgrades, and transformations, and thereby come up with a variety of green technology innovations to cope with environmental regulation. This leads us to formulate the last hypothesis of this study as below:
H4 -The green technology innovation of large-scale enterprises is more affected by the new EPL than that of small enterprises.
Research designData sources and sample selectionThe data related to green patents used in this study are from the State Intellectual Property Office of the People's Republic of China, and the rest of the economic data of enterprises come from the China Stock Market and Accounting Research (CSMAR) database. The sample data is selected as the economic data related to manufacturing enterprises and the number of green patents in all of China's A-share listed companies from 2010 to 2022. Since the number of patents alone cannot accurately measure an enterprise's green technological innovation, the quality of green patents is also considered based on the number of patents studied. According to GB/T 4754–2017 "Classification of National Economic Industries", enterprises with industry code C are divided into manufacturing industries, including: C13 agricultural and sideline food processing industry, C14 food manufacturing industry, C15 wine, beverage and refined tea manufacturing industry, a total of 31 industries, as the experimental group, the rest of the industry as the control group. All abnormally traded listed companies, including ST and *ST companies as well as companies related to the financial industry were excluded from the data sample. Since the financial data and green patent data of various enterprises are very different, outlier value will affect the readiness of the research results; therefore, the data are indentable, and all indicators are processed at the 1 % and 99 % levels.
Using patent data to measure green technology innovation activities demonstrates three advantages. First, patent data can more accurately measure the output of innovation activities (Zhou et al., 2012) rather than the input of innovation activities. This is suitable for the analysis of the impact of the new EPL on green technological innovation. Second, the patents obtained by enterprises are categorized into independent and joint acquisitions. The number of patents obtained independently can better reflects an enterprise's R&D capabilities for innovative technologies. Therefore, this study adopts the number of green inventions independently obtained by listed manufacturing companies to study the impact of the new EPL on the green technology innovation activities of manufacturing enterprises. Finally, by utilizing patent data, this study not only measures the quantity of green technology innovation activities but also characterizes their quality.
This study measures the number of green technology innovation activities using the number of green invention patents independently obtained by listed companies, and measures their quality by constructing the patent knowledge width index. IPC information on patents can accurately depict the characteristics of the technical field of innovation activities as well as the complexity of the knowledge contained in patents. The greater the difference between the patent classification codes at each of the large group levels, the greater the knowledge width of the green patents created by the enterprise and the higher the quality of the green patents. This study identifies and calculates the quality of green patents applied for in China at the IPC group level according to the IPC code in the cited information of green invention patents of manufacturing enterprises.
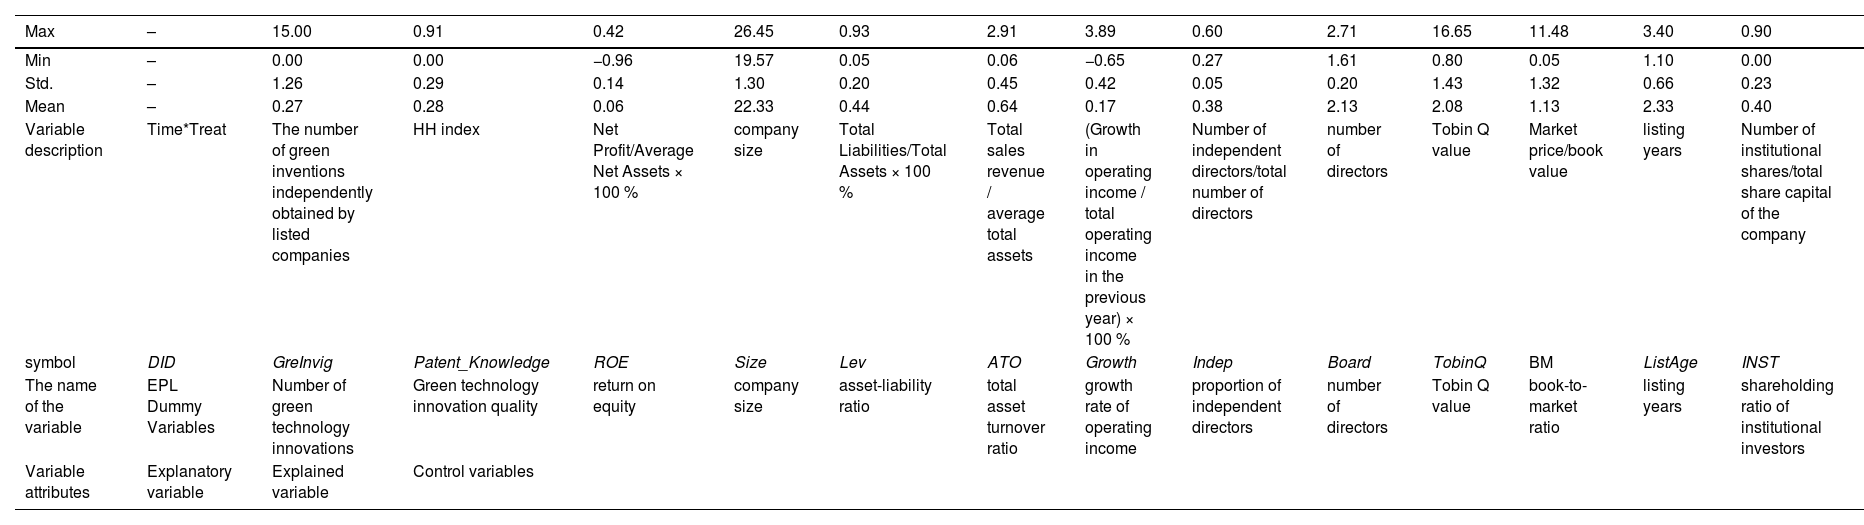
Variable selectionExplanatory variables: The core explanatory variable is DIDitTimet*Treati, where Timet indicates whether the new EPL is implemented or not. The revision of the EPL increased penalties for environmental violations, with the harshest ones imposed on illegal emissions, excessive emissions, and evasion of testing. Since manufacturing enterprises including multiple polluters invariably account for the highest share of carbon and other gas emissions in the entire industry, the new EPL will significantly impact their green technology innovation status. Therefore, 2015, the year of implementation time of the new EPL, is chosen as the policy time node. Timetis 0 when t is <2015, and 1 when t is greater than or equal to 2015. Treati represents the virtual variable indicating whether all A-share listed companies i belong to manufacturing enterprises (experimental group) or otherwise (control group). Therefore, Treati is 1 for manufacturing enterprises, and 0 for other enterprises.
Explained variables: The explained variable GreInvigit represents the number of green inventions independently obtained by i listed companies in year t, and Patent_Knowledge represents the measured value of the knowledge width of green invention patents applied for by i listed companies in year t. The quality of green patents is calculated using the knowledge width method following Zhang and Zheng (2018). The number of IPC classification numbers in the green patent citation information is used, with the format of IPC patent classification numbers being "Department - large category - small category - large group - small group,” as for example, "A01B01/00″. Large groups are separated with slashes (/). In appearance of patents, the patent class number is in the format of "broad - small class,” such as "01–00.” However, using only the number of patent classifications may not accurately distinguish the internal differences among the class numbers contained in a patent and might cause some bias in the measurement of patent quality. Therefore, it is weighted with the logic idea of Herfindahl-Hirschman index (HH) at the large-group level, and the specific calculation method of patent knowledge width is: patent_knowledge=1-∑α2, where α represents the proportion of each major group classification in the patent classification number. The greater the difference between patent classification numbers at each large group level, the greater the knowledge width of green patents created by enterprises and the higher the quality of green patents.
Control variables: The control variables are selected following Cao et al. (2021), Chen and Zheng (2023), and others, and comprise the return on equity (ROE), company size (Size), asset-liability ratio (Lev), total asset turnover ratio (ATO), growth rate of operating income (Growth), proportion of independent directors (Indep), number of directors (Board), Tobin Q value (TobinQ), book-to-market ratio (BM), listing years (ListAge), and shareholding ratio of institutional investors (INST), all of which can have a positive impact on the green technology innovation of each manufacturing enterprise.
Model selectionThe DID method is used to evaluate the impact of the policy. Its basic principle is to construct the differential statistics reflecting the policy effect by comparing the differences between the experimental group and the control group before and after the policy implementation. To estimate the policy effect, it is necessary to compare the changes in the treatment group before and after the policy; however, this change may also be caused by the time effect. Therefore, it is necessary to introduce the changes of the outcome variables of the control group before and after the occurrence of the policy to propose the time effect within the treatment group, that is, to assume that a treatment group with only time effect and no policy influence is constructed through the control group.
To verify the research hypotheses, regression model (1) is set as follows:


The explained variable GreInvigit represents the number of green inventions independently obtained by i listed companies in year t, and Patent_Knowledge represents the measured value of the knowledge width of green invention patents applied by i listed companies in year t. The correlation Timet*Treati pre-coefficient β1 and α1 represent the change of green technology innovation of manufacturing enterprises after the implementation of new environmental protection policies compared with non-manufacturing enterprises, that is, it is used to measure the effect of policy implementation. xit represents a series of control variables at the individual level of i enterprise in t years. μirepresents the individual fixed effect of enterprise i, ωt represents the year fixed effect of t year, and εit is the model error term.
Table 1 presents a comprehensive overview of the aforementioned variables. The data in the figure reveals a significant difference between the maximum and minimum values of the explained variable, indicating that the quantity and quality of green technological innovation in some enterprises are relatively low and far below those of high-level enterprises. This suggests that there is a notable imbalance in the development of green technological innovation among various enterprises. Similar phenomena are observed in other control variables.
Variable selection.
Prior to executing the models, parallel trend hypothesis test should be conducted, which is the foundation for using the DID method to test the effect of the policy in This means that the target variables of the experimental group and the control group can only be used when they meet the same development trend before the policy occurs. If there are substantial pre-policy differences between them, then the results obtained by using the DID method cannot represent the net effect of the policy.
This study adopts the event analysis method to test parallel trends drawing on the research ideas of Bai et al. (2022) to construct regression Eq. (2) as below:

The time dummy variableDitm represents the observed values of each manufacturing enterprise in k years before, that year and s years after the implementation of the new EPL policy with the dummy variable of non-manufacturing enterprises being 0, where k and s represent the periods before and after the implementation of the new EPL respectively. The sample interval selected is 2010–2022. The new EPL being implemented in 2015, we thus obtained that s = 7 and k = 5.
Fig. 1 representing the dynamic effect of the new EPL on the number of green technology innovations shows that the 95 % confidence interval of the coefficient before the implementation of the policy is around 0, while from the year of the implementation of the policy, its value is positive. The coefficient β1 is not significant before the policy implementation and gains significant after the policy implementation, which means that the parallel trend hypothesis of the DID estimate is satisfied. Fig. 2 shows that the 95 % confidence interval of the coefficient before the policy implementation is around 0, while the value from the year of the policy implementation is negative. The coefficientα1 is not significant before the policy is implemented, but gains significance after the policy is implemented, implying that the parallel trend hypothesis is satisfied.


Since the conditions for model use are met, the benchmark regression according to the model specified above is conducted and the results are shown in Table 2.
Results of baseline regression.
Notes: ***, **, and * indicate statistical significance at the 1 percent, 5 percent, and 10 percent levels, respectively. The t-statistics are shown in parentheses.
Table 2 shows that controlling for individual fixed effects and annual fixed effects, with GreInvig as the core explanatory variable, its interaction term DID is significantly positive at the 5 % level, indicating that the implementation of the new EPL has promoted green technology innovation in manufacturing enterprises, and the number of green patents independently obtained by manufacturing enterprises in that year is 0.1924 more than that of non-manufacturing industries. Thus, H1 is valid.
The table also shows that controlling for individual fixed effects and annual fixed effects, the DID of Patent_Knowledge as the core explanatory variable is significant at the 5 % level, but its coefficient is negative, indicating that although the implementation of the new EPL has promoted the number of green technology innovations in manufacturing enterprises, it has inhibited their quality to some extent. From this, it follows that H2 is valid.
The practical economic significance of these results may be understood in the context of the new EPL being called "the strictest” in the history of People's Republic of China. This legislation laid out the government's supervision and management responsibilities for environmental protection; improved the ecological protection red line; ensured control of the total amount of pollutants; and established stringent penalties such as daily penalties, production limits, and suspension of production. The new EPL has had a greater impact on manufacturing enterprises, which account for the highest proportion of pollution emissions across industries. In compliance with the policy requirements and to avoid penalties, enterprises will accelerate the process of green technology innovation, reduce the emission of pollutants, etc. Although the new EPL has significantly increased the number of green technology innovation, their quality in some enterprises has not shown improvement. This may be because not all manufacturing enterprises allocate sufficient resources to support a comprehensive green transformation during business expansion. Some might have taken superficial green innovation measures to meet regulatory requirements in the short term, resulting in the uneven quality of innovation activities.
Robustness analysisPlacebo testPlacebo tests are employed to assess whether the trend changes in the experimental group vis-à-vis the control group after the policy intervention have been influenced by other policies or random factors. These tests enhance the robustness of the estimates obtained using the DID model. The basic premise of a placebo test is to estimate the outcome by creating a fictitious experimental group or fictitious policy time. If the estimates under these scenarios remain statistically significant, it indicates that the original estimates may be biased and the dependent variable may have been affected by other policies or random factors.
The study undertakes a random selection from the experimental group and conducts placebo tests through the following procedure: the interaction term is randomly sampled 500 times and the DID regression is performed using the entire sample to assess whether the coefficient of the interaction term differs significantly from the baseline estimate. If in the case of random sampling, the baseline regression coefficients – that is, the interaction coefficient of the number of green technology innovations (0.1924) and the interaction coefficient of green technology innovation quality obtained above – are small probability events, then the placebo test is valid. We find that the explained variable GreInvig is not affected by other policies or random factors, and therefore the benchmark regression results are reliable.
The random sampling results of the interaction term coefficients are shown in Fig. 3 and 4. It can be seen that for GreInvig, the horizontal coordinate is the estimated coefficient of the interaction term Treat*Time, the vertical axis is the density distribution and the corresponding p value, the red level is the significance level of 0.05, the regression coefficient of the line model takes 0 as the mean value and is normally distributed, and the p value of the minimum part of the estimator is <0.05. That is, below the intersection of the normal distribution curve and the red horizontal line, we represent the base regression coefficient 0.1924 in the graph. As can be seen from the figure, the red vertical line is expressed as the true estimate of DID model 0.1924, and all the sampling results are located on the left side of the true estimate, indicating that the true estimate of the interaction term 0.1924 is an event with minimal probability. Similarly, the result for Patent_Knowledge shows that the true estimate of the interaction term, −0.0329, is a minimal probability event. Therefore, it can be concluded that these estimates are unlikely to have been obtained either by chance or affected by other policies or random factors. Therefore, the baseline regression results are reliable.
PSM-DID test

Propensity Score Matching (PSM) addresses the issue of selection bias. The Propensity Score (PS) is a value obtained for each control group sample based on a set of covariates that serves as a criterion. Using this PS, similar or comparable individuals in the control group are identified for each individual in the treatment group. This model aims to reduce data bias that might be caused by other confounding factors.
PSM-DID refers to the application of the DID model after implementing PSM. In reality, policies are essentially non-randomized experiments, and thus, the DID model used for policy effect evaluation may suffer from self-selection bias to a certain extent. However, using the PSM model allows for specific control group samples to be matched to each treatment group sample, making the quasi-natural experiment approximation closer to random and reducing bias.
Eleven variables – ROE, Size, Lev, ATO, Growth, Indep, Board, TobinQ, BM, ListAge, and INST – are used as covariables to match the manufacturing enterprises under the new EPL policy. A total of 10,722 data points are not matched to suitable control group counterparts. The quantity and quality of green technology innovation are analyzed, and the average processing effect ATT of the model is calculated. The results are shown in Table 3.
Table 3 shows that before matching, the average treatment effect of GreInvig was 0.3294 with a T-value of 10.66, significant at the 1 % level. After matching, the average treatment effect ATT was 0.4284 with a t-value of 12.98, also significant at the 1 % level. Therefore, PSM-DID was effective. The results of Patent_Knowledge are equally valid. Next, the balance test is carried out, to test whether there is a significant difference in the value of covariates between the two groups after matching. If the difference is not obvious, it indicates that the matching effect is good, and it is more appropriate to use such matching samples for DID regression. The matching results show that the degree of deviation of each covariate is reduced compared to that before no matching, indicating that the PSM test is relatively effective. The DID method is then used for the regression, and the results are shown in Table 4.
PSM-DID regression results.
Notes: Control refers to all the control variables; for simplicity, we do not report their estimation results here. ***, **, and * indicate statistical significance at the 1 percent, 5 percent, and 10 percent levels, respectively. T statistics are shown in parentheses.
Compared with the DID regression results in Table 2 above, the interaction term coefficient of GreInvig is 0.1924, in the PSM-DID regression, it is 0.2830. There is no significant difference between the two results, and both regressions are significant at the 5 % level. The results for Patent_Knowledge show that the interaction term coefficient in the DID regression is −0.0329, compared to −0.0266 in the PSM-DID regression. Again, the difference was not significant, and both regressions were significant at the 5 % level.
After PSM-DID regression processing, the net policy effect of the new EPL can still maintain the sign, size, and significance level unchanged; therefore, the results of the benchmark regression model for explaining environmental regulation and the quality of green innovation of manufacturing enterprises are robust. In sum, the new EPL, representative of environmental regulation policy, will enhance the green technology innovation activities of manufacturing enterprises, but inhibit the quality of such innovation.
Heterogeneity testEnvironmental regulation policies are likely to have varying effects on different types of enterprises. Therefore, the issue of enterprise heterogeneity based on property rights and scale is analyzed here. The sample enterprises are first divided into state-owned and non-state-owned enterprises. The results are summarized in Table 5.
Test results of enterprise property right nature heterogeneity.
Notes: Control refers to all the control variables; for simplicity, we do not report their estimation results here. ***, **, and * indicate statistical significance at the 1 percent, 5 percent, and 10 percent levels respectively. T statistics are shown in parentheses.
The DID values of GreInvig and Patent_Knowledge, are significant at the 1 % level and 10 % level respectively for state-owned enterprises. For non-state-owned enterprises, DID values of GreInvig and Patent_Knowledge are both significant at the 5 % level. These results render it impossible to directly determine the difference between them using the comparison coefficient. Therefore, we conduct an intergroup difference test. First, we test the study on the number of green innovations; the results are shown in Table 6.
Results of inter-group difference test on the nature of enterprise property rights.
For GreInvig 's results, in the 500 samples, b0-b1 is negative for 460 times, and the p-value was 0.080, significant at the 10 % level, indicating that the new EPL has a significant difference in the impact on the number of green technology innovations between state-owned enterprises and non-state-owned enterprises, with the impact on state-owned enterprises being greater. For the result of Patent_Knowledge, in the 500 samples, b0-b1 is negative 480 times, and the P-value is 0.040, which is significant at the 5 % level, also indicating that the new EPL has a significant difference in the impact on the quality of green technology innovation between state-owned enterprises and non-state-owned enterprises, and the impact on state-owned enterprises is greater.
We thus conclude that the impact of the new EPL is significantly greater on state-owned enterprises than on non-state-owned enterprises in terms of both quantity and quality of green technology innovations. This conclusion validates the H3.
The second element of heterogeneity among enterprises is related to size/scale, and this study takes the mean size of all sample enterprises as the critical value, that is, 22.3272. When the size is greater than or equal to 22.3272, the enterprise is classified as large-scale; otherwise, it is classified as small-scale. The results of this analysis are presented in Table 7.
Test results of enterprise size heterogeneity.
Notes: Control represents all the control variables; for simplicity, we do not report their estimation results here. ***, **, and * indicate statistical significance at the 1 percent, 5 percent, and 10 percent levels, respectively. T statistics are shown in parentheses.
Table 7 shows that for the DID value ofGreInvig,large-scale enterprises are significant at the level of 1 % level, while small-scale enterprises are significant at the 5 % level. As both results are significant, the difference in impact cannot be gauged directly through the comparison coefficient. We thus conduct the inter-group difference test (Table 8). With respect to Patent_Knowledge, it can be seen that the DID coefficient for neither large nor small-scale enterprises is significant, which indicates that the impact of new EPL is not particularly different between large and small-scale enterprises with respect to the quality of green technology innovation.
Test results of enterprise size differences among groups.
From the component difference test results in Table 8, it can be seen that for the results of GreInvig, among 500 samples, b0-b1 is negative 497 times, and the p value is 0.006, which is significant at the 1 % level, indicating that there is a significant difference in the impact of the new EPL on the number of green invention patents between state-owned enterprises and non-state-owned enterprises. And the impact on state-owned enterprises is greater; For the results of Patent_Knowledge, in 500 samples, b0-b1 is negative 416 times, and the P-value is 0.168, which is not significant, indicating that the policy effect of the new EPL is not significantly different between large-scale enterprises and small-scale enterprises with respect to the quality of green technology innovation.
To summarize, considering the new EPL as a representative example of environment regulation policy, the number of green invention patents of large-scale enterprises is significantly greater than that of small-scale enterprises; however, there is no significant difference in quality. This conclusion partially validates the research hypothesis H4, and the issue of enterprise heterogeneity and quality of green technology innovation needs to be further studied.
DiscussionThis study undertakes an empirical analysis of the relationship between environmental regulation and the green innovation ability of manufacturing enterprises. It uses data on listed companies in the manufacturing industry (enterprises that meet industry code C in the Industrial Classification of the National Economy) from 2010 to 2022, and undertakes a longitudinal study to understand the impact of the new EPL, a key policy instrument for environmental regulation which came into force in 2015 in the People's Republic of China, on the green technology innovation of these enterprises.
Drawing on the existing literature, the number of green patents and quality of these patents are considered the key indicators to measure enterprises’ green innovation. The number of green innovations refers to patents independently obtained by listed companies in the manufacturing industry in a given year. The quality of these patents is captured by the knowledge width measurement method, which uses cited information on the patents. The larger the knowledge width value, the higher the quality of the patent. The DID method, commonly used in econometric research to assess impact effectiveness of projects and policies, is employed to calculate the net effect of environmental regulation policies on the green innovation ability of manufacturing enterprises at the micro level. The implementation of the new EPL provides the background and theoretical motivation for the research on the impact of macro policies on micro-economic governance.
The empirical evidence is built through regression models in which all relevant control variables are included, annual and individual fixed effects are accounted for, and robustness and heterogeneity tests are carried out. This evidence would serve as a reference point for manufacturing enterprises to formulate suitable green innovation decisions in response to environmental regulation policies, promote the green transformation of enterprises, help the government to understand the policy impacts, and provide a strong empirical basis for future decision-making by the government.
Historically, local governments have lacked motivation to protect the environment and have advocated economic development at the expense of the environment, implying the failure of China's previous environmental policies. The revised EPL places the responsibility of the supervision and management of environmental protection on the government and lays down several action points for effective environmental protection. These include improving ecological protection red lines, total pollutant control, environmental monitoring and impact assessment, cross-administrative joint prevention and control of pollution, strengthening the responsibility of enterprises for pollution prevention and control, increasing legal sanctions for environmental violations, making systematic provisions on the disclosure of environmental information by the government and enterprises, public participation, and supervision of environmental protection.
The implementation of the new EPL has effectively broken the obvious incompatibility between the old EPL and the characteristics of economic and social development and the new concept. There are problems such as weak operability and weak environmental law enforcement, and it provides better institutional support for further clarifying the green development of the economy and society. The old EPL was characterized by weak operability and poor law enforcement, and was therefore not effective enough to address the environmental concerns rising on account of unbridled and unsustainable socio-economic development. The new EPL is expected to be more efficacious as it provides better institutional support to address the detrimental developmental impacts on the environment. The results of this study show that the new EPL has promoted an increase in the number of green patents in society. It complements the findings of earlier studies such as Jin (2009)) and Wang et al. (2023) who demonstrated the positive impact of environmental regulation on pollution control and resource allocation. It is imperative to strengthen the supervisory role of the government in environmental regulation, and local governments should be involved in framing relevant rules and regulations for green development suitable to local conditions, strengthening environmental supervision, and forcing enterprises to carry out green technology innovation. The ground reality of implementing the new EPL, however, is that local officials continue to adopt passive methods such as shutting down polluting enterprises and forcing them to move out of the local area in response to regular assessment by the central government.
The results of this study show that while the new EPL promotes an increase in green patents, this is at the cost of their quality. This finding is also aligned with those of earlier studies. Tao et al. (2021) analyzed changes in the number and quality of patent applications for inventions related to environmental management technology in China from 2000 to 2016. The data show that from 2000 to 2005, the number of invention patent applications grew slowly, with an average annual growth of 333, while from 2006 to 2016, the number of applications showed explosive growth, with an average annual growth of 3008. However, from the perspective of knowledge breadth, the patent quality declined. They argued that even while strict environmental regulations enabled expansion of the bubble of green technology innovation in enterprises, the quality of patents would decline. Ma and Chen (2024) found that environmental regulations of local governments significantly promoted only the quantity of green technology innovation and fed the bubble of such innovation, but did not address the quality concerns therein.
The role of local governments in formulating scientific and reasonable environmental protection practices and technology policies is thus critical. First, the role of economic incentives such as financial subsidies and taxes has to be acknowledged, as they are tools which can stimulate the enthusiasm of business entities for green technology innovation, and enable an increase in the number of innovations. Environmental protection laws and regulations require targeted guidance and incentive policies, and therefore the government should focus on increasing the depth and breadth of subsidy policies. These policies can be implemented commensurate to the level of green innovation, the different stages of enterprise R&D, and the actual situation on the ground (Han et al., 2024). Second, the evaluation processes of the quality of green patents should be strengthened, and quality should be considered an important criterion for policy support. In a context of information asymmetry and professional knowledge limitations, the government may not be able to measure the quality of green technology innovation accurately. Therefore, we suggest introducing more scientific evaluation indicators such as patent quality, actual application effect, etc., covering the innovation, practicability, environmental benefits, economic benefits, and other dimensions of technology.
The balance between the environmental and economic costs and benefits is a delicate one. From the perspective of environmental benefits, including secondary indicators such as carbon reduction, pollution reduction, efficiency improvement, and green expansion, the policy focus should be on reducing pollutant emissions, improving resource utilization efficiency, and promoting ecological restoration. From the viewpoint of economic benefits, this study measures the effect of green innovation projects on cost saving, market competitiveness improvement, new product development, and other aspects to evaluate the level of green technology innovation. Simultaneously, according to the environmental protection level, technological development, and policy requirements of the industry, the evaluation indicators need to be regularly updated to ensure their scientificity and practicability. Through policy guidance and support, enterprises can overcome resource bottlenecks and achieve green transformation.
To address the inability of the government in measuring the quality of green technology innovation due to information asymmetry and professional knowledge limitations, local governments can identify high-value green technologies with the help of market competition mechanisms. For example, the introduction of a third-party evaluation institution, the establishment of a special green technology innovation fund, and the implementation of public selection while the internal substantive review ensures the feasibility and effectiveness of the policy, etc., are potential options. Support universities, scientific research institutes, inspection and testing institutions, certification institutions, and other institutions to establish a green technology verification service platform and form professional teams of third-party evaluation institutions could be promoted and made viable. There is also a need to establish and improve the evaluation norms and management system of green technology innovation intermediaries, strengthen the supervision and management of third-party evaluation institutions, and ensure the fairness and accuracy of the evaluation results. A special green technology innovation fund set up and guided by the government could attract the participation of social capital through financial allocations, special subsidies, and other means. Financial institutions and private individuals could also be encouraged to jointly participate in the establishment of a green technology innovation fund, forming a diversified capital investment mechanism.
Establishing strict project screening mechanisms focusing on supporting green technology projects with high innovation and market potential, and providing financial support for these innovation initiatives through equity investment, debt investment, risk compensation, etc., will promote the synchronous growth of the number and quality of green patents and enhance the positive role of green technology innovation in environmental protection. In this context, the role of consumer associations, environmental protection organizations, trade unions, N news media, and other social tools in supervising enterprises cannot be overstated. The pressure of public opinion to force polluting enterprises to form a sense of green development and actively adopt environmental regulatory measures is equally critical.
It has to be acknowledged that green technology innovation is not every enterprise's first choice in the face of environmental regulations. Differences in size and the nature of property rights will lead to enterprises dealing with environmental regulations in diverse ways. For example, the first path of recourse for small and medium-sized manufacturing enterprises with weak operating capacity may be to consider moving to neighboring areas with relatively more affordable and low environmental regulatory intensity (Wu et al., 2021). This would greatly reduce the policy effect of environmental regulation. Large enterprises with strong operating capacity and high R&D levels, on the other hand, may choose to carry out green technology innovation, consistent with the results of this study. Not all large enterprises, however, might do so as the results of this study show that the impact of the new EPL on green technology innovation varies with the nature of property rights. State-owned enterprises are likely to respond better to environmental regulations compared to non-state-owned enterprises with respect to green transformations. While state-owned enterprises are more sensitive to policies, non-state-owned enterprises have the twin advantages of flexibility and innovation potential. Therefore, the contribution of non-state-owned enterprises to green innovation cannot be ignored in policymaking, and all enterprises, irrespective of the nature of ownership should be encouraged to utilize their respective advantages to enable green transformation and jointly promote sustainable development.
The impact of the new EPL on green technology innovation also varies by the enterprise size. The results show that this impact is more prominent in large-sized manufacturing enterprises. However, small and medium enterprises (SMEs) may exhibit strong innovation abilities in specific industries and market segments. For example, some SMEs focus on specific technology fields which can quickly respond to market demands and achieve efficient green innovation. Therefore, policy design should focus on balancing the needs of different-sized enterprises, providing targeted support measures to help SMEs overcome the challenge of insufficient resources so that they can play an important role in green transformation. Local governments should fully consider the heterogeneity of enterprises when formulating specific environmental regulatory policies, and put forward targeted regulatory policies based on the different characteristics of enterprises. They should also actively encourage and guide different social entities to carry out green technology innovation, and acknowledge the positive role of environmental regulatory policies on green technology innovation of enterprises with different characteristics, rather than adopting a "one-size-fits-all" approach. For example, greater financial and technical support could be provided to state-owned enterprises and large enterprises, and training and technical guidance could be provided to small and medium-sized enterprises. The government can alleviate the imbalance in green technology innovation among different enterprises by formulating differentiated policies. An increase in the allocation of innovation resources and capital investment which are essential to stimulate enterprise-led green technology innovation would also be immensely useful. Enterprises also need to use feedback signals from the market to alleviate resource mismatch and further promote technology spillover (Hao et al., 2024).
The results also show that the implementation of the new EPL has significantly increased the number of green technology innovations in manufacturing enterprises. However, this improvement is likely attributable to the combined effect policy regulations, market trends, the improvement of consumers' awareness of environmental protection and technological progress. Specifically, in the face of strict environmental regulations, manufacturing enterprises with high pollution emissions increase their number of green technology innovations, but this is partly driven by market demand and technology development. Therefore, other factors also influence the relationship between policy and corporate behavior. From the perspective of internal development of enterprises, an enterprise's willingness to engage in green innovation can directly affect its status of such innovation. In their research on Chinese manufacturing enterprises, Wang et al. (2024) showed that green innovation willingness is positively correlated with green innovation behavior. In addition, the demand of enterprises for their own business development and the improvement of business efficiency will promote technological progress to carry out a series of green technology innovations. Mugoni et al. (2023) believes that agricultural enterprise marketing companies would manage the development of green reverse logistics technology to pursue business efficiency and enhance their sustainable competitive advantage. From the perspective of market demand, innovative products from R&D to production only undergo an internal process at the industrial end, and innovation activities form a completely closed loop until they are consumed by consumers to generate benefits. Apaza-Panca et al. (2024) believe that people tend to consume brands of companies whose processes or products have the least environmental impact. Therefore, consumers' propensity to consume can affect the decision-making of enterprises in green technology innovation projects and improve their level of green technological innovation.
ConclusionsWith the new EPL as the policy background, this study examines the impact of environmental governance policies on enterprises' green technology innovation. The number of green inventions independently obtained by an enterprise in the current year is used as the index to measure the enterprise's green technology innovation, and the difference-in difference model is used to study and verify the theoretical hypotheses. The research findings are as follows:
First, compared with other industries, the implementation of the new EPL has a significant effect on the number of green technology innovations in manufacturing enterprises. In the face of stringent government regulations, to reduce the cost of environmental violations, manufacturing enterprises with high pollution emissions will carry out green technology innovation to avoid losses and develop better brand value in the context of environmental protection policies. Second, although the implementation of the new EPL has enhanced the number of green technology innovations in manufacturing enterprises, it has inhibited their quality to a certain extent. Some manufacturing enterprises are unable to support their comprehensive green transformation and improve green technology innovation due to their business development capabilities; therefore, in the face of strict regulatory conditions, to avoid punishment, their green technology innovation activities might be more superficial. Third, the green technology innovation of state-owned enterprises is significantly promoted by the new EPL policy compared with that of non-state-owned enterprises. As an important tool for the government to regulate the social economy, state-owned enterprises will more readily accept national policy suggestions, carry out green technology innovation, and actively implement the outline of green transformation of national economic development. Finally, compared with small enterprises, green technology innovation in large enterprises has been promoted more by the new EPL. Large-scale enterprises have more R&D funds and more advanced R&D technology, which can support enterprises in carrying out green technology innovation better.
This study adds enormously to the existing literature on environmental regulation and green technology innovations. However, owing to data limitations, some areas need further improvement and expansion. First, since the data collected lack corresponding geographic information such as the province and region to which the cited patents belong, it is not possible to disaggregate the policy impacts by location. Future research efforts should attempt to collect and extract geographic information from the cited information on green invention patents to address this lacuna. Second, in addition to enterprises, local governments are also key entities in the implementation of environmental regulation policies. Future studies in this area should strive to collect macro data at the provincial and municipal levels to further explore how environmental regulation policies such as the new environmental protection law affect green technology innovation activities.
CRediT authorship contribution statementWensheng Wang: Writing – review & editing, Supervision, Methodology, Formal analysis, Conceptualization. Xi Yang: Writing – review & editing, Writing – original draft, Methodology, Formal analysis, Data curation, Conceptualization.
This work was supported by Humanities and Social Sciences of Ministry of Education Planning Fund of China grant No 24YJA910006 and National Natural Science Foundation of China grant No 11671115.