


This study explores the impacts of 11 diverse entrepreneurship indicators on green technology innovation (GTI) to determine the optimal environmental regulatory framework that fosters green entrepreneurship. Additionally, the study investigates the impacts of environmental regulations on GTI by utilizing nonlinear panel smooth threshold regression (PSTR) models on data collected from 18 countries from 2002 to 2020. By identifying a critical regulatory threshold of 1.89, the research reveals how varying levels of environmental regulations significantly influence GTI dynamics. The estimation results emphasize that GDP per capita and financial development are critical in fostering GTI. However, stringent environmental regulations can counteract these positive effects. Urbanization and trade openness also positively influence GTI, with environmental regulations complementing their impacts. The transition to a service-oriented industrial structure positively affects GTI. The results underscore the negative impact of entrepreneurship indicators, potentially diverting resources away from GTI. Nonetheless, environmental regulations with stringent enforcement mechanisms can counterbalance the negative impacts of specific entrepreneurship metrics. Among the entrepreneurship indicators analyzed, financing for entrepreneurs, governmental support and policies, and governmental programs exhibit an inverted U-shaped impact pattern, peaking at specific levels of environmental regulation.
The contemporary challenge of the climate crisis looms large, necessitating immediate attention and collective action (Reckien et al., 2018). A shift from unsustainable growth models toward sustainable development pathways is necessary to tackle this urgent issue. This shift requires reallocating capital and promptly adopting clean production technologies (Huang et al., 2021; G. Luo et al., 2023). At the core of this transition lies the concept of Green Technology Innovation (GTI). It plays a pivotal role in harmonizing environmental protection and economic development, fostering a future characterized by green-oriented, innovation-driven growth (J. L. Du et al., 2019; Fei et al., 2016; Guo et al., 2020; M. Wang et al., 2021; Xu et al., 2023). GTI serves as a driver for a shift toward a more sustainable future (Stucki & Woerter, 2017).
Entrepreneurs' inclination to adopt environmentally friendly innovations is significantly influenced by environmental concerns (Hobman & Frederiks, 2014; Polas et al., 2023; Xie & Zhao, 2018). It also shapes their preference for eco-friendly advancements (Kraus et al., 2020). Nevertheless, the commitment of businesses to ecological sustainability remains the subject of ongoing debate. Many firms hesitate to invest in long-term initiatives that do not yield immediate returns, emphasizing the need for policy-driven interventions (Melander & Arvidsson, 2022; Zhang et al., 2020b). Green technology development involves prolonged research and development (R&D) cycles, substantial financial commitments, inherent risks, and complexity that demand increased corporate dedication to innovation (Shao et al., 2020; H. Yu et al., 2023). Policy interventions are pivotal in overcoming these challenges and driving green innovation forward (Nemet, 2012; Popp & Newell, 2012; Rogge & Schleich, 2018).
Environmental regulations can impact GTI differently due to the innovation compensation effect and the cost compliance effect. These regulations are constraints and incentives (Tian et al., 2021). While they may increase production costs (Zhang & Dong, 2022), enterprises must weigh the trade-offs between these effects. When the benefits of innovation compensation outweigh compliance costs, it provides a strong incentive for corporate GTI. The intensity of environmental regulation implementation directly influences the cost compliance effect in companies; however, its contribution to the innovation compensation effect remains subject to theoretical and empirical conflicts.
The Porter hypothesis suggests that firms are motivated to innovate to enhance their long-term competitiveness in response to environmental regulations (Porter & Van Der Linde, 2017). Conversely, a cost-focused perspective argues that environmental regulations might escalate abatement costs, potentially discouraging investments in innovation (Jaffe et al., 2000). Numerous studies have delved into the relationship between environmental regulation and green innovation, revealing a complex picture. Some empirical studies report positive associations (X. Cai et al., 2020; Chen et al., 2022; Yi et al., 2020), while others uncover negative or nonlinear relationships (Yi et al., 2019; Zhang et al., 2020a; Zhang et al., 2022). These divergent findings highlight the adaptability of the crowding-out theory and the Porter hypothesis across different contexts.
The effectiveness of the Porter hypothesis is closely linked with the local contexts in which it is applied, which can vary significantly in space and time. Prior research emphasizes the role of local contexts in the Porter hypothesis, focusing on temporal and spatial variations in the interplay between environmental regulation and productivity or innovation (G. L. Zhao et al., 2022; Zhu et al., 2019). Thus, a complex, nonlinear pattern emerges in how environmental regulations affect GTI over time and across various samples, an aspect often overlooked in empirical studies.
Entrepreneurship is intricately linked with knowledge, technological advancement, and innovation, holding the potential to stimulate economic growth (Bendig et al., 2022; W. M. Cohen & Levinthal, 1989). However, entrepreneurial activities rarely unfold in isolation; rather, they occur within entrepreneurial ecosystems consisting of interconnected actors, institutions, and resources (Isenberg, 2010; Spigel, 2017). Such ecosystems—which include investors, incubators, supportive policies, and technology transfer infrastructures—can shape entrepreneurs’ decisions to pursue green innovations by providing essential resources, mentoring, and collaborative platforms (Alvedalen & Boschma, 2017; Elia et al., 2020). Indeed, when the ecosystem is robust and well-coordinated, entrepreneurs encounter lower barriers to entering markets with eco-friendly products, making it more feasible to align business opportunities with sustainability goals (Stam & van de Ven, 2021). Consequently, green entrepreneurship emerges as a powerful avenue for sustainable development as entrepreneurs leverage ecosystem support to devise innovative production processes and products capable of mitigating environmental degradation (B. Cohen et al., 2008; Coulibaly et al., 2018; York & Venkataraman, 2010). The importance of the entrepreneurial ecosystem is further highlighted by recent studies showing that established firms are increasingly partnering with born green startups—through acquisitions, investments, and strategic alliances—to access high-tech environmental knowledge (Demirel et al., 2019). This synergistic relationship illustrates how entrepreneurial ecosystems not only foster collaboration but also catalyze the adoption of GTI, guiding both startups and established enterprises toward more sustainable trajectories.
Existing research presents conflicting views on whether environmental regulations spur or hinder innovation (Jaffe et al., 2000; Porter & Van Der Linde, 2017), suggesting a need to determine whether such policies exhibit threshold effects. Likewise, despite a growing body of evidence linking well-developed entrepreneurial ecosystems with stronger innovation capabilities (Iqbal et al., 2020; York & Venkataraman, 2010), existing research provides limited insights into how specific ecosystem factors interact with environmental regulation regimes to foster GTI. Moreover, while scholars acknowledge that entrepreneurial ecosystems can supply the financial, social, and institutional support required to facilitate green startups and eco-friendly processes, there remains a dearth of studies examining threshold or nonlinear mechanisms through which these ecosystems might amplify—or diminish—the efficacy of environmental policies. Accordingly, this study addresses these gaps by investigating how entrepreneurship indicators integrate with different intensities of environmental regulation to shape GTI outcomes across countries. This study makes two primary contributions: (1) the panel smooth threshold regression (PSTR) model (Colletaz & Hurlin, 2006; Fok et al., 2005) is adopted to overcome the cross-sectional heterogeneity critique often posed against conventional panel data approaches (Hsiao, 2014), thus allowing for capturing the nonlinear and context-specific impacts of environmental regulation on GTI; and (2) the effects of 11 diverse entrepreneurship indicators—reflecting the multifaceted nature of the entrepreneurial ecosystem—on GTI are evaluated, demonstrating how these indicators intersect with varying levels of environmental regulation. In line with these contributions, three research questions are posed: (1) How does the intensity of environmental regulation, viewed through different regulatory regimes, shape the nonlinear relationship between regulation and GTI? (2) How do diverse entrepreneurship indicators influence GTI under varying intensities of environmental regulation? and (3) Is there an optimal alignment between regulation intensity and entrepreneurship development to maximize GTI? From these questions, it is hypothesized that:
H1: Environmental regulation exerts threshold effects on GTI;
H2: Entrepreneurship indicators—key components of the entrepreneurial ecosystem—positively influence GTI, albeit to different degrees depending on the regulatory regime; and,
H3: Stricter regulations amplify these positive entrepreneurial ecosystem impacts on GTI, signaling a synergistic interaction between policy enforcement and entrepreneurship.
These hypotheses are tested through the PSTR framework to offer fresh insights into how entrepreneurial ecosystems and environmental regulations jointly shape green innovation trajectories, thus enhancing the understanding of—and policy recommendations for—sustainable development.
The remainder of this paper is organized as follows: Section 2 provides an in-depth exploration of the literature; Section 3 delves into the data sources and introduces the proposed econometric models; Section 4 advances the discussion by addressing empirical findings and their interpretations; and, Section 5 concludes the paper and offers and potential policy implications.
Literature reviewGreen technology innovation (GTI)Engaging with GTI is intricately linked with the principles of ecological modernization theory, which contribute to the curtailment of pollution and drive the transformation of diverse industrial sectors (Buttel, 2000; W. Cai & Li, 2018; Z. Li et al., 2023). In this respect, it safeguards valuable resources, enhances the environment, and advances economic progress, forging a harmonious synthesis between ecology and the economy (Barbieri et al., 2020; F. Dong et al., 2022; Miao et al., 2017; Shan et al., 2022). This integration of green innovation encompasses a wide spectrum of ecologically sustainable creative endeavors, spanning from eco-friendly technologies to environmentally-conscious products and services. This presents a comprehensive blueprint for a more sustainable future (Martínez-Ros & Kunapatarawong, 2019).
The significance of green innovation surpasses mere economic expansion; it is crucial in driving a broader ecological transformation and mitigating environmental damage by applying novel technologies (Flammer et al., 2019; Karimi Takalo et al., 2021). In this context, GTI extends tangible business advantages and paves the path to sustainable development (Deng et al., 2019; K. Du et al., 2021). Sustainable energy strategies pioneer this metamorphosis, encompassing aspects such as green energy adoption, energy efficiency enhancements, and protective measures targeting climate change mitigation and overall energy service improvement (Appiah et al., 2022; Islam et al., 2012). Nations worldwide are united in their commitment to champion green innovation as a conduit to realizing sustainable development, acknowledging its potential to tackle the pressing challenges of the current era (A. Wang et al., 2023). This collective dedication underscores the immediacy of shared responsibility to harness the force of innovation to pursue a greener and more sustainable future.
Porter hypothesisConventional economic wisdom has held for a considerable time that environmental regulations place financial burdens on businesses, and this potentially hampers their profitability (Palmer et al., 2018). However, Porter (1991) introduced a groundbreaking perspective, further expanded by Porter and van der Linde (1995), which challenges this conventional belief. Known as the Porter hypothesis, it states that environmental regulations can spark innovation within companies, which potentially leads to improved productivity and cost savings.
This hypothesis manifests in two distinct versions; the weaker version suggests that regulations can stimulate innovation, ultimately generating benefits that outweigh associated costs, while the stronger version proposes that innovation driven by regulatory demands can effectively offset compliance expenses. Nevertheless, investigations into these hypotheses have produced mixed outcomes (M. A. Cohen & Tubb, 2018; Eli & Bui, 2001). The strong form of the Porter hypothesis has remained a topic of contention and examination, contributing to inconclusive findings attributed to various factors. However, recent research leans toward more positive outcomes than earlier studies (Ambec et al., 2013; M. A. Cohen & Tubb, 2018).
Cohen and Tubb (2018) conducted an extensive meta-analysis to evaluate the impacts of environmental regulations on productivity and competitiveness and found that these regulations often have a more favorable impact at broader geographic scales. These findings align with the core principles of the strong version of the Porter hypothesis. Empirical research has also started to consider regional disparities in the implications of the Porter hypothesis (Y. Luo et al., 2021). The effectiveness of environmental regulation in promoting sustainable transformations depends on a number of factors, including local industrial structures, types of policies, levels of economic development, and firm-specific distinctions (Costantini et al., 2017; J. L. Du et al., 2019; Franco & Marin, 2017; Liu et al., 2022)
Environmental regulation and GTIThe intricate interplay between environmental regulations and the advancement of GTI has been the subject of extensive scholarly investigation. However, achieving a consensus regarding this complex relationship remains a formidable challenge. Within this intricate web of research, several studies have shed light on a positive connection between environmental regulations and the proliferation of green patents. For example, Cai et al. (2020) and Fang et al. (2021) independently presented empirical evidence supporting a positive correlation between GTI and environmental regulations, particularly in heavily polluting industries. Their findings underscore the nuanced nature of this connection.
From a temporal perspective, firms' attitudes toward green innovation exhibit evolving dynamics over time. Aghion et al. (2016) and Stucki and Woerter (2017) demonstrated that environmental regulations exert a two-stage impact on innovation, transitioning from an initial wait-and-see approach to a proactive stance on green innovation over time. The stringency of environmental regulations significantly influences firms' preferences for green innovation. As regulations become more stringent, the costs of abatement rise, potentially leading to a crowding-out effect. However, a growing awareness of the benefits associated with green innovation drives a heightened demand for such initiatives. It is anticipated that there will be a pivotal juncture at which the innovation offset supersedes the crowding-out effect (Dechezleprêtre & Sato, 2017).
From a spatial perspective, the duration of the crowding out or innovation offset stages varies considerably across different regions. Some cities may find themselves lingering in the initial stage due to limitations in their innovation capacities and high transformation costs, while others rapidly progress to the second stage. The magnitude of these effects also varies among cities, as demonstrated by Balland and Rigby (2017))) and Hidalgo et al. (2018). Zhang et al. (2022) found that carbon emission trading can potentially stifle green innovation, especially in eastern China with low emission intensity. Furthermore, local and adjacent environmental regulations can affect green productivity through mechanisms related to green innovation and pollution transfer (Peng, 2020). The level of economic development within cities can significantly shape the dynamics of this relationship, as reported by Du et al. (2021). The openness of local markets can provide vital financial access and technological support for green innovations (Feng et al., 2018).
Furthermore, Li and Du (2021) and Dong et al. (2020) unveiled a U-shaped curve relationship between these variables, emphasizing the presence of spatial spillover effects, which add another layer of intricacy to this multifaceted issue. Furthermore, competition among local governments is pivotal in shaping the dynamics of the GTI enterprise (Deng et al., 2019). This competitive landscape can give rise to a complex, inverted U-shaped relationship with GTI. As the financial structure within these local governments strengthens, it tends to promote GTI. However, the scale and efficiency of financial operations may hinder the very innovation intended to be fostered (Lv et al., 2021).
Crucial factors that influence the pursuit of green innovation under environmental regulation include local industrial attributes, economic structure, and innovation capacities. Cities with robust fiscal capacities and well-established research institutions have a notable advantage in promoting green innovation. While previous studies explored the impacts of environmental regulation in different contexts, the spatiotemporal non-stationarity in the relationship calls for increased attention. Most existing studies rely on regional dummies or conventional econometric techniques, which furnish global average estimates yet often fail to capture the intricate spatiotemporal patterns that underlie the interaction between environmental regulation and innovation.
Empirical model and dataThis investigation delves into annual data from 2002 to 2020 to unveil the factors shaping GTI across 18 countries. A central constraint of this study lies in the scarcity of available data regarding entrepreneurial metrics across different temporal and geographical contexts. Relying on insights gleaned from diverse scholarly investigations, it becomes apparent that a number of pivotal determinants significantly influence GTI. According to the literature (J. Li et al., 2022; B. Lin & Ma, 2022; Yang et al., 2021; H. Yu et al., 2023), these factors encompass the logarithm of GDP per capita (lnGDPP), a marker for a nation's economic development stage, the reservoir of human capital (lnHC), the extent of urbanization (lnURB), the degree of trade openness (lnOPE), and the composition of industrial structure (lnIS). Numerous investigations have studied the relationship between industrial structure and GTI, revealing that the composition of industries, specifically the ratio of the tertiary sector to the secondary sector, exerts a positive impact on GTI (Shen et al., 2021; Zhao et al., 2022b). These effects can be attributed to the alignment of tertiary industry development with the advancement of green technology (K. Du et al., 2021).
Furthermore, the financial system plays a key role in the concentration and allocation of funds (C. H. Yu et al., 2021). A less developed financial system can impede enterprises' access to credit financing, resulting in inadequate investment in GTI (Andersen, 2017). In a broader context, financial development, as indicated by lnFD, significantly influences the propensity of enterprises to engage in technological innovation (Noailly & Smeets, 2022). As a result, these elements are integrated as control factors within the analytical framework of this study, which is elucidated in the following model, referred to as Model A:

Definitions of variables.
WDI: World Development Indicator; https://datacatalog.worldbank.org/dataset/world-development-indicators.
GEM: Global Entrepreneurship Monitor; https://www.gemconsortium.org/data.
OECD: Organization for Economic Cooperation and Development; https://stats.oecd.org/.
IMF: International Monetary Fund; https://data.imf.org/?sk=f8032e80-b36c-43b1-ac26-493c5b1cd33b.
Statistics summary (2002–2020).
This analysis involves a logarithmic transformation of the variables, yielding coefficients that signify elasticities. Table 3 reports the findings resulting from the estimation of this model using a range of panel data techniques. Furthermore, in conjunction with the inclusion of control variables, this study places particular emphasis on two pivotal explanatory elements: the natural logarithm of entrepreneurship indicators (lnENT) and environmental regulations (REG). Incorporating these variables into the model results in the formulation of Model B, as illustrated below. The outcomes of estimating the model are presented in Table 4.

Estimation of various panel models for control variables.
Tests for nonlinearity.
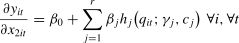
A panel smooth threshold regression (PSTR) model is a practical approach to addressing nonlinearity within the model. PSTR has dual interpretations: first, as a regime-switching model with a few extreme regimes linked with the extreme values of a transition function, transitioning smoothly; second, as a model allowing a continuum of regimes, each with distinct transition function values. PSTR proves helpful in this context by accounting for cross-country heterogeneity and time instability of elasticities without requiring pre-defined classifications. Additionally, the use of the PSTR model can enhance estimate reliability regarding non-stationarity. In contrast to time series, non-stationarity effects in linear panel models are different. Pooling cross-section and time series observations can mitigate residual impacts while retaining explanatory variable strength, yielding consistent long-run regression coefficient estimates (Phillips & Moon, 1999). Focusing on a basic scenario with two independent variables (x1it and x2it), two distinct regimes, and a solitary transition function, the resultant PSTR model is formulated as:
where qit is the threshold variable. The error term εit is considered independent and identically distributed with a mean of 0 and a variance of σ2. The function governing the transition, denoted as h(qit;γ,c), remains limited and continuous concerning the threshold variable qit. Building upon earlier research by Granger and Teräsvirta (1993) on STAR models in time series, González et al. (2004) proposed a transition function as:where c=(c1,..,cm)′ represents a multi-dimensional vector denoting location parameters. Here, γ is responsible for determining the steepness of the transition function. Mathematically, this model can be reformulated into:where Ψj=(αjβj)′ for j=(0,1), and Wit=[x1itx2it]′. Additionally, Wit is defined as [x1itx2it]′, encapsulating the variables x1it and x2it for country i at time t. González et al. (2004) proposed an extension introducing r+1 extreme regimes. This extension, termed the general additive PSTR model, is defined as:or equivalently,


The transition function hj(qit;γj,cj) is influenced by both the slope parameters γj and a set of m location parameters cj. In this broader conceptualization, the total impact of x2it on yit, within the context of country i at time t, is articulated as the weighted mean of the r+1 coefficients βj acquired from the r+1 distinct extreme regimes.
Parameter estimates for the PSTR models.
Parameter estimates for the PSTR models.
To estimate the nonlinearity of Eq. (4) for the present research, model C is defined in Eq. (6). The estimation results of Eq. (6) are reported in Table 7. Here, environmental regulation (REG) is defined as threshold variables, and depending on their values in different countries and over time, they can influence the effects of independent variables in the form of varying entrepreneurship regimes.

Average estimated parameters of individual PSTR for Model B1.
Drawing upon the estimation results of Eq. (6), Eq. (5) can be calculated for all independent variables of the model. The effects of total gross domestic product (GDP) per capita on GTI are written as:

The analysis of the impacts of various factors on GTI included estimating 21 distinct models. These models incorporated consistent control variables in all cases, including the logarithm of GDP per capita, human capital, urbanization, trade openness, and industrial structure. To ensure the independence of the assessment and to mitigate potential collinearity challenges among the 11 entrepreneurship indices, separate estimation models were used for each. To streamline the presentation of the findings in Table 5, the abbreviation "lnENT" was used to represent all entrepreneurship indicators. For example, in Models 3 and 7, lnENT denotes the logarithms of governmental programs and commercial and professional infrastructure, respectively. Table 1 shows which entrepreneurship indicator corresponds to a given estimation model.
DataWhile earlier investigations have primarily drawn upon a range of metrics, including R&D investment, patents, or the expertise of technology professionals, to evaluate a corporation's capacity for innovation (Jiang et al., 2018; Zhan et al., 2023), there is a growing trend to use green patents as the preferred benchmark for quantifying a company's innovative output. Indeed, Fang et al. (2021) asserted that green patents can effectively serve as a surrogate measure for GTI, underscoring their fundamental role in this particular context. The preference for green patent applications over green patent grants primarily arises from the temporal lag associated with the patent-granting process, which often extends from one to two years following the initial application (H. Lin & Long, 2021). Consequently, patent applications present a more suitable reflection of GTI activities.
Table 2 provides a comprehensive overview of the data from 2002 to 2020. The analysis of the standard deviations concerning the mean across various variables suggests that the data set contained no outliers. Furthermore, the consistently lower standard deviations than the means indicate remarkable stability and limited volatility within the variables of the model over the extensive time frame under consideration. This study employed the PSTR model, which inherently allows for unbalanced panel data. This enables the model to utilize all available observations, even if some variables have fewer data points than others. By contrast, for conventional linear panel models—where a balanced data set is typically assumed—the sample was restricted to those observations that were simultaneously available across all variables. This restriction, while necessary for consistency within the linear framework, naturally led to a smaller number of observations than in the PSTR model.
ResultsConventional panel modelsThis study crafted estimations for the proposed equations by using a series of diagnostic assessments aimed at determining the most suitable panel data model. This study leveraged an extensive array of panel data models and formulated Eq. (1), as shown in Table 3, which exclusively incorporates control models. The process was initiated by meticulously examining the potential inclusion of both temporal and geographic fixed effects. It entailed a comprehensive comparison between models encompassing simultaneous time and spatial fixed effects and models featuring distinct time and spatial fixed effects. Two separate likelihood ratio (LR) tests were conducted to evaluate the estimated models, with the associated p values provided within parentheses. A low p value indicates the rejection of the null hypothesis. As shown in Table 3, the results of these tests strongly support the rejection of the null hypothesis, advocating the incorporation of both time and geographic fixed effects into the model.
Additionally, the fixed effects (FE) model and random effects (RE) model were compared using the Hausman test. The Hausman test is a valuable tool for distinguishing between fixed effects and random effects models in panel analysis. The fixed effects model was selected under the alternative hypothesis, while the random effects model aligns with the null hypothesis. The findings of the Hausman test unequivocally dismiss the null hypothesis, solidifying the fixed effects model as the optimal choice for the analysis.
Based on the findings, a 1 % increase in GDP growth per capita significantly leads to a 1.731 % increase in GTI. These favorable impacts extend to other control variables, although it is worth noting that the coefficients for urbanization and environmental regulation variables do not exhibit statistical significance. Notably, a 1 % increase in trade openness corresponds to a 0.245 % increase in GTI. At the same time, the increase in the industrial structure variable, with a coefficient of 0.747, represents a critical impact on GTI. Moreover, a 1 % increase in financial development underpins a 0.418 % rise in GTI. Of particular significance among these variables is the environmental regulations factor (REG).
Interestingly, its effects prove nonsignificant in the spatial fixed effects model, yet the estimated coefficient carries significance within the time fixed effects model. Consequently, the general effects of the spatial and temporal fixed effects models appear inconclusive. While the spatial fixed effects model addresses cross-sectional heterogeneity, the time fixed effects model focuses on heterogeneities over time. Thus, the results indicate that the variable of environmental regulations may not effectively explain changes in GTI over time, even though it plays a substantial role in delineating differences in GTI among distinct nations. As mentioned, the intricate interplay of positive and negative aspects within environmental regulations can be multifaceted. Thus, the lack of statistical significance of these effects could suggest a neutral balance between their diverse impacts. Nonetheless, this review necessitates a more in-depth analysis, which is provided later.
PSTR resultsThis study involved an in-depth examination of the results by applying a PSTR model. This analytical process encompasses a series of pivotal stages. Initially, it identifies the optimal number of location parameters represented by m within transition functions, utilizing both the Schwarz and Akaike criteria. The outcome of this determination, along with the ideal m values, is provided in Table 5.
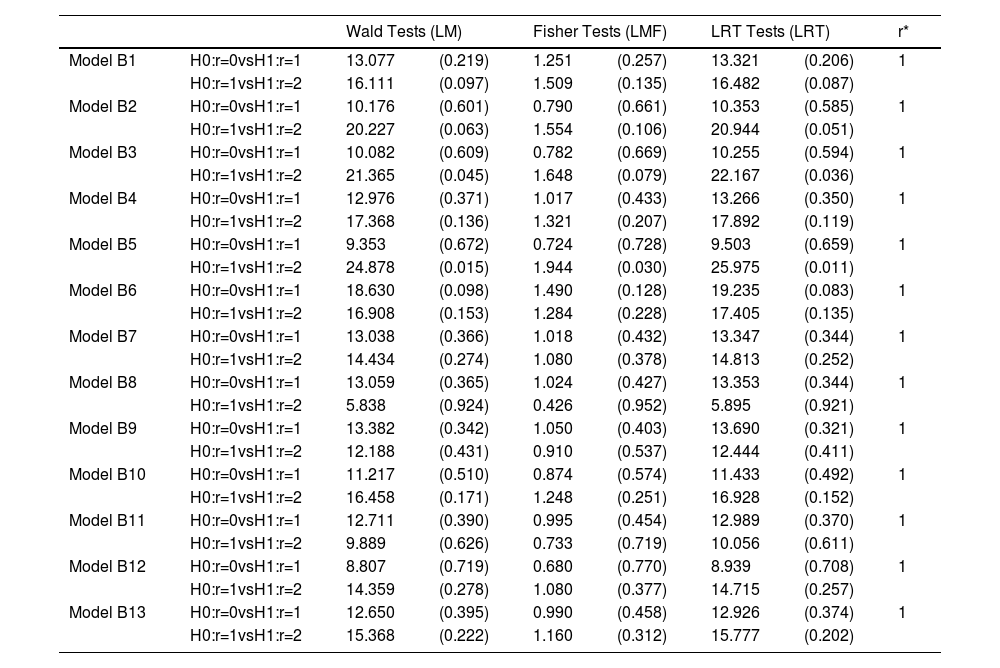
Subsequently, the study contrasts the log-linear configuration of the GTI model with an alternative specification that incorporates threshold effects, taking into account the previously established m value. In cases where the log-linear assumption falls short of validity, the analysis proceeds to ascertain the number of transition functions required to encapsulate nonlinearity or heterogeneity in GTI model parameters. In this endeavor, the work of González et al., (2004) plays a pivotal role by offering a robust testing methodology for evaluating linearity and the number of transition functions (referred to as r*). The testing process involves a continuous comparison between the null hypothesis (H0:r=r*) and the alternative hypothesis (H1:r=r*+1), incrementally increasing r* until the null hypothesis gains acceptance. The analysis is confined to the PSTR models with a maximum of four transition functions. The outcomes of these testing procedures are documented in Table 4, delivering a comprehensive evaluation of the model characteristics and results. Moreover, the study employed a variety of diagnostic tests, including Wald tests, Fisher tests, and likelihood ratio tests, to offer a thorough assessment of the model attributes and outcomes. This ensures a comprehensive and nuanced evaluation of the PSTR model.
Within the framework of a PSTR model, nonlinear characteristics are effectively represented by a constrained set of exceptional patterns. These patterns correspond to variations in parameters of independent variables observed across different countries and over time. According to Table 4, the environmental regulations factor exhibits a considerable capacity to explain these variations. The assessment of the absence of persistent nonlinearity is reflected in specifications primarily incorporating single transition functions for all models in Table 4. The parameter estimates for the final PSTR models are reported in Tables 5 and 6. The outcomes of the estimation underscore the significance of the majority of the estimated coefficients across various models. This suggests that the nonlinear analysis of GTI emphasizes the importance of all control variables employed in this research.
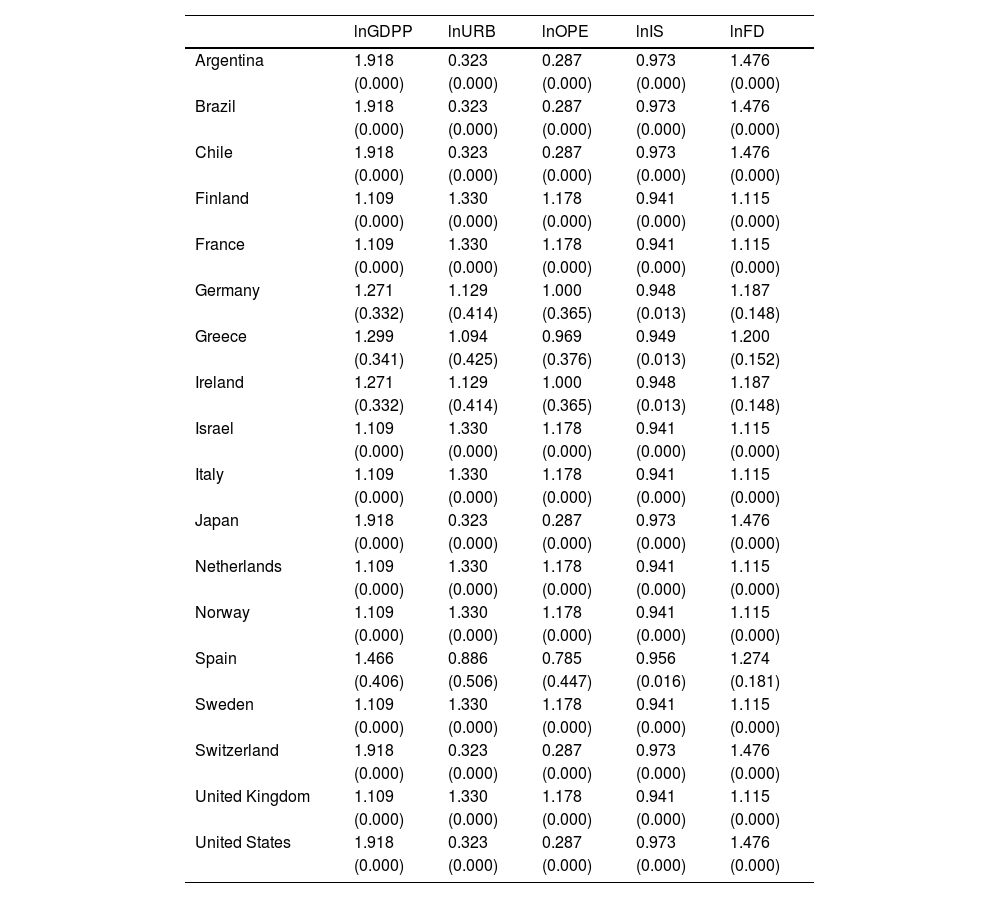
Drawing upon the parameter estimates obtained from the PSTR models, it becomes viable to measure the evolving impacts of independent variables across different time points for every country within the sample. These dynamic effects are encapsulated in Eq. (5). It is crucial to emphasize that the inferred parameters provide indirect interpretability primarily through their signs. The implications of these parameter signs, particularly within diverse contextual frameworks, provide partial insights. However, a comprehensive grasp of the intricate nonlinear effects of independent research variables on GTI necessitates the utilization of Eq. (5). It enables the derivation of weighted coefficients for each variable. The results of estimating Eq. (5) using the coefficients derived from Model B1 in Table 5 are as follows. Notably, these calculations should also be extended to the other models. This thorough exploration is vital for robustly comprehending the complex relationships between the specified variables and their impacts on GTI emissions under varying environmental regulations.


The findings allow for a more effective understanding of the direct impacts by examining β0 in Eqs. (4) and 5. Furthermore, Eq. (5) provides insight into the indirect effects, expressed as the sum of hj(qit;γj,cj). For instance, in Eq. (8), the direct effects are quantified at 1.109, while the associated indirect effects are 0.808×hj(REGit;1242.976,[3.77,1.83]). The dynamic nature of the transition function hj(REGit;1242.976,[3.77,1.83]) is noteworthy, which inherently introduces temporal and cross-national variations into these indirect effects.
Scrutinizing the statistical significance of the coefficients indicates that both direct and indirect effects in Model B1 are significant across all variables, except for the indirect effects of lnIS and lnFD. Given the complexity of detailing the projected effects encompassing Eqs. (8) to 12 for every individual model, it is necessary to provide a concise summary of the estimation results. These averaged outcomes, as indicated in Eqs. (8) to 12, are meticulously presented in Table 7. It is worth highlighting that these values represent the country average of individual effects for these variables. The values enclosed in parentheses signify the standard deviation characterizing the estimated coefficients within each nation. The consistently low standard deviations distinctly underscore the robustness and stability of the coefficients at the national level.
Despite offering valuable insights into how model variables impact GTI on a national level, Table 7 does not entirely enable a comprehensive understanding of the complex nonlinear effects of these variables on GTI, nor does it reveal the underlying explanations for the changes in the estimated parameters across countries and over time, particularly in response to various environmental regulation regimes. To explore these unique effects, it is crucial to visually represent the estimated coefficients concerning different levels of the natural logarithm of environmental regulation (lnREG). Mean coefficients are calculated on multiple scales. At a national level, as shown in Fig. 1, these coefficients represent average parameters across various time frames within specific countries. Additionally, on a temporal scale, as visualized in Fig. 2, they reflect average parameters across different countries at particular points in time.


The vertical axis within the graphical representations illustrates the mean values of the estimated parameters for each model variable, while the horizontal axis represents the average lnREG levels across different countries. Notably, the variables demonstrate consistent positive or negative effects in both diagrams. Furthermore, Figs. 1 and 2 vividly show that the average estimated coefficients, both at the temporal and national levels, shift similarly as the lnREG levels increase. The only exception is the reduced dispersion seen in the temporal average. This difference in variance could be attributed to the relatively short study period, limiting significant temporal variation. Nonetheless, these disparities are less pronounced in comparison to the distinctions in the estimated coefficients of the linear spatial and time effects models, as shown in Table 5, particularly in terms of the signs of the coefficients. This suggests that the use of the nonlinear formulation effectively addressed such disparities.
As shown in Fig. 1, all control variables within the model exhibited positive impacts on GTI. However, an escalation in environmental regulations appears to diminish the positive impact of both GDP per capita and industrial structure. Conversely, a higher degree of environmental regulation correlates with amplifying the impacts of urbanization and trade openness. These findings were derived from Model 1. The remaining figures pertain to the analysis of 11 entrepreneurship indicators, each corresponding to the estimated coefficients from Models 2–12. The results reveal that the majority of these entrepreneurship indicators exert a negative impact on GTI. Interestingly, an increase in environmental regulations gradually mitigates the adverse impacts and even transforms several indicators into positive contributors. Notably, post-school entrepreneurial education and training, basic school entrepreneurial education and training, internal market dynamics, and physical and services infrastructure fall into this category.
Among the 11 indicators, financing for entrepreneurs, governmental programs, and governmental support and policies exhibit distinctive impact patterns. These three variables initially have negative impacts on GTI at very low levels of environmental regulation. However, as environmental regulations intensify, these negative impacts gradually become positive. At environmental regulation levels around 1.69 for governmental support and policies and governmental programs and 1.49 for financing for entrepreneurs, positive impacts peak, while a further increase in environmental regulations diminishes the positive impacts, ultimately making them negative. The results underscore a turning point at an environmental regulation level of 1.82 for the remaining variables, marking a significant shift in their impact dynamics.
Conclusions and policy implicationsThis research delved into annual data sets from 2002 to 2020 across 18 countries to probe the factors influencing GTI. In line with prior research underscoring the intricate interplay between entrepreneurship, sustainability, and innovation (Bendig et al., 2022; B. Cohen et al., 2008; Coulibaly et al., 2018), this study goes beyond the assumption that all entrepreneurship indicators inherently promote GTI. By applying a PSTR model across varying degrees of environmental regulation, it addresses calls for more nuanced analyses sensitive to cross-country heterogeneity. The findings reveal that multiple entrepreneurship metrics—such as financing, governmental programs, and policy support—exert positive or negative impacts on GTI, depending on regulatory intensity, thus filling a gap in the literature (i.e., examining these relationships in tandem). Consequently, this work not only refines current debates on how entrepreneurial ecosystems influence sustainable innovation but also provides actionable insights for policymakers seeking to harmonize economic growth strategies with rigorous environmental objectives.
According to the findings, GDP expansion per individual and financial development play a pivotal role in fostering GTI. As agents and nations amass wealth, their inclination to prioritize environmental considerations and invest in eco-friendly innovations becomes more pronounced. An elevated GDP per inhabitant gives governments and businesses the monetary instruments to back research and advancement in the green technology sector while stimulating market demand for sustainable products and services. Financial expansion is a complementary factor, supplying funds, reducing funding expenditures for green tech enterprises, and streamlining the trade of environmental assets such as carbon allowances. Furthermore, financial organizations and investors are progressively integrating environmental, social, and governance (ESG) standards into their decision-making protocols, encouraging businesses to align with green tenets and expedite the development of sustainable innovations.
However, the findings reveal that stringent ecological regulations can mitigate the positive impacts of GDP per capita and monetary development on GTI. Such mandates tend to impose compliance expenditures on businesses, diverting resources from research and advancement endeavors. Enterprises may opt for immediate compliance over long-term innovation, thereby impeding progress in green technology. Consequently, conceptualizing and implementing ecological regulations must be scrupulously considered to prevent unintended negative ramifications, even though these negative impacts on financial development are less significant.
The observational evidence indicates that a transition in the industrial structure toward an augmented reliance on the tertiary domain, which encompasses services, positively influences GTI. The tertiary sector, recognized for its role in research, development, and data exchange, stimulates the demand for cutting-edge green technologies to raise efficiency and mitigate environmental ramifications. Service sectors play a crucial role in expediting the adoption of green technologies and the exchange of expertise, thus nurturing a supportive framework for GTI. While ecological regulations hold the capacity to mitigate the positive impacts of this transition, their impacts remain relatively modest. Moreover, the findings imply that environmental regulations can enhance the positive impact of urbanization on GTI. Urban areas often contend with intensified environmental challenges, which fosters a greater appetite for green technologies. The aggregation of enterprises, research institutions, and skilled human capital in cities catalyzes collaborative efforts and the sharing of knowledge, accelerating GTI. Ecological regulations serve as catalysts by establishing benchmarks and offering incentives, thus promoting collaboration and driving the development and adoption of sustainable technologies within urban landscapes.
Furthermore, the findings suggest that an environmental mandate can complement the impacts of trade openness, further amplifying the positive impact on GTI. Trade liberalization broadens entry to international markets, expanding the market base for green technologies and cultivating ingenuity through economies of scale and competition. This liberalization also facilitates knowledge and technology transfer between nations, encouraging transnational collaboration and disseminating best practices in green innovation. Simultaneously, ecological regulations provide a supportive infrastructure, encouraging businesses to allocate to eco-friendly technologies, thereby consolidating their impact on GTI.
The empirical findings highlight that the majority of entrepreneurship metrics exert a detrimental impact on GTI. Several factors underpin this deleterious impact. First, venture indicators prioritizing immediate profitability and market-driven deliberations, such as return on investment (ROI) and time to market (TTM), may dissuade allocations to GTI. Venture capitalists prioritize projects with short-term returns and established markets, a perspective incongruent with the longer horizons and uncertainties intrinsic to green technology development. Consequently, capitals that could have been designated to GTI are diverted toward more traditional ventures with immediate yields. Second, such venture indicators can unwittingly incentivize businesses to cut corners and engage in environmentally detrimental practices, particularly without stringent or rigorously enforced ecological regulations. Metrics emphasizing economic efficiency and competitiveness can encourage expenditure-reducing measures that compromise ecologically responsible processes and materials. This ardent focus on venture indicators may lead to a race to the bottom regarding ecological responsibility, undermining GTI efforts and contributing to ecological deterioration.
Among the 11 indicators under scrutiny, financing for innovators, governmental programs, and governmental assistance and policies exhibit a distinct impact pattern defined by an inverted U-shape. Their beneficial effects peak at specific tiers of environmental regulation; however, additional regulations attenuate positive impacts, eventually changing them into adverse impacts. Unlike other venture metrics, these three factors strongly underscore providing direct monetary assistance to entrepreneurs, necessitating an analysis from a financial efficacy perspective. This inverted U-shaped pattern is attributed to the synergistic interplay between regulatory limitations and support mechanisms. As ecological regulations become more rigorous, entrepreneurs are initially incentivized to embrace environmentally sustainable practices and technologies, resulting in favorable fiscal and environmental outcomes. Nevertheless, overly burdensome or rigid regulations can introduce supplementary compliance costs and hamper innovation, diminishing the positive impacts of these support mechanisms. Striking the optimal regulatory equilibrium is pivotal to promoting sustainable economic and environmental development as excessively stringent regulations can discourage venture initiatives and hinder economic growth, leading to adverse impacts.
The findings—that certain entrepreneurship indicators negatively affect GTI—reflect broader debates in the entrepreneurship ecosystem literature, where short-term profitability metrics can overshadow long-term ecological objectives (Melander & Arvidsson, 2022; Zhang et al., 2020b). As Iqbal et al. (2020) and York and Venkataraman (2010) emphasized, green entrepreneurship requires not only market incentives but also explicit policy support to thrive. Accordingly, the divergence observed between cost-focused and sustainability-oriented approaches in entrepreneurial ventures underscores the need for targeted interventions that encourage environmental responsibility without stifling business dynamism (B. Cohen et al., 2008; Coulibaly et al., 2018).
These patterns resonate with the innovation compensation versus cost compliance tension described by the Porter hypothesis (Porter & Van Der Linde, 2017). It was found that modestly stringent environmental regulations can spur corporate creativity—especially in urbanized settings—leading to greener technologies and processes (Hobman & Frederiks, 2014; Kraus et al., 2020). Conversely, when regulations become excessively rigid, compliance expenses may eclipse the potential gains from innovation, mirroring evidence that excessive regulatory burdens hamper R&D and entrepreneurial ambition (Jaffe et al., 2000; Zhang & Dong, 2022). The findings thus support the notion that the success of environmental regulations in driving GTI depends on careful policy calibration, ensuring that the economic and ecological benefits of entrepreneurial activities are maximized.
Moreover, the heightened positive impacts of collaboration—especially when established corporations and born green startups join forces—underline the role of entrepreneurial ecosystems in scaling green innovation (Bendig et al., 2022; Demirel et al., 2019). By fostering an environment that shares knowledge, mitigates financial risk, and facilitates alliances, policymakers can help entrepreneurs pivot toward more sustainable products and services (W. M. Cohen & Levinthal, 1989). This approach is particularly salient for urban centers, where dense networks of firms, universities, and innovators can accelerate the diffusion of eco-friendly practices (Zhao et al., 2022a; Zhu et al., 2019). Therefore, the integration of balanced environmental regulations with supportive entrepreneurial frameworks can amplify the positive impacts of innovation on sustainability, aligning economic growth with environmentally responsible outcomes.
The policy recommendations derived from this analysis advocate for a comprehensive approach to promoting GTI. Most importantly, it is essential to balance nurturing entrepreneurship with ensuring environmental sustainability. Well-crafted, stringent environmental regulations can counter entrepreneurship indicators that might otherwise hinder GTI by emphasizing short-term gains and environmentally detrimental practices. Policymakers should contemplate establishing explicit sustainability goals and incentives for businesses to adopt green technologies and sustainable practices. Additionally, policies supporting research, development, and knowledge sharing in urban areas can facilitate the transition toward a knowledge-based economy focused on the tertiary sector. Finally, recognizing the inverted U-shaped impact of specific entrepreneurship indicators in response to environmental regulations, policymakers should prioritize maintaining an optimal trade-off between regulatory constraints and support mechanisms. Achieving such a trade-off is critical for motivating and supporting innovation while avoiding undue regulatory burdens that could dissuade entrepreneurship and economic growth.
CRediT authorship contribution statementMohsen Khezri: Writing – review & editing, Writing – original draft, Visualization, Validation, Software, Resources, Methodology, Formal analysis, Data curation, Conceptualization.
The authors declare that they have no conflict of interest. There are no financial or nonfinancial interests that are directly or indirectly related to this work.