

This paper evaluates product efficiency in the Spanish automobile market. We use non parametric frontier techniques in order to estimate product efficiency scores for each model. These scores reflect the minimum price for which each car could be sold, given the bundle of tangible features it offers in comparison to the best-buy models. Unlike previous research, we use discounted prices which have been adjusted by car dealerships to meet sale targets. Therefore, we interpret the efficiency scores as indicators of the value of the intangible features of the brand. The results show that Audi, Volvo, Volkswagen and Mercedes offer the greatest intangible value, since they are heavily overpriced in terms of price/product ratios. Conversely, Seat, Kia, Renault and Dacia are the brands that can be taken as referent in terms of price/product ratios.
Este artículo analiza la eficiencia de producto en el mercado español del automóvil, utilizando para ello métodos de frontera no paramétricos. Los índices de eficiencia de producto indican el precio mínimo a que cada automóvil podría venderse, dado el conjunto de atributos tangibles que ofrece en comparación con las mejores compras. A diferencia de investigaciones previas, se utilizan los precios ajustados que incluyen los descuentos hechos por los concesionarios para poder alcanzar los objetivos de ventas. Esto permite interpretar los índices de eficiencia como un indicador del valor de las características intangibles de cada modelo. Los resultados muestran que son Audi, Volvo, Volkswagen y Mercedes las marcas que ofrecen un mayor valor intangible, dado que sus modelos tienen una relación precio/producto muy desfavorable. Por el contrario, Seat, Kia, Renault y Dacia son las marcas que pueden tomarse como referencia en términos de su relación precio/producto.
Business competitive analysis is concerned with the ability of competitors to deliver products with similar or superior product/price ratios in the marketplace, which can be obtained at a similar or lower cost. Competitive advantage exists when the firm either offers a higher added value for a given price (through product differentiation) or when costs are lower for a similar quality. Actually, market price is the variable that splits the value created between the firm and the customer. While the difference between price and cost provides a profit margin for the firm, the difference between the value of the product and its price provides a rational reason for a customer to purchase. And, in fact, no competitive advantage can emerge for a firm if customers do not purchase its products. Price setting is a critical decision in this regard. If the price is just too high for the merits of the product, sales (and profits) will tend to be low. Alternatively, if the price is too low for the merits of the product, sales will be high, but margins will be unnecessarily low. The right price is the one that reflects the merits of the product appropriately, while providing a reasonable profit margin for the firm.
But how can we determine how valuable the merits of a product are? There is a growing body of literature aimed at evaluating the relative merits of competing products on the basis of product attributes and prices. This line of research is rooted in the seminal work of Lancaster (1966) who described a product as a combination of attributes or a vector in the quality-price space. Following this representation, it is straightforward to construct a theoretical frontier with the products showing the highest quality/price ratios. The competitiveness or appeal of a product could then be inferred by the distance of the product vector to the frontier containing the best-buy products. Most customers are not attracted to buy either the highest quality or the lowest priced product. Instead, products with the best quality/price ratio will be favored by the bulk of the market, since prospective customers will seek to maximize that ratio (Rust & Oliver, 1994). Product efficiency, understood as the comparison of the product to the best-buy frontier can then be considered as an indicator of the relative customer's perceived value, i.e., the value received for the money paid (Smirlis, Despotis, Jablonsky, & Fiala, 2004).
The estimation of customer's perceived value is a central research concern in business strategy and marketing (Zeithaml, 1988; Dodds, Monroe, & Grewal, 1991; Holbrook, 1994). The traditional approach relied on bi-dimensional maps of perceived value (Gale, 1994; Brayman, 1996). The methodology requires listing the relevant attributes of the product and asking well-informed consumers to evaluate those attributes for a given product and to weight the relative importance of each attribute. This information can then be combined into a composite indicator of relative quality that can be compared with the relative price of the product. While this approach is quite straightforward, it also introduces obvious biases in product assessment, since subjective evaluation will vary as a function of variables such as age or income of respondents (Bolton & Drew, 1991).
More sophisticated non-parametric frontier techniques can be applied to compare the measurable attributes of a set of competing products. Data envelopment analysis (DEA) is a frontier-based tool that has been extensively used during the last 30 years to measure efficiency in production by comparing input–output vectors to an empirically constructed best-practice frontier (Emrouznejad, Parker, & Tavares, 2008). The adaptation of the DEA methodology to the estimation of the relative perceived value of competing products was first proposed by Doyle and Green (1991). They applied DEA to compare 37 computer printers on the basis of measurable and objective product attributes. After this pioneering application, many scholars have applied this technique to different sectors such as notebooks (Fernández-Castro & Smith, 1996), numerical control machines (Sun, 2002), mobile phones (Smirlis et al., 2004; Lee, Hwang, & Kim, 2005), computer printers (Seiford & Zhu, 2003) and, most notably, automobiles. To our knowledge, the DEA approach has been applied to evaluate product efficiency in automobile markets by Papagapiou, Mingers, & Thanassoulis (1997), Papahristodoulou (1997), Fernández-Castro and Smith (2002), Fernández-Castro and Doldán (2002), Staat and Hammerschmidt (2005) and, more recently, Oh, Lee, Hwang, & Heshmati (2010). Within the automobile industry other papers have focused exclusively on evaluating the environmental impact of the products (Kortelainen & Kousmanen, 2007).
In this paper, we build on previous literature to evaluate product efficiency in the Spanish automobile market. In doing so, we pay special attention to overcoming some of the most common empirical limitations of this body of research from three basic aspects. The first issue that has been largely overlooked in previous research is the fact that car dealers usually make big price adjustments, cutting the model's official price, in order to meet sales targets. Using the official price list may be the right approach for comparing computer printers, but will surely be misleading for comparing automobiles. Some brands make huge discounts (even official discounts) that are not registered in the official price list. Real market prices can be completely different from official ones. In this paper we will use real (discounted) market prices for the models analyzed.
The second limiting aspect of previous literature is the focus on a very narrow part of the market. The number of models and versions included in the empirical applications is typically very small relative to the extent of the real market. In this paper, we use data on more than 900 versions of 79 different models from 22 brands. Non parametric frontier methods require extensive samples because the frontier is not estimated as a function but as an envelope of the data available. If few data are available, the DEA frontier will be a very imperfect representation of the underlying market frontier.
The third limiting aspect of previous research that we want to address in this paper is the number of attributes which are accounted. In general terms, previous research has been limited to a few visible and objective car attributes, such as horse power, speed, fuel consumption or price. In this paper, we combine information of more than 70 variables in order to obtain the final composite indicator of product efficiency.
2DataIn order to approach the efficiency value of a product, we have to compile a complete data set to account for the product's most relevant attributes. We limit our sample to passenger cars (excluding superminis such as the SMART model) and multi-purpose vehicles (MPVs). Therefore, we explicitly exclude from the study the segments of sports cars, superminis, off-road vehicles or pick-ups, because we consider that the comparison of these vehicles with the rest makes no sense. We only consider diesel versions, which are (by and large) the most demanded in Spain. Therefore, gasoline, hybrid and electric vehicles are also excluded from the sample. We used publicly available information about the most commonly used models commercialized in Spain in November 2010. All the data come from the printed car magazine AUTOFACIL and from the online car magazine KM77.COM. These publications contain updated information on all the relevant technical data of the different versions of each model and also on the standard and optional equipment of each version. For each model's version we compiled the following data:
2.1Technical dataDiscounted price 1: best price offered by UNOAUTO, which is actually available by at least one car dealer
Discounted price 2: best price offered by AUTODESCUENTO, which is actually available by at least one car dealer
Discounted price: average of discounted price 1 and discounted price 2 (this will be the price used in the DEA analysis)
Size: length/width/height. We use the product of these three variables as a volume measure of the size of the vehicle
Boot space: in liters
Real horse power: engine maximum horse power divided by car weight.
Fuel consumption: kilometers per liter
Speed: maximum car speed
Acceleration: average acceleration in meters per second squared until the car reaches a speed of 100km/h (this is obtained by dividing the constant 27.7 by the time in seconds that is required to reach that speed). We make this transformation in order to use the variable as an output in the DEA model, instead of an input.
Safety: passenger protection score in EuroNcap crash tests (the models that did not perform the EuroNcap test were normalized to a value 0.6, which is the minimum value obtained by the cars that performed the test)
Ecology: the result of dividing 100 by CO2 emissions. Spanish car taxes use 100 as a cutoff point to distinguish the most ecological cars (i.e., those with emissions below 100). We make this transformation in order to use the variable as an output in the DEA model.
We registered with dummy variables whether the version does or does not include the following items within the standard equipment (at the discounted price):
Active safety equipment: ABS, ESP, EBD, BAS, TCS
Passive safety equipment: front airbags, rear airbags, curtain airbags, knee airbag, pre-safe, isofix
Comfort seats: adjustable, leather, heated, electric, sportive, etc.
Electronics: radio, DVD, bluetooth, GPS, parking sensors, parking camera, special sound system, tire pressure monitoring system, cruise control, USB and i-Pod connections, TV, on board computer, etc.
Lights: fog lights, xenon lamps, bixenon lamps, adaptive lamps, automatic lights
Aesthetics: alloy wheels, tinted windows, metallic or pearl paint, metallic or wood details, spoilers, sport pedals, etc.
Comfort: panoramic roof, sunroof, electrically operated wing mirrors, electrochromic rear-view mirror, keyless entry, central locking, power windows, steering wheel-mounted controls, leather-wrapped steering wheel, air conditioning, automatic air conditioning, power steering, number of doors, etc.
Mechanical aids: front/rear/4x4 drive, manual/automatic transmission.
The most complex part is the evaluation of the standard equipment. The number of potential elements is so great that introducing them as dummies into the DEA program would generate absurd results. Instead, it is preferable to aggregate all this information into a synthetic indicator of the value of the standard equipment that is included at the discounted price. This will allow comparing vehicles with different standard equipment levels. Our approach was to check, for each of these elements, which was the average price at which they were offered as an optional extra in other models. For instance, a car model that includes ESP would receive a value of about 600€ (the average price of ESP when it has to be added as an extra) for having that item included within the car's equipment. For computing the average prices, we considered all the models in which each of the elements was listed as an optional extra (i.e., not only the models included in our sample). By applying these prices to the list of standard equipment, we obtained a variable (Equipment) that is entered as an additional output to the DEA model.
3MethodsIn order to obtain the index of product efficiency for each model's version, we constructed a DEA best-buy frontier. This frontier is obtained from the comparison of the data on inputs and outputs of all the versions in the sample. In the case of product efficiency, the inputs would be the features that the customer would like to minimize (e.g., price, fuel consumption, etc.). The outputs would be the features that the customer wants to maximize (e.g., horse power, equipment, etc.). In this research we will only consider one input: discounted price. The rest of the cars’ features have been measured in a specific way in order to treat them as outputs (i.e., more is better). The outputs included in our DEA model are: ecology, fuel consumption, real horse power, maximum speed, acceleration, volume, boot space, safety and equipment. Therefore, we propose a model with one input and nine outputs to construct the best-buy frontier. Cars located on the frontier can be considered as best-buys since they offer a unique combination of input and outputs, one that cannot be beaten by any other product that is available in the market. It is just not possible to find another car that costs the same and offers more of each of the nine outputs. Therefore, it can be considered as a benchmark or a rational choice.
Even though there are numerous versions of the DEA programs, in this paper we followed the original formulation of Charnes, Cooper, & Rhodes (1978). The DEA program finds the maximum radial contraction in the inputs (input orientation) or the maximum radial expansion in the outputs (output orientation). In our case, we are interested in controlling all the inputs and outputs, but we are only interested in knowing the right price for each bundle of attributes (as represented by the outputs of each model's version). This can be easily done using Kopp's (1981) single input efficiency measure, or adapting the DEA setting to have just one input. We follow this second approach, by converting all the features that should be naturally considered as inputs (fuel consumption, CO2 emissions, etc.) into outputs. Therefore, our model will seek to minimize the price at which each outputs bundle can be purchased in the market. The constant returns to scale DEA model with an input orientation implies solving the following linear program:
where yis is output s for model version i and pi is its discounted price. The mathematical program searches the combination of other vehicles that would be equivalent to a virtual model with a similar or a better outputs bundle (the same quantity of each output or more) with the lowest discounted price. The weights λj indicate, when they are different from zero, the vehicles that compose the referent point on the best-buy frontier. When λi=1, there is no other car (or linear combination of them) offering more outputs at the same price or lower. Conversely, if the car is not on the frontier, then there must exist, at least, another vehicle (h) in the sample with λh>0, which offers a better deal (or a linear combination of them). The objective function (i.e., the DEA product efficiency score) reflects the overprice that customers are paying for that particular model's version, which cannot be rationalized on the basis of the tangible features of the car.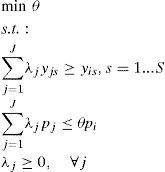
Banker, Charnes, & Cooper (1984) added to this basic model the constraint that the sum of the weights be equal to 1 (Σλ=1). The result is that comparisons are restricted to the convex hull of the data. In the context of productivity analysis, this is interpreted as a variable returns to scale technology. The consideration of variable or constant returns to scale is actually meaningless in our setting, because we are not constructing a production frontier. However, Hollingsworth and Smith (2003) have shown that when data on inputs and outputs represent ratios of other variables, the Banker et al. (1984) model is more appropriate. Given that many of our variables are constructed as ratios, we will use the variable returns to scale version of the DEA program in the evaluation of the automobile models in our empirical application.
Once the DEA scores are obtained, we will try to explore the relationship between those scores and the intangible features of the model, which may be associated with the brand name. In the automobile market, consumers derive value from the status associated with premium brands. Furthermore, the brand can be interpreted as a signal of the mechanical reliability of a car and other aspects such as design or technical service, which are learned from past history and interaction. Therefore, image and reliability can be associated with brand name. Other aspects that may condition the price policy are some tangible features of the car. For instance, larger cars may have a higher overprice, since buyers of large cars may not be as sensitive to price as buyers of small cars. Another policy that may be related to overprice is the level of standard equipment. Models that include more elements of equipment can be more overpriced, since it would be more difficult for the buyer to establish comparisons with competing products. We can operationalize these concerns in a model with the following specification, in which the overprice of a car is related to brand (B) and to a vector of car features (Y) that include size and equipment:

Given that the DEA scores are bounded within the interval (0, 1], we will use a truncated regression model in order to estimate the coefficients efficiently.
4ResultsWe ran the DEA program for each of the 919 car versions included in the sample. Fig. 1 shows the brand averages of the product efficiency scores. Not surprisingly, Dacia leads the product efficiency frontier with an average score of 0.976, with 60% of its models on the frontier. In technical terms, Dacia is a best-buy option, since it offers robust mechanical features at a comparatively low price. Following Dacia, we observe a group of seven brands with averages around 0.9. These brands are Kia, Fiat, Renault, Hyundai, Seat, Opel and Citroën. Five of them are well established European generalist brands. The other two (Kia and Hyundai) are Korean brands, which belong to the same matrix company. These firms price very aggressively in order to gain a place in this highly competitive market. Volvo, Audi and Volkswagen are the most overpriced brands according to the DEA frontier. The VAG group has four brands present in the sample (Audi, Volkswagen, Skoda and Seat). Many of their models are mechanically very similar, but Seat offers the lowest prices. The comparison with Seat makes Audi, Volkswagen and Skoda inefficient (overpriced) products, especially those of Audi. Something similar seems to be happening with the two brands of group PSA (Peugeot and Citroën) and the brands of the Fiat group (Fiat and Lancia).
.")
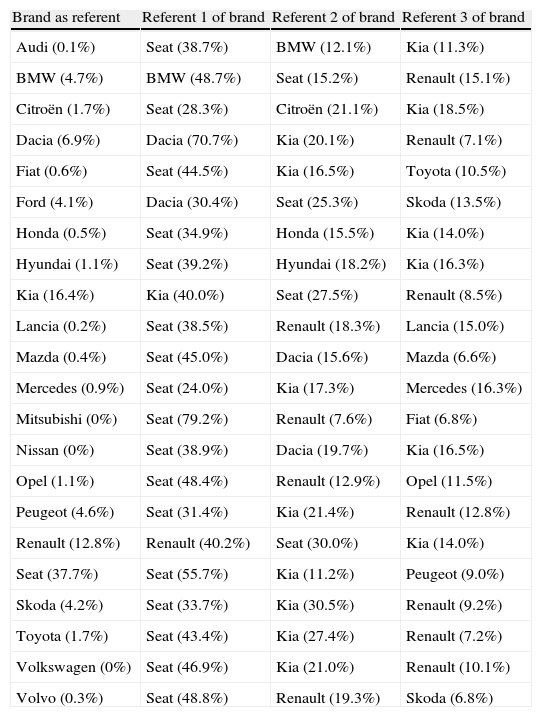
Even though Dacia is the brand offering the best average deal, it is not a good referent for many models. Ford is the brand that serves more often as a referent for other brands. It does not have many models on the frontier, but one version of the Ford Focus serves as referent in the DEA program of 224 other models and one version of the Ford Mondeo is a referent for 235 models.1 On average, each Ford car included in the sample serves as a referent for 13.2 overpriced models. Ford is followed by Peugeot (11.9), Renault (11.8), Seat (11.0) and Opel (10.4). These figures, however, do not account for the intensity with which a brand is considered as a referent for others, which can be approached by the value of the intensity vector (λ) estimated through the DEA program. Table 1 shows for each brand the three referent brands that are used with more intensity in the DEA program, indicating the intensity as a percentage.
Brands as referents for other brands (intensity in brackets).
| Brand as referent | Referent 1 of brand | Referent 2 of brand | Referent 3 of brand |
| Audi (0.1%) | Seat (38.7%) | BMW (12.1%) | Kia (11.3%) |
| BMW (4.7%) | BMW (48.7%) | Seat (15.2%) | Renault (15.1%) |
| Citroën (1.7%) | Seat (28.3%) | Citroën (21.1%) | Kia (18.5%) |
| Dacia (6.9%) | Dacia (70.7%) | Kia (20.1%) | Renault (7.1%) |
| Fiat (0.6%) | Seat (44.5%) | Kia (16.5%) | Toyota (10.5%) |
| Ford (4.1%) | Dacia (30.4%) | Seat (25.3%) | Skoda (13.5%) |
| Honda (0.5%) | Seat (34.9%) | Honda (15.5%) | Kia (14.0%) |
| Hyundai (1.1%) | Seat (39.2%) | Hyundai (18.2%) | Kia (16.3%) |
| Kia (16.4%) | Kia (40.0%) | Seat (27.5%) | Renault (8.5%) |
| Lancia (0.2%) | Seat (38.5%) | Renault (18.3%) | Lancia (15.0%) |
| Mazda (0.4%) | Seat (45.0%) | Dacia (15.6%) | Mazda (6.6%) |
| Mercedes (0.9%) | Seat (24.0%) | Kia (17.3%) | Mercedes (16.3%) |
| Mitsubishi (0%) | Seat (79.2%) | Renault (7.6%) | Fiat (6.8%) |
| Nissan (0%) | Seat (38.9%) | Dacia (19.7%) | Kia (16.5%) |
| Opel (1.1%) | Seat (48.4%) | Renault (12.9%) | Opel (11.5%) |
| Peugeot (4.6%) | Seat (31.4%) | Kia (21.4%) | Renault (12.8%) |
| Renault (12.8%) | Renault (40.2%) | Seat (30.0%) | Kia (14.0%) |
| Seat (37.7%) | Seat (55.7%) | Kia (11.2%) | Peugeot (9.0%) |
| Skoda (4.2%) | Seat (33.7%) | Kia (30.5%) | Renault (9.2%) |
| Toyota (1.7%) | Seat (43.4%) | Kia (27.4%) | Renault (7.2%) |
| Volkswagen (0%) | Seat (46.9%) | Kia (21.0%) | Renault (10.1%) |
| Volvo (0.3%) | Seat (48.8%) | Renault (19.3%) | Skoda (6.8%) |
We find that Seat is the brand that serves as referent of inefficient models with more intensity. Globally, Seat is used as a benchmark, with an average intensity of 37.7%, followed by Kia with 16.4%, Renault with 12.8%, Dacia with 6.9% and, remarkably, BMW with 4.7%. We must indicate, however, that BMW models serve mainly as referents for other BMW models, which find no comparison with best-buy (frontier) brands. At the other extreme, Audi, Lancia, Volvo, Mazda, Honda, Fiat and Mercedes are the least active benchmark brands. They do not reach a joint 1% and they mostly serve as referents for other cars with the same brand.
Table 1 also shows the three main referents for the overpriced models of each brand. For instance, we can observe that Audi's models are considered overpriced when compared with those of Seat, BMW and Kia. Seat accounts for 38.7% of the DEA comparisons of Audi's models, which is not surprising, since many Audi models are technically identical to the equivalent Seat models (with some differences in design and the quality of some materials). In the case of BMW, we observe that almost half of the comparison comes from other BMW models. Therefore, BMW seems to be less overpriced than other premium brands (Audi, Mercedes, Volvo) and, additionally, half of the overpriced models are determined to be so when compared with other BMW models. This indicates that BMW would be a rational choice even if the customer bases the purchasing decision exclusively on tangible attributes. The table shows these figures for all the brands included in the sample.
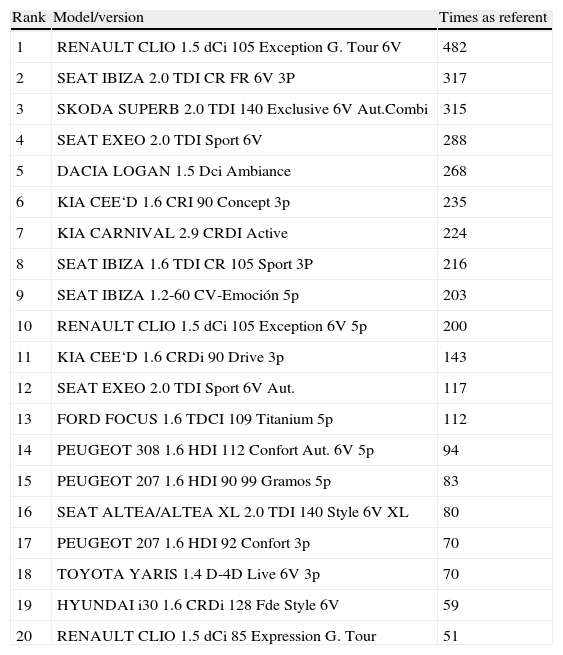
It may also be interesting to know the models’ versions that are considered as benchmarks for overpriced models most frequently (Table 2). A very versatile version of the Renault Clio (G. Tour with a very efficient and well-known engine of the brand) emerges as a referent (in most cases as part of a composite linear combination) for 482 overpriced models. This amounts to 62% of the overpriced models in the sample. Another two versions of the Clio are among the TOP20 benchmark models. Additionally, three versions of the Seat Ibiza (with different engines and equipment) are included in the TOP10 of Table 2.
Rank of benchmark models.
| Rank | Model/version | Times as referent |
| 1 | RENAULT CLIO 1.5 dCi 105 Exception G. Tour 6V | 482 |
| 2 | SEAT IBIZA 2.0 TDI CR FR 6V 3P | 317 |
| 3 | SKODA SUPERB 2.0 TDI 140 Exclusive 6V Aut.Combi | 315 |
| 4 | SEAT EXEO 2.0 TDI Sport 6V | 288 |
| 5 | DACIA LOGAN 1.5 Dci Ambiance | 268 |
| 6 | KIA CEE‘D 1.6 CRI 90 Concept 3p | 235 |
| 7 | KIA CARNIVAL 2.9 CRDI Active | 224 |
| 8 | SEAT IBIZA 1.6 TDI CR 105 Sport 3P | 216 |
| 9 | SEAT IBIZA 1.2-60 CV-Emoción 5p | 203 |
| 10 | RENAULT CLIO 1.5 dCi 105 Exception 6V 5p | 200 |
| 11 | KIA CEE‘D 1.6 CRDi 90 Drive 3p | 143 |
| 12 | SEAT EXEO 2.0 TDI Sport 6V Aut. | 117 |
| 13 | FORD FOCUS 1.6 TDCI 109 Titanium 5p | 112 |
| 14 | PEUGEOT 308 1.6 HDI 112 Confort Aut. 6V 5p | 94 |
| 15 | PEUGEOT 207 1.6 HDI 90 99 Gramos 5p | 83 |
| 16 | SEAT ALTEA/ALTEA XL 2.0 TDI 140 Style 6V XL | 80 |
| 17 | PEUGEOT 207 1.6 HDI 92 Confort 3p | 70 |
| 18 | TOYOTA YARIS 1.4 D-4D Live 6V 3p | 70 |
| 19 | HYUNDAI i30 1.6 CRDi 128 Fde Style 6V | 59 |
| 20 | RENAULT CLIO 1.5 dCi 85 Expression G. Tour | 51 |
The DEA program also shows the output features that could be improved without raising the price of the car. As these results are not the main objective of the DEA program, they are called ‘slacks’. For instance, the slack for real horse power indicates the additional increase in real horse power that a car should offer in order to be totally comparable with the benchmark cars located on the best-buy frontier. Fig. 2 shows the cumulative slacks in the nine output features considered in the DEA program, as a percentage of the actual value.

Mitsubishi and Volvo are not just overpriced (Fig. 1) but could also increase the nine output features of their models by about a cumulative 50%, which means about 5.5% per output feature (Fig. 2). These brands behave especially poorly in terms of CO2 emissions, as reflected by the Ecology slacks. Audi has the third largest cumulative slack in the outputs (being the second worst brand in terms of product efficiency). Audi's main slacks are observed in equipment and fuel consumption.
It is not surprising to find generalist brands (Renault, Seat, Opel, Citroën), low cost brands (Dacia) and Korean brands (Kia, Hyundai) dominating the best-buy frontier. The market approach of these brands is offering a good price/product relationship, and this is exactly what the DEA frontier is composed of Premium brands (Mercedes, Audi, BMW, Volvo) may be adding an important dose of brand image to their products and, therefore, overpricing is the expected outcome. We saw in Fig. 1 that Volvo, Audi and Mercedes are indeed highly overpriced brands. However, this is not the case with BMW, which is still an expensive brand, but offers a bundle of output features that other brands can hardly match at the same price. Fig. 2 reinforces this view, since Audi, Mercedes and Volvo show considerable slack, while BMW is among the most adjusted brands in terms of output slack. In the case of Audi, this is due mainly to the sharing of most mechanical features with Seat, which is clearly the frontier benchmark brand that makes Audi so overpriced. In the case of Mercedes and Volvo, they simply seem to be heavily overpriced. But in the case of BMW, its customers’ purchasing decision can be rationalized not just in terms of brand image, but also in terms of product/price ratio.
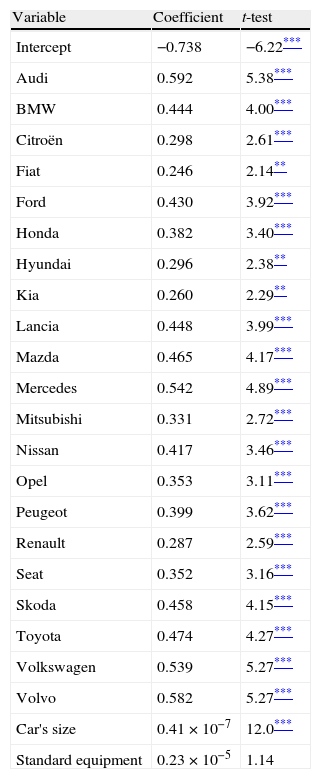
We have regressed the overprice scores (1−θ) on a list of brand dummy variables and the two car features that we expected to be related with overpricing (size and equipment). We excluded Dacia from the list of dummy variables. Therefore, the results of the brand dummy variables have to be interpreted in comparison with Dacia. The complete results are shown in Table 3. The coefficients of the dummy variables confirm the results shown in Fig. 1, with Audi and Volvo as the most heavily overpriced brands, followed by Mercedes and Volkswagen. Clearly this effect comes from a perception of brand quality and image of these brands. In this sense, the brand coefficients can be interpreted as the implicit value that the brand adds to the model. Since we are using discounted prices, we can assume that customers purchase those models at a technical overprice, which means they obtain some compensating utility from brand intangible attributes (image, post-sale service, perceived reliability, perceived quality of components, etc.). Audi (0.59), Volvo (0.58), Mercedes (0.54) and Volkswagen (0.54), would be the brands for which customers are willing to pay more, for a given bundle of tangible product attributes. Assuming that discounted prices have been adjusted to the levels that make the models competitive in the marketplace, these are the brands that offer more intangible value. The case of other premium brands, such as BMW, is different. BMW's customers pay a relatively small overprice for the intangible properties associated with the brand (0.44), which suggests that the bundle of tangible product attributes is more appealing and would be competitive even without such a strong brand name.
Determinants of car overprice.
| Variable | Coefficient | t-test |
| Intercept | −0.738 | −6.22*** |
| Audi | 0.592 | 5.38*** |
| BMW | 0.444 | 4.00*** |
| Citroën | 0.298 | 2.61*** |
| Fiat | 0.246 | 2.14** |
| Ford | 0.430 | 3.92*** |
| Honda | 0.382 | 3.40*** |
| Hyundai | 0.296 | 2.38** |
| Kia | 0.260 | 2.29** |
| Lancia | 0.448 | 3.99*** |
| Mazda | 0.465 | 4.17*** |
| Mercedes | 0.542 | 4.89*** |
| Mitsubishi | 0.331 | 2.72*** |
| Nissan | 0.417 | 3.46*** |
| Opel | 0.353 | 3.11*** |
| Peugeot | 0.399 | 3.62*** |
| Renault | 0.287 | 2.59*** |
| Seat | 0.352 | 3.16*** |
| Skoda | 0.458 | 4.15*** |
| Toyota | 0.474 | 4.27*** |
| Volkswagen | 0.539 | 5.27*** |
| Volvo | 0.582 | 5.27*** |
| Car's size | 0.41×10⁻⁷ | 12.0*** |
| Standard equipment | 0.23×10⁻⁵ | 1.14 |
The results also confirm the hypothesis that larger cars are more overpriced than small ones. The coefficient of this variable is highly significant. However, we must reject the idea that the level of standard equipment mediates overpricing. Even though the coefficient is positive (as expected) it is insignificant at conventional levels.
5Concluding remarksThe automobile industry offers a unique framework in which to evaluate product efficiency for two reasons. The first is that, while there is considerable product differentiation, there is plenty of information about the tangible attributes of each car that is commercialized in the marketplace. The second is that real prices adjust quickly to consumer preferences and market information. Every year car manufacturers establish a price policy for each country that includes an official price list. However, car dealers have considerable margin to adjust the prices down in order to meet sales targets. At the end of the year, real (discounted) prices, can be dramatically different from listed prices.
This paper is the first, to our knowledge, that uses discounted prices to evaluate product efficiency. Using discounted prices in the assessment of product efficiency is convenient, since it allows the assumption that the products are comparably competitive. Therefore, if a product is found to be overpriced, given the observable bundle of tangible attributes, we can infer that customers are willing to pay a premium for the intangible attributes associated with the brand. This assumption allows us to identify four brands (Audi, Volvo, Mercedes and Volkswagen) as those that offer more intangible value to their customers. On the other hand, other brands such as Dacia, Fiat, Citroën, Kia, Renault and Seat base their competitiveness on offering a good bundle of tangible attributes at a reasonably low price.
The research has some limitations that should be addressed in future research. First, the sample has been limited to diesel versions, which comprise the largest market share in Spain. However, including gasoline models could vary the assessment of some brands (for instance, Japanese brands such as Honda and Toyota) which may be more focused on gasoline models. Second, due to data restrictions, we have used the same frontier to compare all the models in the sample. A larger sample would allow a finer comparison by dividing the sample into segments by size (small, compact, large) and by market orientation (generalist, premium). This segmentation could add valuable insights about the market and how brands behave within each segment.