This paper explores the question of whether knowledge assets are more developed in services industries than in non-services. The concept of the “knowledge economy” has always gone hand-in-hand with growth in the percentage of the economy represented by services. Two multi-year, multi-industry datasets are used to directly compare the knowledge asset levels in service industry firms against those in non-service industry firms. Service industries do, indeed, reflect higher levels of intellectual capital in recent years, but did not do so a decade ago. Further, there is considerable evidence of changes in specific service and non-service industries over the time period, adding details to the finding that knowledge development is not static but does vary over time and circumstance. These results open up a number of promising research directions that could lead to a better understanding of the nature of these differing circumstances and how better strategic choices might be made regarding investments in knowledge management.
Este artículo analiza la cuestión de si los activos de conocimiento están más desarrollados en las industrias de servicios que en las de no servicios. El concepto de “economía del conocimiento” siempre ha ido de la mano del crecimiento de la economía representada por el sector servicios. Se utilizan dos conjuntos de datos plurianuales y multisectoriales para comparar de manera directa los niveles de activos de conocimientos en las empresas de servicios con las empresas que no son de servicios. Las empresas de servicios sí muestran niveles más altos de capital intelectual durante los últimos años, si bien esto no era así hace una década. Asimismo, existen numerosas pruebas de cambios en industrias concretas de servicios y de no servicios durante el período de tiempo analizado, que incorporan matices al hallazgo de que el desarrollo de conocimiento no es estático, sino que varía en función del tiempo y las circunstancias. Estos resultados abren una serie de prometedoras vías de investigación que podrían dar lugar a un mejor entendimiento de la naturaleza de estas diversas circunstancias y a cómo podría llevarse a cabo una mejor selección estratégica en lo que respecta a las inversiones en gestión del conocimiento.
The growth of interest in the knowledge economy in recent years has, in part, been driven by the increasing dominance of services in many large economies. An implicit assumption exists that services will require more skills and knowledge from employees. While manufacturing does have some similar requirements, many processes can be systematized and improved with tools and equipment, often then lowering the knowledge required from the employee. As a result, many services have been thought to require more expertise and know-how from providers, especially modern services driven by information technology and associated data. If so, evidence should exist of increased knowledge assets in the firms populating contemporary developed economies.
This paper draws on a number of disciplines to assess the relative level of knowledge assets in service and non-service industries. Moreover, by utilizing earlier work, a comparison can also be drawn to how knowledge asset levels, the intellectual capital of firms, have changed over time. By demonstrating the potential of this sort of analysis, a new tool can be provided for managers to evaluate their own intellectual capital levels, including over time, as well as a means to judge relative standing against an appropriate industry metric. The metrics in this paper are generally available public financial records, allowing use of this methodology/tool by anyone who wants to perform this type of analysis.
Further, in understanding the wax and wane of knowledge-intensive industries, and dominant companies within them, an understanding can develop concerning the importance of knowledge in given circumstances. If service-oriented industries do, indeed, seem to require more knowledge assets in order for a resident firm to be competitive, we have an initial piece of evidence of what factors (here, services) contribute to differences in circumstances. If non-services industries require less knowledge assets and, hence, less knowledge management investment, that's also important to know from a strategic management point of view. An understanding is growing within the knowledge management community that the same approach does not work for all firms. Studies such as this start to make the case as to how and why approaches might differ.
Knowledge management (KM) grew out of an increasing understanding that competitive advantage might come from more than basic labor and capital. Schumpeter's (1934) focus on innovation led to study of knowledge combination as a potential source of competitive advantage. Penrose (1959) advocated the importance of knowledge stores in an organization, and Nelson and Winter (1982) took the concept a step further by showing how organizational routines could grow those knowledge stocks.
A natural follow-on from this base was the idea that better management of these intangible knowledge assets could lead to sustainable competitive advantage and superior financial performance (Winter, 1987). Knowledge as a unique competitive resource fell neatly into the developing theory around the resource-based view of the firm (Wernerfelt, 1984). Indeed, an offshoot, the knowledge-based view of the firm grew in the literature (DeCarolis & Deeds, 1999; Grant, 1996; Gupta & Govindarajan, 2000a; Zack, 1999a). With this acceptance of the idea that knowledge in the heads of employees could grant competitive advantage, the logical next question was whether knowledge could be explicitly managed so as to grow the asset and achieve such advantage.
In better managing knowledge assets, the just-noted distinction between stocks and flows has been important in the literature (Dierickx & Cool, 1989). Knowledge management as a discipline focuses on growing the stocks deliberately rather than letting it happen by serendipity (Teece, 1998). In order to do that effectively, it helps to have a good understanding of the level of the stocks and that tends to happen through measurement. So intellectual capital (IC) as a discipline has centered on definition, categorization, and metrics (Davenport & Prusak, 1997; Edvinsson & Malone, 1997; Stewart, 1997). As this paper will detail, a variety of methods have been developed to measure IC, knowledge assets, including such well-known techniques as the Balanced Scorecard (Kaplan & Norton, 1992).
In developing these metrics, IC scholars and practitioners delved more deeply into the nature of the knowledge assets, generally defining intellectual capital as being a mix of human capital, structural capital, and relational capital (Bontis, 1999; Edvinsson & Sullivan, 1996). Human capital has to do with individual, usually job-specific know-how. Structural capital includes more established, organization-wide knowledge such as corporate culture, organizational structure, and related matters. Relational capital attaches to knowledge about relations with external entities, including but not limited to customers. Competitive capital (Rothberg & Erickson, 2002), knowledge concerning competitors, is sometimes brought into the discussion as well.
Knowledge management, meanwhile, has focused on means to increase these stocks. In doing so, scholars and practitioners looked to better understand knowledge itself, circumstances that make it easier or harder to grow, and appropriate techniques for the circumstances. Probably the most important distinction is between tacit and explicit knowledge (Polanyi, 1967), developed in a KM context by Nonaka and Takeuchi (1995), who also provided the SECI or “ba” model to guide knowledge exchange according to type (e.g. tacit to tacit). Tacit knowledge is more personal, hard to express, and thus often hard to transfer between individuals. Explicit knowledge is codifiable and easier to capture and transfer through IT systems and other such means. Over the years, techniques have been adopted to fit the type of knowledge, so that we have specific tools for tacit exchanges, such as communities of practice and storytelling (Boisot, 1995; Choi & Lee, 2003; Schulz & Jobe, 2001), as well as for explicit exchanges, which are more systems-oriented, based on IT and a knowledge market structure (Matson, Patiath, & Shavers, 2003; Thomas, Kellogg, & Erickson, 2001).
Further extensions include differences in knowledge beyond tacit/explicit, including complexity and specificity (Kogut & Zander, 1992; Zander and Kogut, 1995), as well as differences in organizational circumstances such as social capital, social networks, and absorptive capacity (Cohen & Levinthal, 1990; Liebowitz, 2005; Nahapiet & Ghoshal, 1998). Much of the work done has been firm-specific or case studies, seeking out examples of best practice for managing knowledge (Davenport, DeLong, & Beers, 1998; Gupta & Govindarajan, 2000b; Hansen, Nohria, & Tierney, 1999; McEvily & Chakravarthy, 2002; Zack, 1999b). Work in intellectual capital has also been largely based on the study of single firms or small groups of firms (e.g. Mouritsen, Larsen, & Bukh, 2002).
As a result, the IC and KM disciplines have developed a fairly good understanding of how to assess knowledge assets and how to attempt to manage them effectively (successful implementation, of course, can still be a challenge). What can still be a puzzle are cross-firm or cross-industry comparisons that can help firms evaluate their knowledge management efforts versus competitors or against unrelated companies. Scholars also lack an understanding of how the nature of knowledge and effectiveness of management varies across industries, where different circumstances may call for different KM priorities.
2Strategy and knowledge assetsThese types of questions become even more important when extending the discussion. Initially, what managers consider to be a valuable knowledge asset has expanded in recent years. Intellectual property has always been considered an asset, and, as discussed, intellectual capital and softer knowledge assets have been added to the list in recent decades. More recently, cloud computing, big data, business analytics and other such concepts have brought raw data and information into the mix as well. KM has generally considered data and information to be potential precursors to valuable knowledge, not items of value in and of themselves (Zack, 1999a; Zander and Kogut, 1995), but these recent trends may be changing that (Liebowitz, 2013). If so, it may be more appropriate for a firm to include data mining capabilities in addition to or instead of a KM system.
Similarly, the cost/benefit of investment in KM systems has been a question for at least the past fifteen years after some of the initial installations of big, expensive IT structures were disappointing. That consideration, along with concerns that spreading knowledge too widely might lead to greater vulnerability to competitive intelligence or other incursions by competitors, suggested that a more measured approach to sharing proprietary knowledge assets might be more prudent (Erickson & Rothberg, 2012; Liebeskind, 1996; Rothberg & Erickson, 2005).
The different circumstances surrounding knowledge assets, combined with these additional complications, blend together to create a more complex strategic decision than blindly recommending ever more spending on KM systems. The size and nature of the KM installation should be questioned, with firms adopting a strategy fitting their circumstances. Sometimes that will be greater codification and distribution of knowledge assets across the organization and its greater network. Sometimes, that will be limited tacit exploitation of the assets. Sometimes, firms might choose not to aggressively develop knowledge at all, preferring to keep it more secret and protectable.
What might dictate such strategies? Many of the differing circumstances noted earlier, including the nature of the knowledge, the capabilities of the firm, the potential of big data for that firm or industry, and perhaps additional industry- (life cycle) or firm- (value chain location of valuable knowledge) specific variables (Erickson & Rothberg, 2012). Because most studies in this field have been limited to single firms or small samples, insight as to how or why circumstances may differ or what appropriate strategic responses might be has been.
One big difference that may matter is type of industry. And one of the major differences that can exist between industries is the distinction between goods and services. While pure good and pure service offerings can be somewhat blurred in reality, company financial reports still tend to classify their major business as a good or service. As noted at the beginning of this piece, the general inclination is to assume that service provision might have more knowledge content, but that has yet to be firmly established.
Consequently, this study begins to address these questions by directly comparing knowledge asset holdings in service industries against those in non-service industries. Further, it looks at changes in these holdings over time. Both should give some insight into how circumstances might vary for managing knowledge (service vs. non-service) and what a longitudinal view might add to the discussion. If a circumstance such as type of industry leads to different apparent circumstances for managing knowledge, then others may as well. As such, this type of result could reinforce the case for managing knowledge assets differently under different conditions.
3Conceptual frameworkThis study draws from the results of previous work measuring knowledge asset levels in different industries (Erickson & Rothberg, 2009). That work has since been updated with a larger, more comprehensive database collected a decade later. The results allow a number of direct and interesting comparisons.
Although most KM and IC scholarship has focused more on individual firms, recognized metrics do exist for doing more broad-based comparisons across multiple firms. Sveiby (2010) lists over forty published techniques for measuring intellectual capital distinguishing between those that take a bottom-up approach within a given firm vs. those that directly compare across numerous firms, often using readily available financial statements. The former group includes well-known metrics such as the Balanced Scorecard (Kaplan & Norton, 1992) mentioned earlier and the original Skandia Navigator (Edvinsson & Malone, 1997). These and similar techniques such as Pulic's VAIC have been used to evaluate the intellectual capital of organizations and try to assess its impact on financial returns (per the knowledge-based view of the firm discussed earlier) (Chen, Chang & Hwang 2005; Firer & Williams, 2003; Pulic, 2004; Tan, Plowman, & Hancock, 1997). Even more micro approaches have assessed the impact of specific intellectual capital components (human, structural, relational) on financial performance (Lev & Radhakrishnan, 2003; Marr & Schiuma, 2001).
All of these studies have been valuable and provided deep insights into the nature of knowledge assets in firms and their impact on performance. But the within-firm data gathering requirements make them impractical for extensive cross-firm studies. Indeed, few organizations or outside researchers would have access to this depth of information beyond their own firm. So in doing broad-based studies, other techniques are appropriate. Here, a variation on Tobin's q (Tobin & Brainard, 1977) is employed. Tobin's q has been used for decades as a basic assessment of intangible assets, a good proxy for the knowledge contained within the firm. The metric is expressed as market capitalization to replacement value of assets. The difference (value less tangible assets) is defined as the intangible asset value present in the firm. As replacement value can be hard to obtain, book value is a commonly used variation. The metric can also be applied as a difference or as a ratio. This study uses the ratio approach as it is more directly comparable across firms and removes company size as a potential biasing factor. As a result, a direct comparison can be made across a large number of firms, sorted by industry, in terms of their level of KM development (Erickson & Rothberg, 2009). Given the emphasis of KM scholars on case studies and analyses of individual firms, this type of research has not been done a lot, with the few exceptions already noted, but the potential for giving practicing managers and academics insights into how and why intangibles matter is tremendous.
The two databases are comparable but not exactly alike. Both are populations rather than samples, and so include all observations fitting their respective definitions. The earlier database includes 517 large firms, the Fortune 500 plus a handful of additional companies with recognizable competitive intelligence operations. Financial results were obtained from Compustat for the years 1993–1996. These were arranged by SIC code into industries with data averaged across the four-year period.
The second database, also a full population rather than a sample, included over 2000 firms listed on North American exchanges, with a screen of annual revenue above $1 billion for all years between 2005 and 2009. Every firm meeting these criteria in a given year was included. Data were obtained from I/B/E/S. The data were again arranged by SIC code and averaged across the time period and by industry. A couple of classifications of firm by SIC code (mainly in software) changed over the two measurements, but the results were otherwise comparable across the two databases.
4Results and discussionThis study specifically compares the level of knowledge assets apparent in service industries with those in non-service industries. Further, with two databases separated by over a decade, some perspective on knowledge levels over time is also presented. As will be discussed, much of this is exploratory research at this stage, but some clear conclusions can be drawn from the analysis. In particular, we can look at:Proposition 1 Knowledge asset development in service industries is no different from that in non-service industries (1990s period). Knowledge asset development in service industries is no different from that in non-service industries (2000s period).
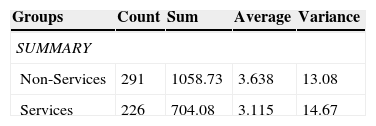
An ANOVA was conducted for each dataset, splitting the industries according to the SIC distinctions between non-service (categories 1–4) and service (categories 5 and higher) providers. The mean Tobin's q (market capitalization to asset value) was the parameter tested, with sample sizes reported in the following tables (note that means were already calculated for the 517 firms in the first sample; the means reported in the second include individual annual values for roughly 2000 firms). As noted in the previous discussion, these metrics directly compare the ratio of organizational value to tangible assets, leaving the level of intangible assets (akin to knowledge assets) present in the resident firms. Consequently, we have an assessment of the knowledge implicit in each group of organizations. Results are presented in Tables 1 and 2.
ANOVA Results: Tobin's q (1993–1996).
| Groups | Count | Sum | Average | Variance |
|---|---|---|---|---|
| SUMMARY | ||||
| Non-Services | 291 | 1058.73 | 3.638 | 13.08 |
| Services | 226 | 704.08 | 3.115 | 14.67 |
| Source of variation | SS | df | MS | F | P-value | F crit |
|---|---|---|---|---|---|---|
| ANOVA | ||||||
| Between Groups | 34.77 | 1 | 34.77 | 2.525 | 0.113 | 3.859 |
| Within Groups | 7091.81 | 515 | 13.77 | |||
| Total | 7126.59 | 516 | ||||
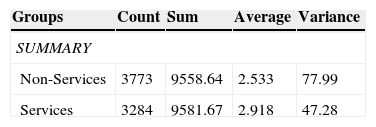
ANOVA Results: Tobin's q (2005–2009).
| Groups | Count | Sum | Average | Variance |
|---|---|---|---|---|
| SUMMARY | ||||
| Non-Services | 3773 | 9558.64 | 2.533 | 77.99 |
| Services | 3284 | 9581.67 | 2.918 | 47.28 |
| Source of variation | SS | df | MS | F | P-value | F crit |
|---|---|---|---|---|---|---|
| ANOVA | ||||||
| Between groups | 259.24 | 1 | 259.24 | 4.070 | 0.0437 | 3.843 |
| Within groups | 449393.5 | 7055 | 63.70 | |||
| Total | 449652.7 | 7056 | ||||
Both sets of results show a difference between services and non-services, though not in the same direction. In the earlier dataset, non-services had the higher ratio, indicating more knowledge assets, 3.638 to 3.115. The difference just misses being significant at the 90% level with a p-value of 0.113. By the time of the later dataset, services now showed the higher ratio, 2.918 to 2.533 and, because of the much larger sample size, this difference is significant at the 95% level with a p-value of 0.0437. Interestingly, the ratio for both services and non-services declined between measures. Services stayed roughly the same however (3.115 falling to 2.918), while non-services declined precipitously from 3.638 to 2.533. Deeper investigation would be needed to establish precisely why (financial conditions, offshoring, changes in productivity, growth of the internet) but the differences are quite evident.
In terms of the formal propositions, the first is partially supported as, again, a difference is apparent and is almost significant at an acceptable level. In the 1990s, non-services industries showed potentially higher levels of intangible knowledge assets than did services industries. By the 2000s, the second proposition is fully supported, with an apparent and significant difference. Now, however, the direction is in favor of services, with a considerably higher level of knowledge assets.
One could also suggest that the relationship between services and non-services, then, changed significantly over the decade. There is some evidence of this thought, but there is also some danger in drawing broad conclusions based on these results. Over the intervening decade, the tech boom rose and died, the financial crisis occurred (in the midst of one of the datasets), and various international trends (offshoring, rise of the BRICs, and the increasing impact of China) also occurred. As a result, isolating the trends and impacts related to knowledge assets at such a broad level is quite difficult. More precise comparisons such as individual industries or the relative standing of specific firms within an industry (where most external factors would affect all firms in an industry similarly) would be better uses of the datasets.
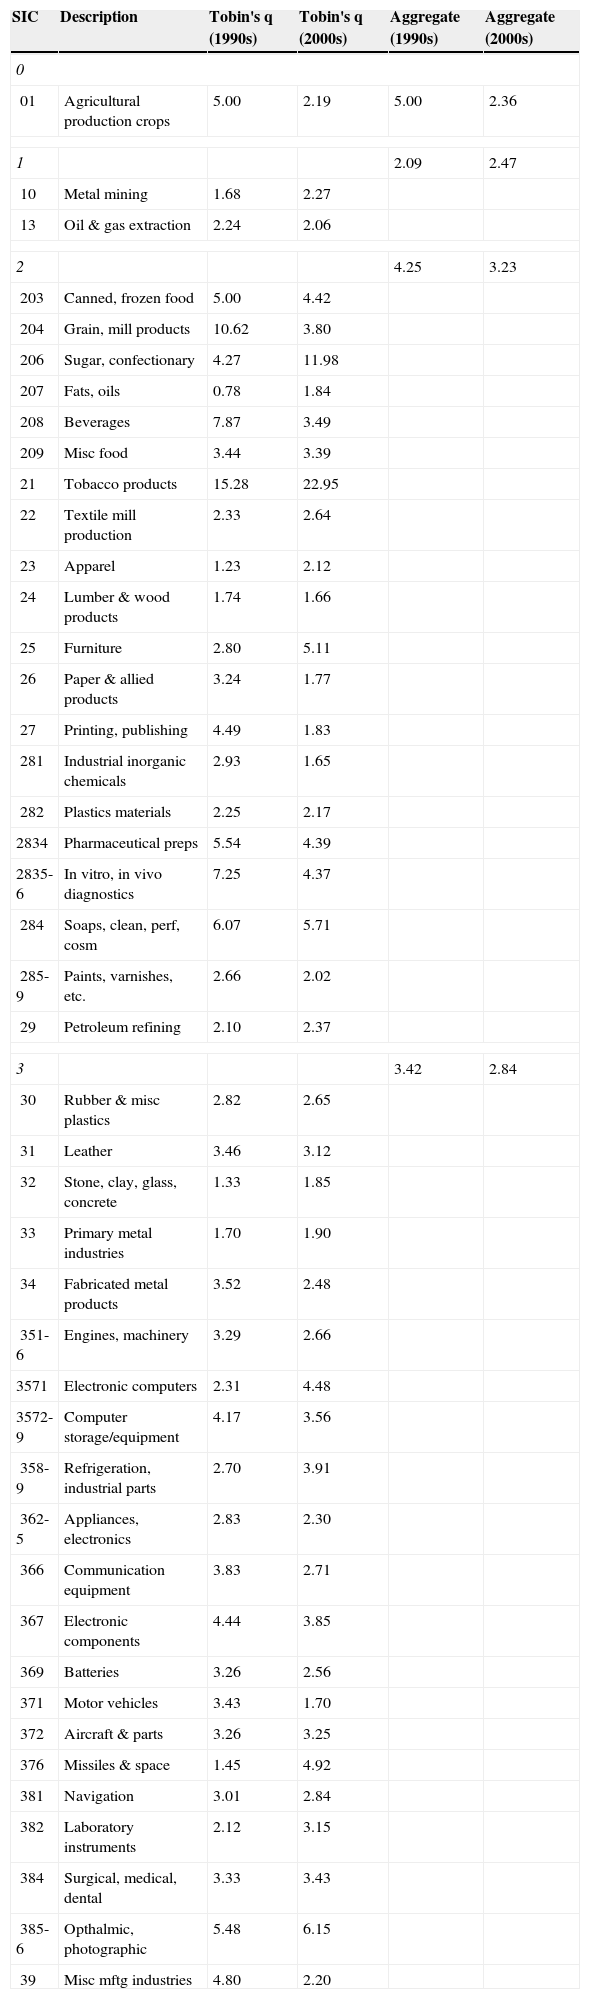
Thus, a further breakdown of the data is presented in Tables 3 and 4, exploring the question of knowledge asset variation by industry, still within the service and non-service groupings. In these tables, firms and their results are arranged into SIC categories at the 1, 2, 3, and 4-digit levels, depending on the concentration of the industry and number of representative firms. Note that the aggregates at the 1-digit level contain more firms and industries than are listed beside them in the table, as industries without enough representative firms (or that were not included in the earlier database) are not presented separately.
Intellectual capital: non-service industries.
| SIC | Description | Tobin's q (1990s) | Tobin's q (2000s) | Aggregate (1990s) | Aggregate (2000s) |
|---|---|---|---|---|---|
| 0 | |||||
| 01 | Agricultural production crops | 5.00 | 2.19 | 5.00 | 2.36 |
| 1 | 2.09 | 2.47 | |||
| 10 | Metal mining | 1.68 | 2.27 | ||
| 13 | Oil & gas extraction | 2.24 | 2.06 | ||
| 2 | 4.25 | 3.23 | |||
| 203 | Canned, frozen food | 5.00 | 4.42 | ||
| 204 | Grain, mill products | 10.62 | 3.80 | ||
| 206 | Sugar, confectionary | 4.27 | 11.98 | ||
| 207 | Fats, oils | 0.78 | 1.84 | ||
| 208 | Beverages | 7.87 | 3.49 | ||
| 209 | Misc food | 3.44 | 3.39 | ||
| 21 | Tobacco products | 15.28 | 22.95 | ||
| 22 | Textile mill production | 2.33 | 2.64 | ||
| 23 | Apparel | 1.23 | 2.12 | ||
| 24 | Lumber & wood products | 1.74 | 1.66 | ||
| 25 | Furniture | 2.80 | 5.11 | ||
| 26 | Paper & allied products | 3.24 | 1.77 | ||
| 27 | Printing, publishing | 4.49 | 1.83 | ||
| 281 | Industrial inorganic chemicals | 2.93 | 1.65 | ||
| 282 | Plastics materials | 2.25 | 2.17 | ||
| 2834 | Pharmaceutical preps | 5.54 | 4.39 | ||
| 2835-6 | In vitro, in vivo diagnostics | 7.25 | 4.37 | ||
| 284 | Soaps, clean, perf, cosm | 6.07 | 5.71 | ||
| 285-9 | Paints, varnishes, etc. | 2.66 | 2.02 | ||
| 29 | Petroleum refining | 2.10 | 2.37 | ||
| 3 | 3.42 | 2.84 | |||
| 30 | Rubber & misc plastics | 2.82 | 2.65 | ||
| 31 | Leather | 3.46 | 3.12 | ||
| 32 | Stone, clay, glass, concrete | 1.33 | 1.85 | ||
| 33 | Primary metal industries | 1.70 | 1.90 | ||
| 34 | Fabricated metal products | 3.52 | 2.48 | ||
| 351-6 | Engines, machinery | 3.29 | 2.66 | ||
| 3571 | Electronic computers | 2.31 | 4.48 | ||
| 3572-9 | Computer storage/equipment | 4.17 | 3.56 | ||
| 358-9 | Refrigeration, industrial parts | 2.70 | 3.91 | ||
| 362-5 | Appliances, electronics | 2.83 | 2.30 | ||
| 366 | Communication equipment | 3.83 | 2.71 | ||
| 367 | Electronic components | 4.44 | 3.85 | ||
| 369 | Batteries | 3.26 | 2.56 | ||
| 371 | Motor vehicles | 3.43 | 1.70 | ||
| 372 | Aircraft & parts | 3.26 | 3.25 | ||
| 376 | Missiles & space | 1.45 | 4.92 | ||
| 381 | Navigation | 3.01 | 2.84 | ||
| 382 | Laboratory instruments | 2.12 | 3.15 | ||
| 384 | Surgical, medical, dental | 3.33 | 3.43 | ||
| 385-6 | Opthalmic, photographic | 5.48 | 6.15 | ||
| 39 | Misc mftg industries | 4.80 | 2.20 | ||
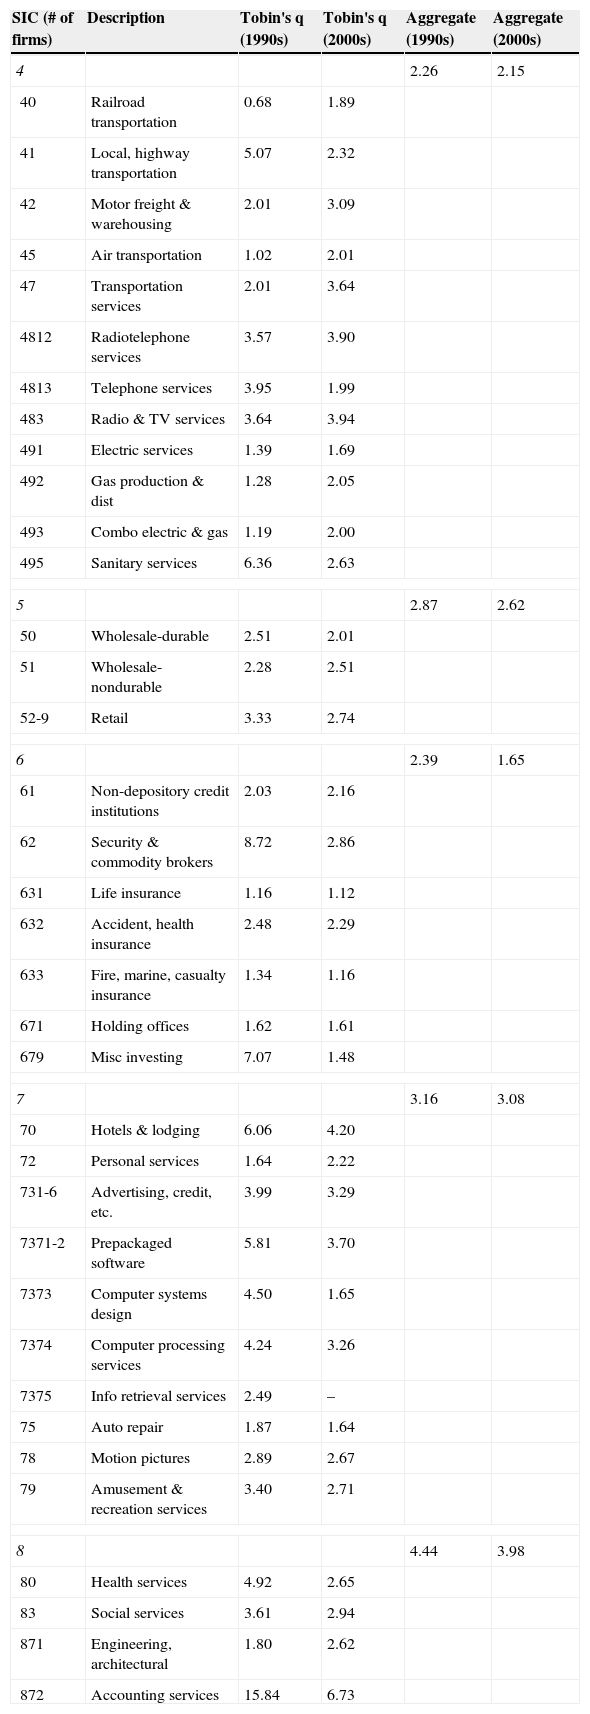
Intellectual capital: service industries.
| SIC (# of firms) | Description | Tobin's q (1990s) | Tobin's q (2000s) | Aggregate (1990s) | Aggregate (2000s) |
|---|---|---|---|---|---|
| 4 | 2.26 | 2.15 | |||
| 40 | Railroad transportation | 0.68 | 1.89 | ||
| 41 | Local, highway transportation | 5.07 | 2.32 | ||
| 42 | Motor freight & warehousing | 2.01 | 3.09 | ||
| 45 | Air transportation | 1.02 | 2.01 | ||
| 47 | Transportation services | 2.01 | 3.64 | ||
| 4812 | Radiotelephone services | 3.57 | 3.90 | ||
| 4813 | Telephone services | 3.95 | 1.99 | ||
| 483 | Radio & TV services | 3.64 | 3.94 | ||
| 491 | Electric services | 1.39 | 1.69 | ||
| 492 | Gas production & dist | 1.28 | 2.05 | ||
| 493 | Combo electric & gas | 1.19 | 2.00 | ||
| 495 | Sanitary services | 6.36 | 2.63 | ||
| 5 | 2.87 | 2.62 | |||
| 50 | Wholesale-durable | 2.51 | 2.01 | ||
| 51 | Wholesale-nondurable | 2.28 | 2.51 | ||
| 52-9 | Retail | 3.33 | 2.74 | ||
| 6 | 2.39 | 1.65 | |||
| 61 | Non-depository credit institutions | 2.03 | 2.16 | ||
| 62 | Security & commodity brokers | 8.72 | 2.86 | ||
| 631 | Life insurance | 1.16 | 1.12 | ||
| 632 | Accident, health insurance | 2.48 | 2.29 | ||
| 633 | Fire, marine, casualty insurance | 1.34 | 1.16 | ||
| 671 | Holding offices | 1.62 | 1.61 | ||
| 679 | Misc investing | 7.07 | 1.48 | ||
| 7 | 3.16 | 3.08 | |||
| 70 | Hotels & lodging | 6.06 | 4.20 | ||
| 72 | Personal services | 1.64 | 2.22 | ||
| 731-6 | Advertising, credit, etc. | 3.99 | 3.29 | ||
| 7371-2 | Prepackaged software | 5.81 | 3.70 | ||
| 7373 | Computer systems design | 4.50 | 1.65 | ||
| 7374 | Computer processing services | 4.24 | 3.26 | ||
| 7375 | Info retrieval services | 2.49 | – | ||
| 75 | Auto repair | 1.87 | 1.64 | ||
| 78 | Motion pictures | 2.89 | 2.67 | ||
| 79 | Amusement & recreation services | 3.40 | 2.71 | ||
| 8 | 4.44 | 3.98 | |||
| 80 | Health services | 4.92 | 2.65 | ||
| 83 | Social services | 3.61 | 2.94 | ||
| 871 | Engineering, architectural | 1.80 | 2.62 | ||
| 872 | Accounting services | 15.84 | 6.73 | ||
What do these more specific results show? Initially, the aggregate ratios given in the far right columns reinforce the finding that knowledge asset levels have declined for many industries. They also reinforce the apparent slight declines among service industries and more substantial declines in non-services. But that finding is further illuminated by the much larger decline in financial services — the later dataset did not show a huge difference in 2009 financial results across the board (after the 2008 crash) but the value of financial institutions certainly showed a shift. Those related to investment illustrate profound declines. The perceived value of knowledge assets has the potential to change, and change abruptly.
The more specific results also show some variation in the individual industries. Regardless of the time of the dataset, industries with an expectation of high knowledge asset levels (pharmaceuticals, various computer industries, branded industries such as beverages and soaps), have high ratios. Industries with an expectation of lower knowledge asset levels (regulated services such as utilities and transportation, natural resource processing, insurance), have low ratios. So we can take some confidence in the reliability of the results.
Some of the variation in the later dataset is muted, surely in part because of the larger sample size, but there are still considerable differences in the highs and lows of the Tobin's q ratios. Distinctly different levels of knowledge asset development are apparent between industries. This is a potentially significant observation as it does imply different circumstances which should probably be approached with different strategies. In order to keep up with the rest of the industry in a field like 385-6 Opthalmic, Photographic (5.48, 6.15), a firm would need to adopt aggressive knowledge development strategies and initiatives. Failure to do so could leave it at a considerable marketplace disadvantage in an industry where knowledge assets appear to be quite important. On the other hand, in a field like 24 Lumber and Wood Products (1.74, 1.66), where the ratios are quite low relative to the full dataset, knowledge development is likely less of a priority. Indeed, heavy investment in KM systems, where the top end of industry results is relatively low could even be a waste of resources. There may simply be not much new in this industry and a massive KM installation could easily be overkill.
Even with such an understanding, however, there is also evidence of the importance of staying on top of changing industry conditions. A number of examples exist, such as category 62 Security and Commodity Brokers (8.72, 2.56) or 376 Missiles and Space (1.45, 4.92). The importance of knowledge development, of intangible knowledge assets, can apparently change quickly and abruptly.
5ConclusionsThis paper presents a substantial amount of data in order to shed some light on fairly straightforward questions. Does the increasing prominence of services in the economy represent a similarly increasing prominence of knowledge assets (i.e. the “knowledge economy”)? If so, is there evidence of a greater need for firms to develop knowledge in service industries? And is there evidence these relationships have changed over time?
Based on two datasets, separated by a ten-year timespan, there does appear to be a difference between the knowledge asset levels in service industries. But while services lagged behind non-services in the mid-nineties in knowledge development, services industries now show evidence of significantly higher amounts of knowledge assets. The pattern has changed considerably over time. There is also evidence of the reason behind this, i.e. a decline in knowledge asset development in the non-service industries as opposed to much change in the level in services. While these results could be formally tested as hypotheses, the different time periods, operating environments, and the variety of important external factors make it hard to firmly establish comparability. Consequently, these results are treated as exploratory. But they do represent an important first step in an attempt to compare the intellectual capital or knowledge asset development across firms, across industries, and across time.
Further research would look more specifically at the results, especially how given industries change (or do not change) over time. Industry-level studies would mute many of the potentially biasing operating environments and external factors, as these would typically affect all firms in an industry similarly. This paper does offer some evidence of changes in the level of knowledge assets in an industry, including some with apparent explanations readily at hand (financial services). More in-depth work could also look at the changes in firm rankings by intellectual capital, including some combinations of knowledge asset development levels paired with performance results (financial, market share, etc.).
All of this could go toward a more complete understanding of how knowledge management systems actually work in organizations. When are they successful? When not? With this type of work we can start to explore the changes in circumstances and results across industries and over time. A broader topic is whether knowledge management investment is strategic, whether the level of commitment might vary according to internal and external variables such as firm capabilities, industry, and national/international external variables. The research presented here starts to explore such questions, particularly whether an industry is services-oriented or not, and how such a phenomenon matters in relation to the mandate for knowledge asset development. The initial results suggest that it may matter a lot.