


In a remarkably short time, economic globalisation has changed the world's economic order, bringing new challenges and opportunities to SMEs. These processes pushed the need to measure innovation capability, which has become a crucial issue for today's economic and political decision makers. Companies cannot compete in this new environment unless they become more innovative and respond more effectively to consumers’ needs and preferences – as mentioned in the EU's innovation strategy. Decision makers cannot make accurate and efficient decisions without knowing the capability for innovation of companies in a sector or a region. This need is forcing economists to develop an integrated, unified and complete method of measuring, approximating and even forecasting the innovation performance not only on a macro but also a micro level.
In this recent article a critical analysis of the literature on innovation potential approximation and prediction is given, showing their weaknesses and a possible alternative that eliminates the limitations and disadvantages of classical measuring and predictive methods.
En un plazo increíblemente corto, la globalización económica ha cambiado el orden de la economía, creando nuevos retos y oportunidades a las pequeñas y medianas empresas. Por ello se esta dando la necesidad de crear maneras de medir capacidad de innovación que resulta fundamental para quien debe tomar decisiones politico-economicas. Las compañías no pueden competir en este nuevo entorno a no ser que sean mas innovadoras y respondan de manera más eficiente a las necesidades y preferencias del consumidor-como de hecho se ha mencionado en la Estrategia de Innovación de la UE. Las decisiones no pueden ser tomadas de manera eficiente y adecuada sin el conocimiento de la capacidad de innovación de compañías de un determinada región y/o sector. Esta necesidad está forzando a los economistas a desarrollar un método completo integrado y unificador de medir, aproximar e incluso predecir el rendimiento innovativo tanto a micro como a macro niveles.
En este reciente articulo se ha hecho un análisis critico de la literatura que trata sobre aproximaciones y/o predicciones del potencial innovador, mostrando sus defectos y posibles alternativas que eliminarían las limitaciones y desventajas de las mediciones clásicas y métodos predictivos.
In any innovation research the positivist paradigm should play the main role in specific coherent practices concerning the standards of academic pragmatics (laws, theories, adaptations, tools of research, and models). This can be justified on the one hand by the characteristics of the topic and on the other hand the predominance of positivist approach literature over the normative approaches.
The positivist approximation can be decolonized from any ethical considerations or normative verdicts (Friedman, 1953): according to Keynes (1891) it deals with what exists and not what should exist. This approach involves generalizations, which make it possible to describe correctly the effects of the economic changes with such performance that depends exclusively on the accuracy and scope of prediction (observation) and on its consistency with fact – creating an objective system as they occur in natural sciences (Friedman, 1953). According to the positivists a theory which is unable to describe reality with numbers, is inappropriate and not well reasoned (McCloskey, 1986). The goal of science for the positivist researchers is to reveal the scientific regularities whereby the phenomena under investigation will be explicable and at the same time predictable (Alvesson, 2000). The goal of research is to reveal the objective verity amidst the effects of the researcher's personality, the chosen research method and the influential factors (McCloskey, 1986). Hence the analytic confines of the research are predefined and universal, the analytic model is class-based (problem granulation), and the process of the research is convergent, logically traceable and objective. According to Friedman's theory (1953) the positivist science is just as objective (or transposable) as any other natural science. Nevertheless the fact that social sciences deal with connections between people and organizations makes the researcher a part of the research – in a more direct way than in natural sciences and thus, makes it significantly difficult to reach objectivity.
Accordingly there are two potential alternatives. One of them is loosening the objectivity postulations set up by positivism. This way can be reasonable to consider how much is the greatest permissible subjectivity which is still able to grant the objectivity of the natural scientific positivist approach.
The other way is to prepare the applied methodology to cope with handling “fuzzy”, subjective, often inaccurate and ‘noisy’ dataset by objective, solid mathematical laws.
Researchers must choose from these two possible ways as Friedman's thesis (1953) says that every economic deduction necessarily – even genuinely or implied – is based on a positivist prediction telling us the consequences of doing this instead of that: providing information about the consequences of a given series of actions and not determining normative verdicts.
In the course of my research the second of these is chosen: in an attempt to apply such modelling methodology to economics which, based on the positivism's logical foundations, is able to consider also subjective and inert factors beside the expected objectivity (without yielding it). These factors are either forced to be precise (along with a high bias) by the classic methodologies or easing the positivist objectivism.
The paper intends to show a complete model building and testing procedure for innovation potential estimation to decide whether classical ways of measurements adequate or modern heuristic, artificial intelligence-based methods give better estimations. In order to answer this question the modelling issues of classical methods are summarized and a description of a possible robust model is given before a certain model is specified.
1.1Modelling preferencesNatural sciences as positivist sciences contain conditionally approved generalizations related to social/economical phenomena. With these generalizations the effects of variations, which occur in the case, can be predicted in the form of maps. The extension of generalization, the accuracy of approximations, the confidence level of them and the enhancement of the predictions’ accuracy are discouraged not only by the boundaries of the researcher's capabilities, but particular circumstances occurring in social sciences, especially in economics – although this is not their obligate idiosyncrasy (Friedman, 1953). In economics inevitably we rather rely on non-controlled experiences than on controlled experiments; hence it is exceptionally hard to provide clear and unambiguous evidence to verify hypothesizes correctly.
The justness of a hypothesis can only be tested with the accuracy of its inferences and predictions. This is what disturbs our methodological principles: causing difficulties in testing hypothesizes and verifying them. Ergo, the social scientist, has to be fully aware of his methodological principles, more than any others and must strictly insist to their restrictive case maps, not allowing the rejection of one or more of them. In this manner a social scientist has to adapt to those few deductible conclusions.
Considering the issues above, an awareness of restrictive assumptions is elementary during the phase when we are building our model. It is also indispensable to have the wide knowledge about the techniques of testing the restrictive assumptions and a familiarity with the standard system of requirements for social science models.
The essential requirements of modelling in social sciences – just like in mathematics – are accuracy, significance and strictness (Retter, 2006). The consistency originates in that tract of the science philosophy of mathematics in the 19th century, which is called the “Revolution of strictness”. The naming originates itself from Imre Lakatos, Hungarian mathematician and science philosopher (positive heuristics, the critique of naive falsificationism). Since that time we know the very precise and exact standardization which was taken over into the classic (hard) modelling of social science. Herewith arithmetization and standardization of modelling have been started. By arithmetization an attempt was made to reconduct the exclusive terms of analysis and the theory of real numbers to the certain conception of natural numbers. Standardization meant the method of strict verification analysis.
The second group of requirements was conceived by Lotfi Zadeh – professor of mathematics at Berkeley University – in his “Fuzzy systems” theory. The first paradox states that increasing the complexity of a model (system) causes the decrease of the ability to make precise and significant conclusions. Moreover at a margin we realize that exactitude (arithmetical formalism) and significance became two criteria of the system, which are respectively bearing out each other. The stability/plasticity dilemma means also a similar problem: how could we build such a model which is plastic enough to bear with its fast changing environment but at the same time it is also stable enough to reserve the previously acquired knowledge (coherence) (Retter, 2006).
A similar contradiction turns up in case of interpretability – exactitude and interpretability – significance concept pairs.
1.2Restrictive requirementsBeside the requirements above the researcher must face several restrictive requirements during the procedure of model building. The classic modelling techniques viz. often are not prepared for such problems like for instance issued by the extreme complexity of the target function: what should be done when we cannot formulate the function which is analysed for optimum (or any other known point). Perhaps if the high statistical error couples with low significance level or we can draw only approximate inference. Stochastic mindset causes a lot of problems and restrictions in social sciences, as the researched phenomenon is hard to be expressed by clearly observed variables; the determination of measurement tool and method can also lead to confusions; some certain issues on error of measurement; and the treatment of the role of the role of outliers. Rappai (2010) also argues these issues on modelling. In the perspective of the current research, the following topics can be identified.
A very common restrictive requirement is subjective system information, as applying quantitative criteria is a common assumption of classic system modelling techniques. However in social science these objective quantitative criteria are often not given to the researcher. In these cases the established custom is to transform the qualitative criteria to quantitative but does this ensure objectivity? Are these transformations effective? The fact social science's – especially economics’ – system information are subjective is widely admitted since all of our experiences are inevitably subjective. There are no exceptions to this rule (Babbie, 2001). Accordingly it can be questioned whether a scientist could be such objective as the positivist ideal assumes.
Now if our system information is subjective and the applied techniques require objectivity – just like the indomitable desire for positivism – then we must force the subjective information to be precise or we must chose a methodology which is able to handle system information based on a subjective value judgement.
The cogency of congruity to the requirements of linearity is very strong since in most of the cases social scientists use linear regression in modelling. Most economic relationships are nonlinear either by their variables or by their parameters. The researcher must transform the nonlinear reality into a linear model – often with high bias – since the conditions of predicting the parameters of such non-linear models are almost insatiable. In these cases the variables must be redefined.
Homoscedasticity must apply to each probability variable of the regression model, so every variable must have the same finite σ2 variance. Ergo each probability distribution has the same standard deviation with the target variable, irrespective of explanatory variables. Therefore the covariance matrix of the deviation variables is a scalar matrix, which has the same σ2 values in the main diagonal. For testing homoscedasticity the Goldfeld-Quandt, the Breusch-Pagan and the White tests are appropriate.
The explanatory variables of the model must be independent of each other: none of them can be reproduced by the linear combination of others. It is equitable how difficult it is to find an example of such a system in reality organized in pursuance of stochastic principles where belonging to each of the criteria does not necessarily exclude the chance of belonging to another. It has an effect on that but besides there are other criteria which have effect on affiliation. In addition certainly there are lots of restrictive criteria the researcher must count on and which are well detailed in the most statistics related books.
2Literature reviewBy the 21st century the determinant and differentiation issues of economic competitiveness and position gaining have shifted from simple indexes based on added value into more complex indicators, such as market access variables and quantifying product/service add-news and marketable ideas. International practice shows that only those operators can succeed which are organized into networks and consciously and constantly aim to achieve the originalities.
Methodologies of measuring innovation potential and innovation performance can involve two criteria. These dimensions refer on the one hand to the complexity of variables and complexity if their measurement and interpretation is used in the inference process. On the other hand there is the dimension of the complexity of the inference model: how can the inference process be described by simple linear functions or by more complex nonlinear mapping.
According to these statements I made out the following methodologies:
- 1.
Analyzing of simple index numbers
- 2.
Horizontal or vertical analysis based on partition coefficients
- 3.
Calculation based on correlation methods (regression models), standard deviation analysis
- 4.
More complex regression-based methods (manual models, path models), canonical correlation, latent variable models (principal component methods, multidimensional scaling, correspondence models)
- 5.
Artificial intelligence-based models such as neural networks, fuzzy systems.
The choice between methods has a lot of criteria as summarized in the figure above. The research base position in which innovation potential should be measured and the type of innovation activities to be measured are indifferent variables of the selection process. However the innovation can be minor adjustments from existing or underdevelopment products to the development of new products detection with new markets or suppliers, and even organization rationalization. The process can vary from a new, innovative one to obtain some practical knowledge, improving real life problems in terms of the innovation process and possibility of creating real innovations to testing previously non-existing procedures or introducing experimental tests procedures for analysing the innovation perspective. Any kind of innovation1 can be measured – depending on the variable set but independently from the method. The first differentiation factor is the complexity of the innovation process that should be measured. Its partly determined by the previously mentioned two factors but we are unable to make the right decision only relying on them. The first group has those processes that can be easily described by simple index numbers and can be easily expressed by numerical indicators.
The other situation is when it is harder to describe the innovation process with a bunch of indexes, or the process is so complex and stochastic, or the nature of the data makes it difficult (even awkward) to transform them into numerical variables, functions.2
The level at which innovation potential will be measured also should be considered: it can be measured either on micro level or on macro (meso) level such as for a geographical/economic region, area or location. The interdependencies of innovation also have an affect on the method we would like to use: it should be decided if the innovation could be separated from the boarder innovations or not and how typical the interdependence is between them. The nature and the possible level of abstraction of variables involved in the analysis is also a differentiating criterion in the method choosing process. There can be four different abstraction levels distinguished: simple abstraction of the individual factors that may affect innovation, context-dependent abstraction of those specific factors, individual but complex abstraction of the factors and composite innovation of complex abstraction. After evaluating the factors we can choose the appropriate methodology: simple generation of index numbers, simple analysis based on ratios, classical statistical methods based on mainly correlation and regression models and manual path models. These are the ones that classical researches use for measuring innovation potential.
2.1Measurement based on simple index numbersThe simplest and most widespread way of measuring innovation in empirical practice is using, measuring and predicting simple index numbers. This methodology can be divided into four subgroups, which also gives a temporal dimension of the separation so that the increasing complexity and structure of the nature of the measurement can be observed. The first generation of the methodology relies on input indicators and focuses on the linear concept of innovation as it is marked out from the indicators. It concentrates mainly on R&D expenditures and other expenditures, which may be related to innovative processes.
The second generation of the indicators is expanded by the measurement of not just science and technology substance but also science and technology processes and activities, patents, publications and other indicators that can be comprehended as output indicators of innovation processes. The third generation has a much wider range of measurement. Publicly available data is supplemented by surveys and research based on primary results. The main priorities at this stage are benchmarking, international innovation ranks and service companies, also involved in research studies. The fourth generation of indicators are to examine such complex and difficult to measure indicators as accumulated knowledge capital, wikis, intangible resources, clusters and networks, and management techniques shaping the full spectrum of the included indicators of measurement.
Using these methods researchers often pick out one of the large amount of indicators or maybe a set of them, which are considered to be the most dominant to describe innovation potential and innovation processes. In the following table I collected these picked out variables that characterize a certain innovation model or research indicating the authors as well who found them critically important.
2.2Analysis based on partition numbersSlightly more complex methodologies are those where the measured indexes are not just individually shown and analysed separate from related ones, but ratios and partitions are constituted. This method makes it possible to analyse time series and wider the horizon by vertical and horizontal analyses as well giving the possibility to create richer inferences. These authors created a partition number based innovation measurement model are as follows: Hitt (1997), Francois (2002), Koberg (1996), Sørensen (2000), Romijn (2002), Lukas (2000) and Souitaris (2002).
2.3Analysis based on correlation modelsThese models are mainly based on regression models as the most widespread statistical models. These are very simple models with the innovation potential or performance as a dependent variable and many other variables mentioned above as independent variables. At this point many researchers may make a mistake, as they do not bother about disturbing autocorrelations. However these models cannot handle this real-life problem. With these methods users can simple aggregate many different variables and, it is well supported by many software. However they have a very strict and hardly achievable casemaps. These calculations are extremely widespread in social sciences although it is hard to find any in literature for innovation potential determination.
2.4Complex statistical models based on regressionTwo groups of complex regression model-based innovation measurement systems can be found. Firstly the causal multiregression models, the so-called path models or manual models (Kása, 2007) which consist of many consecutive regression models with many multidependent variables and one final dependent (usually innovation potential and many related variables). The algorithm decomposes the zero-order Pearson's linear correlation into two synergistic parts. One of them is the direct impact of the independent variable on the final dependant variable (innovation potential) and the other is the impact that independent variables have on other variables of the model, and through them on the final dependant variable.
The other possibility is the multidimensional regression models: canonical correlation, discriminant analysis and latent variable models, such as exploratory and confirmatory factor analysis, multidimensional scaling and correspondence model (Molnár, 2008). These methods require greater experiences and a deeper understanding of statistics; their usage is not too widespread although they would be suitable methodologies.
An overview of the current situation of measuring innovation potential was given in this chapter, pointing on the fact that the most often used models are the simplest ones with a low level of abstraction, mainly based on the comparison of index numbers although their usage is far from problem-free.
Considering the above discussed methodological issues it can be concluded that the common classical measuring methods of innovation potential are unable to deal with restrictive requirements and fulfil modelling requirements. An obvious solution for this problem can be a certain application of robust modelling which is shown in next section.
3A robust model for innovation potential estimationFuzzy technologies have become a magic word in engineering, logistics or even in medical sciences; however, it is scarcely used in the fields of social sciences. In contrast to hard calculations – where accuracy, assurance and rigidity are the primary points of view – this soft calculation method returns to the stochastic reality, which is characterized by the tolerance of inaccuracy and some doubtfulness, thus creating effective synergy between casual linguistic and classical analytical modelling.
Methods of artificial intelligence are used increasingly in many fields nowadays. On the one hand solving problems, which cannot be solved without rigid restrictive terms using the traditional mathematical/statistical methods, and on the other hand in fields where new alternatives are drawn into problem solving. Precise, deterministic methods are used on certain fields, such as analysis, decision support, statistics or regulation. For optimizing methods, linear programming tools are used for solving simpler problems, while non-linear or dynamic programming tools are used for more difficult problems. In function approximation mostly interpolation is used, while in decision support analysing methods are preferred. But what if when a problem is so complex (viz. close to reality), so that we simply cannot prescribe the function whose optimum we are searching or analyses do not provide satisfactory results, possibly combined with high statistical errors and low confidence levels or only heuristic, approximate inferences can be drawn. In these cases tools of artificial intelligence may provide assistance.
My goal is to establish a model that can
- •
forecast/estimate the innovation performance of a corporation/cluster.
- •
solve statistical and methodological problems such as
- -
stability – plasticity
- -
interpretability – precision – significancy using linguistic variables.
- -
- •
offer solution for information granulation
- •
avoid significant loss of information observed at hard statistic methods
- •
adapt to varying environment
- •
manage the research units in a single system
Nevertheless, it may exploit and algorithmize the benefits of the everyday human thinking (soft calculation – fuzzy logic) and the learning and adaptation abilities of the neural systems – the synergy between the mathematized everyday human thinking and classical mathematics.
3.1Modelling issues and performance objectivesResearchers tend to say that a model is not needed to develop a fuzzy controller, and this is the main advantage of the approach. However, will a proper understanding of the plant dynamics be obtained without trying to use first principles of physics to develop a mathematical model? And will a proper understanding of how to control the plant be obtained without simulation-based evaluations that also need a model? We always know roughly what process we are controlling (e.g., we know whether it is a vehicle or a nuclear reactor or a social model), and it is often possible to produce at least an approximate model (Passino & Yurkovich, 1997).
For a safety-critical application, if a formal model is not used, it is not possible to perform mathematical analysis or simulation-based evaluations. Is it wise to ignore these analytical approaches for such applications? Clearly, there will be some applications where you can simply “hack” together a controller, even fuzzy or conventional and go directly to implementation. In such a situation there is no need for a formal model of the process; however, is this type of control problem really so challenging that fuzzy control is ever needed?
Basically, the role of modelling in fuzzy control design is quite similar to its role in conventional control system design. In fuzzy control there is a more significant emphasis on the use of heuristics, but in many control approaches (e.g., PID control for process control) there is a similar emphasis (see for example Li & Gatland, 1996; Kukolj, Kuzmanović, & Levi, 2001; Kovačić & Bogdan, 2006).
In fuzzy control there is a focus on the use of rules to represent how to control the plant rather than ordinary differential equations (ODE). This approach3 can offer some advantages in that the representation of knowledge in rules seems more lucid and natural to some people. For others, though, the use of differential equations is more clear and natural. Basically, there is simply a “language difference” between fuzzy and conventional control: ODEs are the language of conventional control, and rules are the language of fuzzy control.
According to Passino–Yurkovich fuzzy control system design essentially amounts to
- •
choosing the fuzzy controller inputs and outputs
- •
choosing the pre-processing that is needed for the controller inputs and possibly post-processing that is needed for the outputs
- •
designing each of the four components of the fuzzy controller shown in Fig. 1.

The fuzzy rule base is a central component of the fuzzy controller and it represents the “intelligence” in the fuzzy control algorithm. The rule-base is constructed so that it represents a human expert “in-the-loop”. The information that we load into the rules in the rule-base may come from some human expert (this is the place where the designer's knowledge and experience must be correctly interpreted and organized into an appropriate set of rules). In some situations when there is no such human expert with many experiments, the control engineer will simply study the problem (perhaps using modelling and simulation) and write down a set of control rules that make sense (Smith, Gupta, 2001).
As an example, in the cruise control problem discussed above it is clear that anyone who has experience driving a car can practice regulating the speed about a desired set-point and load this information into a rule-base. For instance, one rule that a human driver may use is “If the speed is lower than the set-point, then press down further on the accelerator pedal” (Kasabov, 1998; Passino & Yurkovich, 1997) Every fuzzy rule can be divided into an antecedent part (IF...) and a consequent part (THEN...), with antecedent parts describing causes and consequent parts describing consequences relevant for control action. (Bouslama & Ichikawa, 1992).
A rule that would represent even more detailed information about how to regulate the speed would be “If the speed is lower than the set-point AND the speed is approaching the set-point very fast, then release the accelerator pedal by a small amount”. This second rule characterizes our knowledge about how to make sure that we do not overshoot our desired goal (the set-point speed). Generally speaking, if we load very detailed expertise into the rule-base, we enhance our chances of obtaining better performance (Lu, Chen, & Ying, 2001).
3.2Performance evaluationThe basic reason for this is that a fuzzy controller is a nonlinear controller – so many conventional modelling, analysis (via mathematics, simulation, or experimentation), and design ideas apply directly (Passino & Yurkovich, 1997).
Since fuzzy control is a relatively new technology, it is often quite important to determine what value it has relative to conventional methods. Unfortunately, few have performed detailed comparative analyses between conventional and intelligent control that have taken into account a wide array of available conventional methods (linear, nonlinear, adaptive, etc.); fuzzy control methods (direct, adaptive, supervisory); theoretical, simulation, and experimental analyses; computational issues; and so on.
Moreover, most work in fuzzy control to date has focused only on its advantages and has not taken a critical look at what possible disadvantages there could be to using it (hence the reader should be cautioned about this when reading the literature). For example, the following questions are cause for concern when a strategy of gathering heuristic control knowledge is employed:
- •
Will the behaviours that are observed by a human expert and used to construct the fuzzy controller include all situations that can occur due to disturbances, noise, or plant parameter variations?
- •
Can the human expert realistically and reliably foresee problems that could arise from closed-loop system instabilities or limit cycles?
- •
Will the human expert be able to effectively incorporate stability criteria and performance objectives (e.g., rise-time, overshoot, and tracking specifications) into a rule-base to ensure that reliable operation can be obtained? (Passino & Yurkovich, 1997)
These questions may seem even more troublesome (1) if the control problem involves a safety-critical environment where the failure of the control system to meet performance objectives could lead to loss of human life or an environmental disaster, or (2) if the human expert's knowledge implemented in the fuzzy controller is somewhat inferior to that of the very experienced specialist we would expect to design the control system (different designers have different levels of expertise).
Clearly, then, for some applications there is a need for a methodology to develop, implement, and evaluate fuzzy controllers to ensure that they are reliable in meeting their performance specifications.
3.3Model frameworkThe architecture of my fuzzy controller or fuzzy logic controller (FLC) is shown below as a block diagram. This model is composed of four main elements (as argued for example in Ishibuchi, Noyaki, Tanaka, Hosaka, & Matsuda, 1994 or Kovačić & Bogdan, 2006):
- •
A fuzzy rule base (a set of IF-THEN rules) which has a fuzzy logic quantification of the expert's linguistic description of how to achieve a good control. It contains the knowledge in the form of a set or rules.
- •
An inference mechanism or inference engine (fuzzy inference module), which emulates the expert's judgement making in interpreting and applying knowledge about how to make predictions in desired fields.
- •
A fuzzification interface, which converts controller inputs into information that the inference mechanism can easily use to activate and apply rules.
- •
A defuzzification interface, which converts the conclusions of the interference mechanism into actual inputs of the process.
Basically we should view the fuzzy controller as an artificial decision maker that operates in a closed-loop system in real time. It gathers output data y(t), compares it to the reference input r(t) and then decides what the plant input u(t) should be to ensure that the performance objectives will be met.
Fuzzification: Fuzzy sets are used to quantify the information in the rule base, and the inference mechanism operates on fuzzy sets to produce fuzzy sets, so it must be specified, how the fuzzy system will convert its numeric inputs into linguistic outputs. Let x∈X be a linguistic variable and Ti(x) be a fuzzy set associated with a linguistic value Ti. The conversion of a physical (numerical) value of x into a corresponding linguistic value by associating a membership degree, x→μTi (x) is called fuzzification. The membership degree μTi (x) represents the fuzzy equivalent of the value of x (Kovačić & Bogdan, 2006).
Interference Mechanism: The inference mechanism has two basic tasks:
- •
determining the extent to which each rule is relevant to the current situation as characterized by the inputs ui, i=1, 2,…,n (we call this task “matching”)
- •
drawing conclusions using the current inputs ui and the information in the rule-base (we call this task an “inference step”). For matching note that A1j×A2k×⋯×Anl is the fuzzy set representing the premise of the ith rule (j, k,…, l; p, q)i (there may be more than one such rule with this premise) (Passino & Yurkovich, 1997).
Defuzzification: The result of fuzzy inference is a fuzzy output set. On the other hand, every control task will imply the existence of a crisp value at the fuzzy controller output. The procedure which extracts crisp output value from a fuzzy output set is called defuzzification.
The other module of my model is the adaptive neural network where controlled learning happens. This module successfully and accurately approximates complex nonlinear mappings, as well as does not need any priory information on the distribution of the data or the shape of the functions of their relationships. It has a very flexible and robust architecture against noise and incomplete data. Operating the system is easy: it responds quickly and efficiently to a changing environment and can be easily updated.
The neural network model is based on the following parameters, which describe a neuron:
- •
Input connections (or inputs): x1, x2, …, xn. There are weights bound to the input connections: w1, w2, …, wn; one input to the neuron, called a bias, has a constant value of 1 and is usually represented as a separate input, say x0.
- •
Input function f, calculates the aggregated net input signal to the neuron u=f(x, w), where x and w are the corresponding input and weight vectors; f is usually the summation function:
- •
An activation (signal) function s calculates the activation level of the neuron a=s(u).
- •
An output function calculates the output signal value emitted through the output (the axon) of the neuron: o=g(a); the output signal is usually assumed to be equal to the activation level of the neuron, that is, o=a (Kasabov, 1998).
The neurons of this network receive information through their directional links and form a single output. The number of the received input has no limit (Retter, 2006). Due to this process the o(t) function calculated by the neurons has n argument which requires the soma to transform the input signs into a single numerical value. Accordingly the soma of the neurons has two separate functional units: an aggregative summation unit where an integrative function transforms a single net value of the function of n, and the transfer or activation unit with its u(t) function – which acts as a nonlinear filter forcing the output values between two asymptotes creating the o(t) output of this neuron. The aim of this nonlinear activation function is to ensure that the answer of the neuron will be bounded so as a result of activation stimulus it will be conditioned or damped and thus the output value of innovation potential will be adjustable (Retter, 2006).
The summation process is a cumulative although it could be also quadratic, polynomial or spherical. Thus ∑i=1nwixi sumproduct of the inputs is generated: net variable is the scalar multiplication of input vectors:
where w's weight vector is:and x's input vector is:
The wi weight vectors are the adjustable parameters of the neurons, which are modified by some learning rules as input–output pairs reach a specific objective function. The planner according to their goals should choose the activation function. A general neuron is described as an activation function and refers to its output sign:
The formula shows that first the neuron performs the weighted summation of inputs, and calculates the scalar multiplication so the net input of the activation function is given. Thereafter the activation function accepts this net value and forces it between [0;1] or [−1;1] range during the f(net) non-linear transformation. My activation function during the model operation in range [−1;1] is a bipolar sigmoid function of:
and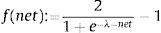
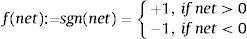
bipolar hard-limiting function where λ>0 coefficient determines the slope of continuous and strictly increasing f(net) function at net=0. The bound of this function at λ→∞ is the sgn(net) defined by f(net) function. These analytical processes are shown below as a block diagram, which represents the operation of my innovation potential approximation model.
3.4Input vectorsIn order to furnish the model with observations a 100-element sample (97 were useable) out of the 207-element population of processing industry companies in Hungary with more than 250 employees was taken in 2011 that consists 46.11% of the whole population. The sample is significant both by sectorial distribution (Mann–Whitney U-test; p=0.197) and by geographical (NUTS-2) distribution (Mann–Whitney U-test; p=0.329). Innovation potential is estimated by 75 measured (on 1–6 Likert scale containing 3–3 linguistic assessments which measure the degree of agreement with the statement) individual variables in the model that were grouped into 9 grouping variables and they were split into 17 factor components. These are as follows: motivation, socialization (organisation culture, age of experts), adaptation, strategy, diffusion (stakeholder cooperation, secondary information retrieval, external cooperation), information (internal information infrastructure, external information infrastructure), resources (intangible resources, material resources), technology (technological modernity, push technologies, pull technologies), results (objective, subjective) and action (internal push innovation, external pull innovation) as the dependent variable(s) (Kása, 2011).
This set of variables conform to the recommendations of Frascati Manual and Oslo Manual. As performance parameters of the model the following tests were performed: analysis of coefficients of determination, residual sum of squares, mean squared errors, forecasting interval calculation, separation and ranking statistics (ROC, AUROC), distribution of estimated pseudo-probabilities, proportions of incorrect estimations and relative errors.
To determine whether classical (regression-based) techniques or neurofuzzy systems give better estimations of innovation potential several model were built. According to model type: neurofuzzy models, neural networks and regression models; according to the distribution: discrete and continuous models, according to number of dependant variables: one (cumulated innovation actions), and two (push and pull innovation actions); and according to the sources of input data: pure observation data and noise contaminated data (50% observation and 50% noise) for control tests. The combination of these parameters resulted in 36 different models.
4Discussion and resultsWith this methodology twelve different models were created, separated according to their dependent variable (innovation potential, internal push or market pull innovation potential), discrete and continuous distribution of the dependent variable, and duplicated this six with noise-contaminated samples as well to test their performance in filtering the noises. Hereby I would like to show the model of the discrete innovation potential approximation.
The model learns concatenations from the vectors of 17 input factors and gives estimation for the innovativeness of a company. In this discrete case there can be four dedicated outcomes of estimation: the examined unit can be very innovative, moderately innovative, less innovative, or not innovative.
This learning process was really effective as shown below in the table of analysis of variance: the sets of rules created by the model can explain 95% of the variance of the input–output pairs.
The figure below is the graphical representation of the model with its input factors, submodels and output variable. The iteration excluded from the estimation the adaptation and material resources. Submodel No.7 has the key factors of the estimation: innovation culture, technological modernity, stakeholder cooperation and internal information infrastructure (Figs. 2–8).


Generational development of innovation indicators.


There is a pretty strong relationship between observed and estimated values. Looking at the results of the estimation in Fig. 9, it is clear that there are only few outstanding cases (flagged with dark grey). The range of estimated values are adequately low and scattered close around the observed values, which is described by a very high R2 of 0.9595.

That finding above is also supported by the observation of the estimation errors for each category representation. The diagram below shows that the highly innovative (No. 1) category is slightly overestimated – however only one case exceeds the 0.5 point tolerance (in this very one case the model made a bad estimation) (Figs. 10–12).


In category two there are two incorrectly estimated (outside of tolerance) cases: one of them is an overestimation and the other is underestimation of innovation potential. The third category has one underestimation and two in category four. These are red flagged cases. So the model produced six incorrect estimations out of 97 which gives a 94% of correct estimations.
The algorithm has generated many fuzzy rules; I exported the following ones from the rulebase of submodel seven. These rules are true-false type. WHEN culture is LOW AND technology modernity is HIGH AND stakeholder cooperation is LOW AND internal information infrastructure is HIGH THAN innovation potential is HIGH.
The performance of the estimations is perfect as the ratio of correct estimations is 94% and the variance explained by the parameters is 95%.
5Findings and conclusionsIn this research I made six different neurofuzzy models and six neural networks and six multivariate regression models as a control of performance test. I even ensured the results’ objectivity by using noise-contaminated data as well. The results of the performance test are shown below. In every case both neural networks and neurofuzzy systems outperformed regression models. In every aspect neurofuzzy systems gave the most efficient estimation for innovation potential.
Having the results of performance tests of all 36 models it can be concluded, that the best estimation model for the innovation potential is the neutralized fuzzy model.
The most noise-resistant model is also the neurofuzzy model: it can easily recognize and filter noisy data while regression models cannot handle them, they just incorporate them into the model.
The main reason of the explosive spread of fuzzy systems in the nineties was the conviction that these methods can provide solutions to any kind of control problems and classical control systems would give their place to these systems. It seems today that this conception was not correct mainly because of the limitations of the system. The most serious problem is that we do not have a generalized and systematic method for the efficient transformation of expert knowledge of experience into the rule base of a fuzzy inference system. Another big problem is that there is no such an algorithm, which would give the optimal number of fuzzy rules. It is not possible to measure the stability of the controlled system because the mathematical model is not known. It can also arise that the generated rules are not consistent for the human mind; there can be contradictions as well. The iteration of the model can be too long; fuzzification is time-consuming such as the complex operators of defuzzification.
Neural networks also have some weaknesses. The weights of the estimated networks are very difficult to interpret. The probability of finding not just a local minimum of error functions of the network during the long iteration process can be low when it does not converge towards the global minimum. The model requires a large size sample, which can significantly increase the hardware requirements of the system. It is also very time-consuming to reach the optimal architecture of the network and this process is often heuristic. The system might be over-learned which reduces the generalization ability of the model.
In spite of these limitations the usage of these soft models worth the effort because these can reach much more effectiveness and have much less restrictive requirements than classical hard computing methods.
E.g. according to Schumpeter's (1934) typing (new products or services, improving the quality of existing, new sources of supply, new markets or developing more efficient organization).
There are many examples in empirical studies where the method would require numerical data (e.g. regression models) and in line with this criteria researchers transform (force) qualitative data into quantitative. This transformation is often not tolerated by the method and results in a high level of error parameters.


www.publicationethics.org.