


Background/Objective: The Life Orientation Test-Revised (LOT-R) is often used to assess dispositional optimism. The aims of this study were to test psychometric properties of the LOT-R, to provide normative scores, and to test the association between optimism and several psychological, sociodemographic, and behavioral factors. Method: A randomly selected German general population community sample with an age range of 18-80 years (N=9,711) was surveyed. Results: The Confirmatory Factor Analysis (CFA) proved two (correlated) factors: Optimism and Pessimism. Invariance tests across gender and age groups confirmed metric invariance. There were only small gender differences in the LOT-R total score (M=16.4 for females and M=16.1 for males). The correlation between the subscales Optimism and Pessimism was strong for young and well educated people. Low optimism mean scores were observed for unemployed people, people with low income, smokers, and obese people. Normative scores of the LOT-R are provided. Conclusions: The study confirmed the bidimensional structure of the LOT-R and invariance across age and gender. We can recommend using this instrument for measuring dispositional optimism and pessimism in epidemiological research and clinical practice.
Antecedentes/Objetivo: La versión revisada del Life Orientation Test (LOT-R) se emplea a menudo para evaluar el optimismo disposicional. Los objetivos de este estudio fueron establecer las propiedades psicométricas del LOT-R, y probar la asociación entre optimismo y varios factores psicológicos, socio-demográficos y conductuales. Método: Para ello se entrevistó una muestra comunitaria aleatoriamente seleccionada de la población general alemana, con un rango de edad de 19-80 años (N=9.711). Resultados: El Análisis Factorial Confirmatorio (CFA) sugiere dos factores (correlacionados): Optimismo y Pesimismo. Las pruebas de invarianza para género y edad confirmaron la invarianza métrica. Solamente se encontraron pequeñas diferencias de género en el puntaje total (M=16,4 para mujeres y M=16,1 para hombres). Se encontraron bajos puntajes medios en personas desempleadas, personas con bajos ingresos, fumadores y personas con obesidad. Se proveen valores normativos para el LOT-R. Conclusiones: El estudio confirma la estructura bidimensional del LOT-R y la invarianza en género y edad. El instrumento puede recomendarse para medir optimismo disposicional y pesimismo en investigación epidemiológica y en la práctica clínica.
Dispositional optimism is defined as a general tendency to expect positive outcomes (Carver & Scheier, 2014; Carver, Scheier, & Segerstrom, 2010). It is one of the resource-oriented variables that have gained increasing interest in recent years as part of the larger trend of finding new ways to supplement the traditionally deficit-oriented perspective of clinical psychology. Optimism is associated with differences in mental (Carver et al., 2010) and physical (Rasmussen, Scheier, & Greenhouse, 2009; Roy et al., 2010) health, quality of life (Gison, Rizza, Bonassi, Donati, & Giaquinto, 2015; Jiang et al., 2014; Kreis et al., 2015; Vera-Villarroel, Valtierra, & Contreras, 2016), life satisfaction (Jiang et al., 2014), adaptive coping styles (Nes & Segerstrom, 2006), recovery after severe illness (Scheier et al., 1999), and even mortality (Anthony, Kritz-Silverstein, & Barrett-Connor, 2016; Giltay, Geleijnse, Zitman, Hoekstra, & Schouten, 2004; Grossardt, Bower, Geda, Colligan, & Rocca, 2009).
The Life Orientation Test-Revised (LOT-R) (Scheier, Carver, & Bridges, 1994) is the test used most often for assessing dispositional optimism. It has been translated to many languages and psychometrically tested in multiple studies, including tests of its dimensional structure (Cano-García et al., 2015; Glaesmer et al., 2012; Zenger et al., 2013), temporal stability (Saboonchi, Petersson, Alexanderson, Brandstrom, & Wennman-Larsen, 2016), and item response theory (Chiesi, Galli, Primi, Innocenti Borgi, & Bonacchi, 2013; Steca, Monzani, Greco, Chiesi, & Primi, 2015). The LOT-R has proved to be an independent predictor of later depression in the general population (Armbruster, Pieper, Klotsche, & Hoyer, 2015) and in cancer patients (Zenger, Brix, Borowski, Stolzenburg, & Hinz, 2010). Normative values of the general population are available for Germany (Glaesmer et al., 2012) and Colombia (Zenger et al., 2013). The test consists of two subscales, Optimism and Pessimism. Originally, the test was designed as a unidimensional instrument. However, the correlation between the subscales (which have been theoretically assumed to be substantially negative) proved to be weak in most empirical studies with coefficients of about r=-.20. Furthermore, confirmatory factorial analyses yielded markedly better fit indices for a two-factorial model compared to the originally designed one-dimensional model (Glaesmer et al., 2012; Monzani, Steca, & Greco, 2014; Zenger et al., 2013). Based on a sample of 906 Spanish participants, Cano-García et al. (2015) tested several models using CFA. They found that the one-factorial model was better than the model with two independent factors (optimism and pessimism), but that a bifactorial model, whereby the two factors were allowed to be correlated, provided the best fit indices. A further study (Zenger et al., 2013) confirmed these findings, tested the invariance across age and gender, and proved age and gender invariance.
In two studies analyzing correlations between optimism and pessimism (Glaesmer et al., 2012; Herzberg, Glaesmer, & Hoyer, 2006), it was observed that the theoretically assumed negative correlations were (at least partly) obtained in subsamples of young and well educated people, while in older and less educated subsamples the correlations were near zero. Our intent with this study was to test whether this effect can be confirmed. Several studies have correlated the LOT-R scores with other scales and found correlations with variables such as mental and physical quality of life fatigue, anxiety, depression, and self-efficacy (Glaesmer et al., 2012; Monzani et al., 2014; Zenger et al., 2013). An accidental finding in these studies was that the magnitude of the correlation of the optimism subscale was higher than that of the pessimism subscale. We aimed at proving this effect in our study as well. While previous studies have examined age and gender differences in optimism and pessimism, little is known about the relationship between optimism and other sociodemographic variables (civil status, employment status) or behavioral variables (alcohol consumption, smoking). Large samples are necessary to conduct such analyses.
The aims of this study were (a) to test age and gender differences in the LOT-R mean scores and to provide new normative values, (b) to test psychometric properties and the dimensional structure of the LOT-R, including invariance tests across age and gender, and (c) to analyze associations between the LOT-R scores and several sociodemographic and behavioral variables.
MethodParticipantsThe LIFE-Adult-Study, conducted by the Leipzig Center for Civilization Diseases (LIFE), is a population-based study with a representative sample of residents from Leipzig, Germany, a city with a population of about 550,000. An age- and gender- stratified random selection of inhabitants was obtained from the local residents’ registration office. The age range was 18 to 80 years. According to the study protocol, the focus was on the age group 40-80 years; the 18-39 years age range was included but underrepresented. At the study center, the participants underwent a set of assessment batteries, including collection of their sociodemographic data, medical history, lifestyle factors, and several medical examinations. Pregnancy and insufficient command of the German language were exclusion criteria. The participants received a lump sum of 20 EUR to cover their travel expenses. Details of the study design are published elsewhere (Loeffler et al., 2015). Informed consent was obtained from all participants. The study was approved by the ethics committee of the University of Leipzig.
InstrumentsThe LOT-R (Scheier et al., 1994) is composed of 10 items. Three items assess optimism, three items assess pessimism, and there are four filler items. Respondents are asked to indicate the degree to which they agree with the items on a five-point Likert scale (cf. Hartley, 2014). The scores of the Optimism and Pessimism subscales are calculated by summing up the corresponding three items, resulting in a score range of 0 to 12. The total sum score is calculated by adding the optimism score and the inverted pessimism score. Sociodemographic factors were obtained in a structured interview. Alcohol consumption was assessed with regard to frequency and amount of different alcoholic beverages consumed within the last year, and tobacco use with questions on past and current smoking, smoking duration, and amounts of different tobacco products.
Statistical methodsAge and gender differences were tested with a two-factorial ANOVA, using the factors age group (5 categories according to Table 1) and gender (2 categories). Cronbach's alpha coefficient was used to determine internal consistency. Effect sizes were calculated using Cohen's d, relating the mean score differences to the pooled standard deviation. Percentile rank scores were defined in the same way as in the previous German normative study (Glaesmer et al., 2012): percentile rank=(m+0.5 k)/N * 100, where m is the number of members of the sample obtaining a score lower than the score of interest, k is the number obtaining the score of interest, and N is the overall sample size. Logistic regression analyses were performed to quantify the effect of socioeconomic status, education, professional status, alcohol consumption, tobacco smoking, and obesity on the LOT-R scores, adjusting for age and gender. The calculations were performed with SPSS version 20.
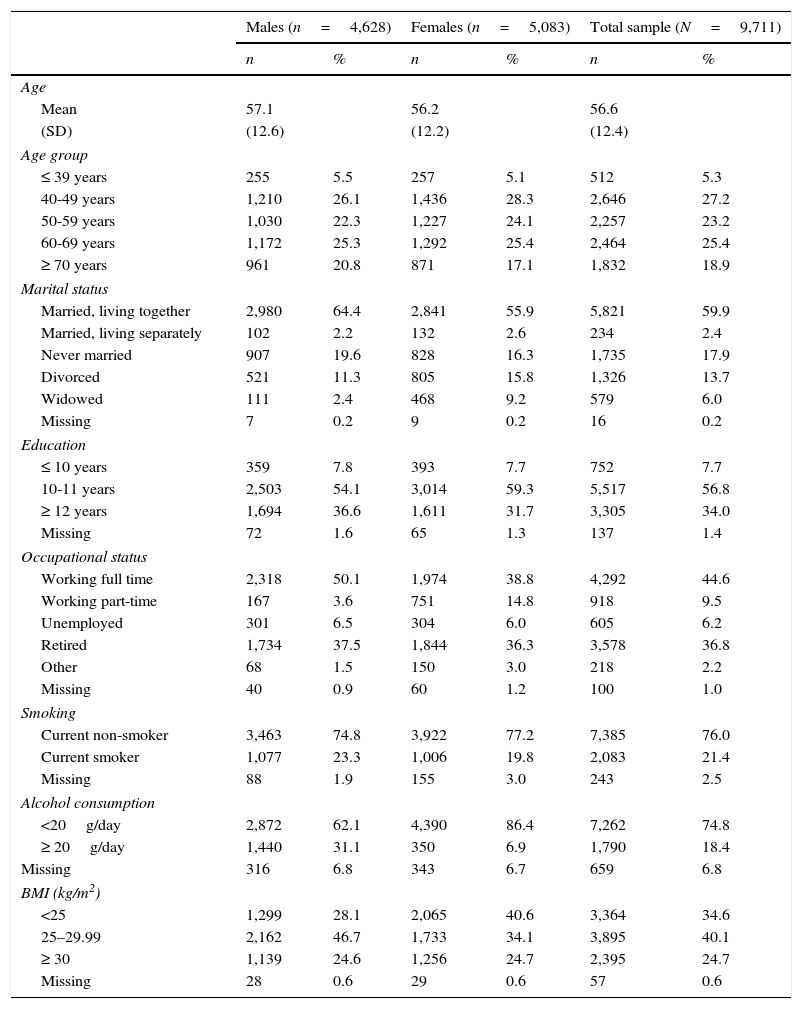
Sociodemographic characteristics of the sample.
| Males (n=4,628) | Females (n=5,083) | Total sample (N=9,711) | ||||
|---|---|---|---|---|---|---|
| n | % | n | % | n | % | |
| Age | ||||||
| Mean | 57.1 | 56.2 | 56.6 | |||
| (SD) | (12.6) | (12.2) | (12.4) | |||
| Age group | ||||||
| ≤ 39 years | 255 | 5.5 | 257 | 5.1 | 512 | 5.3 |
| 40-49 years | 1,210 | 26.1 | 1,436 | 28.3 | 2,646 | 27.2 |
| 50-59 years | 1,030 | 22.3 | 1,227 | 24.1 | 2,257 | 23.2 |
| 60-69 years | 1,172 | 25.3 | 1,292 | 25.4 | 2,464 | 25.4 |
| ≥ 70 years | 961 | 20.8 | 871 | 17.1 | 1,832 | 18.9 |
| Marital status | ||||||
| Married, living together | 2,980 | 64.4 | 2,841 | 55.9 | 5,821 | 59.9 |
| Married, living separately | 102 | 2.2 | 132 | 2.6 | 234 | 2.4 |
| Never married | 907 | 19.6 | 828 | 16.3 | 1,735 | 17.9 |
| Divorced | 521 | 11.3 | 805 | 15.8 | 1,326 | 13.7 |
| Widowed | 111 | 2.4 | 468 | 9.2 | 579 | 6.0 |
| Missing | 7 | 0.2 | 9 | 0.2 | 16 | 0.2 |
| Education | ||||||
| ≤ 10 years | 359 | 7.8 | 393 | 7.7 | 752 | 7.7 |
| 10-11 years | 2,503 | 54.1 | 3,014 | 59.3 | 5,517 | 56.8 |
| ≥ 12 years | 1,694 | 36.6 | 1,611 | 31.7 | 3,305 | 34.0 |
| Missing | 72 | 1.6 | 65 | 1.3 | 137 | 1.4 |
| Occupational status | ||||||
| Working full time | 2,318 | 50.1 | 1,974 | 38.8 | 4,292 | 44.6 |
| Working part-time | 167 | 3.6 | 751 | 14.8 | 918 | 9.5 |
| Unemployed | 301 | 6.5 | 304 | 6.0 | 605 | 6.2 |
| Retired | 1,734 | 37.5 | 1,844 | 36.3 | 3,578 | 36.8 |
| Other | 68 | 1.5 | 150 | 3.0 | 218 | 2.2 |
| Missing | 40 | 0.9 | 60 | 1.2 | 100 | 1.0 |
| Smoking | ||||||
| Current non-smoker | 3,463 | 74.8 | 3,922 | 77.2 | 7,385 | 76.0 |
| Current smoker | 1,077 | 23.3 | 1,006 | 19.8 | 2,083 | 21.4 |
| Missing | 88 | 1.9 | 155 | 3.0 | 243 | 2.5 |
| Alcohol consumption | ||||||
| <20g/day | 2,872 | 62.1 | 4,390 | 86.4 | 7,262 | 74.8 |
| ≥ 20g/day | 1,440 | 31.1 | 350 | 6.9 | 1,790 | 18.4 |
| Missing | 316 | 6.8 | 343 | 6.7 | 659 | 6.8 |
| BMI (kg/m2) | ||||||
| <25 | 1,299 | 28.1 | 2,065 | 40.6 | 3,364 | 34.6 |
| 25–29.99 | 2,162 | 46.7 | 1,733 | 34.1 | 3,895 | 40.1 |
| ≥ 30 | 1,139 | 24.6 | 1,256 | 24.7 | 2,395 | 24.7 |
| Missing | 28 | 0.6 | 29 | 0.6 | 57 | 0.6 |
The factorial structure was tested with Confirmatory Factor Analyses (CFA), performed with AMOS 20. All models were calculated using covariance matrices, and each model was estimated with the maximum likelihood method approach. All models were compared to each other on the basis of the following model fit indices: minimum discrepancy divided by its degrees of freedom (CMIN/DF), normed fit index (NFI), comparative fit index (CFI), Tucker-Lewis Index (TLI), root mean square error of approximation (RMSEA), standardized root mean square residual (SRMR), and Bayesian Information Criterion (BIC). For a good model fit, the ratio CMIN/DF should be as small as possible (Schermelleh-Engel, Moosbrugger, & Müller, 2003); values of NFI, CFI and TLI close to .95 or higher are indicative of a good or at least acceptable (>.90) model fit. Furthermore, RMSEA should be .08 or smaller, and SRMR should be .05 or smaller. The BIC is a descriptive indicator of poor fit for the comparison between two models; the model with the lower BIC should be preferred (Schermelleh-Engel et al., 2003).
To test the invariance of the model across gender and age, further analyses were conducted using multi-group CFA. After testing the factorial structure in each subgroup, measurement invariance was tested in three steps: first using the configural model (no constraints), followed by a metric invariant model (with unstandardized item loadings constrained to be equal across groups), and finally a scalar invariant model (with unstandardized item loadings and unstandardized item intercepts simultaneously constrained to be equal across groups). Based on the hierarchy of these nested and increasingly restrictive models, the models were then compared to each other. Since the χ2 statistic has been criticized for its sensitivity to sample size, we focused mainly on the differences ΔCFI and ΔRMSEA. Values smaller than .01 indicate the invariance of the models (Cheung & Rensvold, 2002). For scaling purposes, the variance of each latent variable was fixed to 1.0 and the mean was fixed to 0 to avoid the potential problem of selecting a marker variable that may not be invariant.
ResultsSample characteristicsThe total sample of the study program comprised 10,000 people from the general population. The response rate of the study was 33%. Further details of the sampling procedure are reported elsewhere (Loeffler et al., 2015). If only one item of a subscale (Optimism or Pessimism) was missing, it was replaced with the rounded mean of the other two items. Following this procedure, valid data were available for 9,711 persons. Table 1 presents the sociodemographic characteristics of this sample.
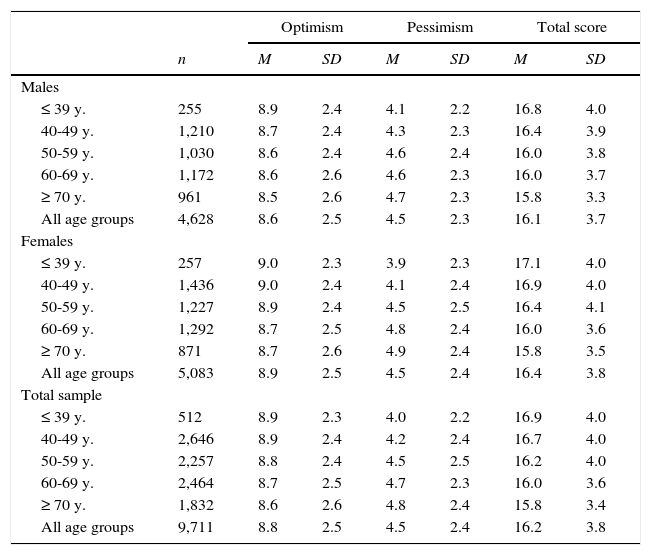
Age and gender differencesMales were slightly less optimistic (M=8.6) than females (M=8.9), effect size d=.12, but there were no gender differences in pessimism (Table 2). Pessimism increased with increasing age for males and females. The ANOVA results for the effects of gender and age group on optimism and pessimism were as follows: Optimism: Gender: F=10.2, p=.001; Age group: F=4.4, p=.002; Gender * Age group: F=.84, p=.494; Pessimism: Gender: F=.73, p=.394; Age group: F=26.4, p<.001; Gender * Age group: F=2.2, p=.066; Total score: Gender: F=6.9, p=.009; Age group: F=20.9, p<.001; Gender * Age group: F=1.75, p=.137.
LOT-R mean scores.
| Optimism | Pessimism | Total score | |||||
|---|---|---|---|---|---|---|---|
| n | M | SD | M | SD | M | SD | |
| Males | |||||||
| ≤ 39 y. | 255 | 8.9 | 2.4 | 4.1 | 2.2 | 16.8 | 4.0 |
| 40-49 y. | 1,210 | 8.7 | 2.4 | 4.3 | 2.3 | 16.4 | 3.9 |
| 50-59 y. | 1,030 | 8.6 | 2.4 | 4.6 | 2.4 | 16.0 | 3.8 |
| 60-69 y. | 1,172 | 8.6 | 2.6 | 4.6 | 2.3 | 16.0 | 3.7 |
| ≥ 70 y. | 961 | 8.5 | 2.6 | 4.7 | 2.3 | 15.8 | 3.3 |
| All age groups | 4,628 | 8.6 | 2.5 | 4.5 | 2.3 | 16.1 | 3.7 |
| Females | |||||||
| ≤ 39 y. | 257 | 9.0 | 2.3 | 3.9 | 2.3 | 17.1 | 4.0 |
| 40-49 y. | 1,436 | 9.0 | 2.4 | 4.1 | 2.4 | 16.9 | 4.0 |
| 50-59 y. | 1,227 | 8.9 | 2.4 | 4.5 | 2.5 | 16.4 | 4.1 |
| 60-69 y. | 1,292 | 8.7 | 2.5 | 4.8 | 2.4 | 16.0 | 3.6 |
| ≥ 70 y. | 871 | 8.7 | 2.6 | 4.9 | 2.4 | 15.8 | 3.5 |
| All age groups | 5,083 | 8.9 | 2.5 | 4.5 | 2.4 | 16.4 | 3.8 |
| Total sample | |||||||
| ≤ 39 y. | 512 | 8.9 | 2.3 | 4.0 | 2.2 | 16.9 | 4.0 |
| 40-49 y. | 2,646 | 8.9 | 2.4 | 4.2 | 2.4 | 16.7 | 4.0 |
| 50-59 y. | 2,257 | 8.8 | 2.4 | 4.5 | 2.5 | 16.2 | 4.0 |
| 60-69 y. | 2,464 | 8.7 | 2.5 | 4.7 | 2.3 | 16.0 | 3.6 |
| ≥ 70 y. | 1,832 | 8.6 | 2.6 | 4.8 | 2.4 | 15.8 | 3.4 |
| All age groups | 9,711 | 8.8 | 2.5 | 4.5 | 2.4 | 16.2 | 3.8 |
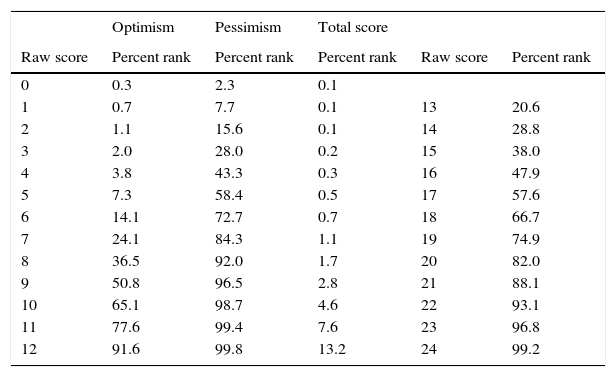
The reliability coefficients were: Optimism: alpha=.70; Pessimism: alpha=.63, and Total score: alpha=.66. The correlation between Optimism and Pessimism was calculated for several subgroups of the sample, concerning gender, age group, and education. For the total sample the correlation was r=-.22. Separated by gender, the correlations were r=-.21 (males) and r=-.24 (females). The age groups yielded the following results: r=-.50 (≤ 39 y.), r=-.40 (40-49 y.), r=-.31 (50-59 y.), r=-.12 (60-69 y.), and r=.05 (≥ 70 y.). Concerning education (in years), the correlations were r=.13 (< 10 y.), r=-.17 (10-11 y.), and r=-.38 (≥ 12 y.). The percentile rank scores of the LOT-R are listed in Table 3.
Percentile rank scores of the LOT-R.
| Optimism | Pessimism | Total score | |||
|---|---|---|---|---|---|
| Raw score | Percent rank | Percent rank | Percent rank | Raw score | Percent rank |
| 0 | 0.3 | 2.3 | 0.1 | ||
| 1 | 0.7 | 7.7 | 0.1 | 13 | 20.6 |
| 2 | 1.1 | 15.6 | 0.1 | 14 | 28.8 |
| 3 | 2.0 | 28.0 | 0.2 | 15 | 38.0 |
| 4 | 3.8 | 43.3 | 0.3 | 16 | 47.9 |
| 5 | 7.3 | 58.4 | 0.5 | 17 | 57.6 |
| 6 | 14.1 | 72.7 | 0.7 | 18 | 66.7 |
| 7 | 24.1 | 84.3 | 1.1 | 19 | 74.9 |
| 8 | 36.5 | 92.0 | 1.7 | 20 | 82.0 |
| 9 | 50.8 | 96.5 | 2.8 | 21 | 88.1 |
| 10 | 65.1 | 98.7 | 4.6 | 22 | 93.1 |
| 11 | 77.6 | 99.4 | 7.6 | 23 | 96.8 |
| 12 | 91.6 | 99.8 | 13.2 | 24 | 99.2 |
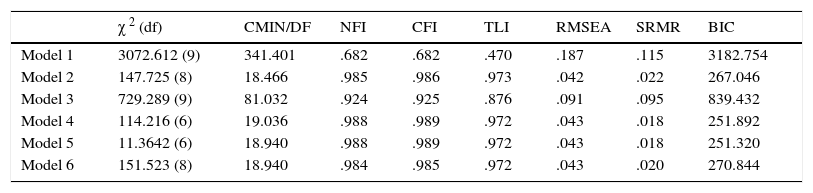
Factor models were tested with CFA according to the study of Cano-García et al. (2015). In that study seven models were tested, but models 3 and 4 were identical, so we calculated six models. Model 1 (one-factor model) is the unidimensional model of the LOT-R. Model 2 is a two-factor model (optimism and pessimism) with both latent variables correlated with each other. In this model, the positive items load onto one factor, and the negative items load onto the other. Model 3 also considers two factors (optimism and pessimism), but these factors are assumed to be uncorrelated. In Model 4 the three pessimism items are combined by a methods factor. Accordingly, in Model 5 the methods factor is related to the three optimism items. Model 6 is the “random intercept factor model” according to Maydeu-Olivares and Coffman (2006). It includes a method factor in addition to a unidimensional model of the LOT-R. Within this model, the intercepts of the method factor are allowed to vary freely across the individuals.Fit indices are given in Table 4. While models 1 and 3 showed insufficient model fit, the remaining four models (2, 4, 5, and 6) are characterized by very similar and good model fit coefficients. Among these four models we preferred the most parsimonious model (Model 2) for further analysis of measurement invariance. Empirical data support the assumption of a bi-dimensional factor structure of the LOT-R, with two latent factors that correlate with r=-.35. Standardized factor loadings of the latent variables on the related items varied between .56 and .76 for the optimism subscale and between .48 and .72 for the pessimism subscale.
Summary of fit indices of the factor models.
| χ 2 (df) | CMIN/DF | NFI | CFI | TLI | RMSEA | SRMR | BIC | |
|---|---|---|---|---|---|---|---|---|
| Model 1 | 3072.612 (9) | 341.401 | .682 | .682 | .470 | .187 | .115 | 3182.754 |
| Model 2 | 147.725 (8) | 18.466 | .985 | .986 | .973 | .042 | .022 | 267.046 |
| Model 3 | 729.289 (9) | 81.032 | .924 | .925 | .876 | .091 | .095 | 839.432 |
| Model 4 | 114.216 (6) | 19.036 | .988 | .989 | .972 | .043 | .018 | 251.892 |
| Model 5 | 11.3642 (6) | 18.940 | .988 | .989 | .972 | .043 | .018 | 251.320 |
| Model 6 | 151.523 (8) | 18.940 | .984 | .985 | .972 | .043 | .020 | 270.844 |
Note. df=degrees of freedom; CMIN/DF=minimum discrepancy, divided by its degrees of freedom; NFI=normed fit index; CFI=comparative fit index; TLI=Tucker-Lewis index; RMSEA=root mean square error of approximation; SRMR=standardized root mean square residual; BIC=Bayesian Information Criterion.
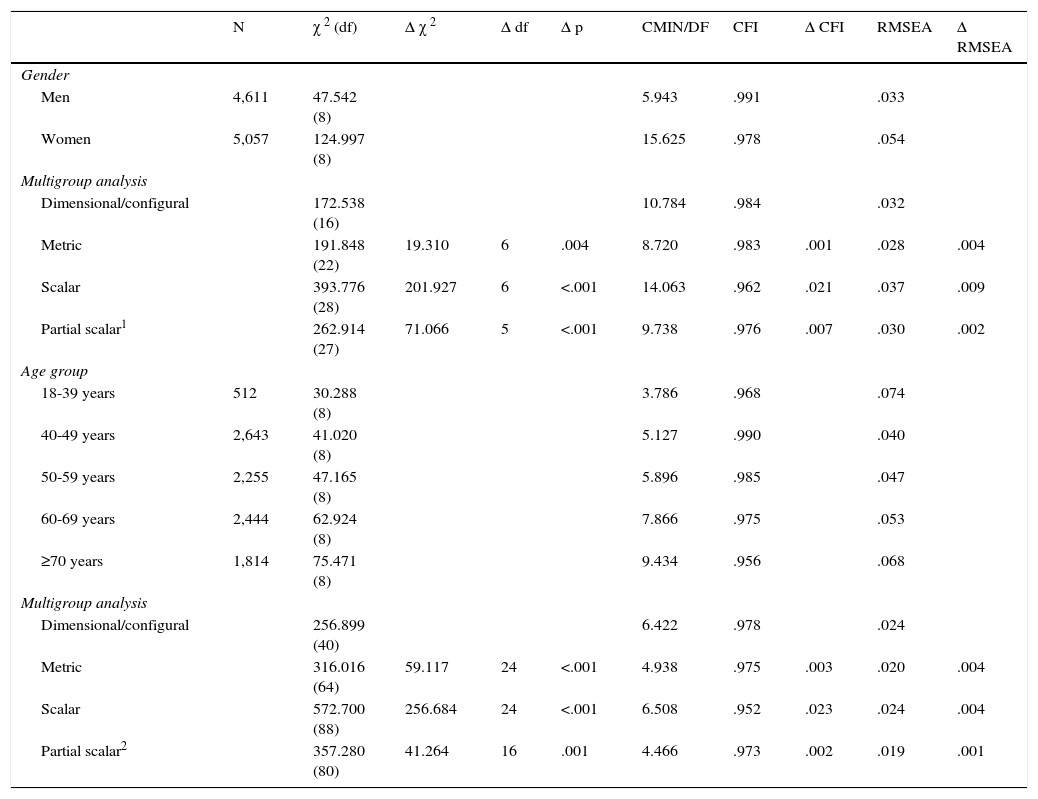
The invariance of the preferred model (Model 2) was tested across the subgroups of men and women and five age groups. Results of the measurement invariance tests are shown in Table 5. As the indices of ΔCFI and ΔRMSEA indicate (<.01), this model can be assumed to be metric invariant across gender and age groups. Due to ΔCFI>.02, scalar invariance could not be confirmed completely across men and women and all age groups. According to Gregorich (2006), the constraint of equal intercepts was freed for item 6 (invariance test for gender) and items 5 and 6 (invariance test for age) respectively, and the model was re-estimated for partial scalar invariance. As shown in Table 5, partial invariance across gender and all age groups could be confirmed. The Δχ2 statistic indicated significant differences in all cases of the invariance tests, but due to its sensitivity to sample size we focused on differences in RMSEA and CFI values (Schermelleh-Engel et al., 2003).
Test for invariance across gender and age of model 2 (two-factor model with correlated factors).
| N | χ 2 (df) | Δ χ 2 | Δ df | Δ p | CMIN/DF | CFI | Δ CFI | RMSEA | Δ RMSEA | |
|---|---|---|---|---|---|---|---|---|---|---|
| Gender | ||||||||||
| Men | 4,611 | 47.542 (8) | 5.943 | .991 | .033 | |||||
| Women | 5,057 | 124.997 (8) | 15.625 | .978 | .054 | |||||
| Multigroup analysis | ||||||||||
| Dimensional/configural | 172.538 (16) | 10.784 | .984 | .032 | ||||||
| Metric | 191.848 (22) | 19.310 | 6 | .004 | 8.720 | .983 | .001 | .028 | .004 | |
| Scalar | 393.776 (28) | 201.927 | 6 | <.001 | 14.063 | .962 | .021 | .037 | .009 | |
| Partial scalar1 | 262.914 (27) | 71.066 | 5 | <.001 | 9.738 | .976 | .007 | .030 | .002 | |
| Age group | ||||||||||
| 18-39 years | 512 | 30.288 (8) | 3.786 | .968 | .074 | |||||
| 40-49 years | 2,643 | 41.020 (8) | 5.127 | .990 | .040 | |||||
| 50-59 years | 2,255 | 47.165 (8) | 5.896 | .985 | .047 | |||||
| 60-69 years | 2,444 | 62.924 (8) | 7.866 | .975 | .053 | |||||
| ≥70 years | 1,814 | 75.471 (8) | 9.434 | .956 | .068 | |||||
| Multigroup analysis | ||||||||||
| Dimensional/configural | 256.899 (40) | 6.422 | .978 | .024 | ||||||
| Metric | 316.016 (64) | 59.117 | 24 | <.001 | 4.938 | .975 | .003 | .020 | .004 | |
| Scalar | 572.700 (88) | 256.684 | 24 | <.001 | 6.508 | .952 | .023 | .024 | .004 | |
| Partial scalar2 | 357.280 (80) | 41.264 | 16 | .001 | 4.466 | .973 | .002 | .019 | .001 | |
Note. df: degrees of freedom, CMIN/DF: minimum discrepancy, divided by its degrees of freedom, CFI: comparative fit index, RMSEA: root mean square error of approximation, 1 constraint of equal intercepts freed for item 6, 2 constraint of equal intercepts freed for items 5 and 6.
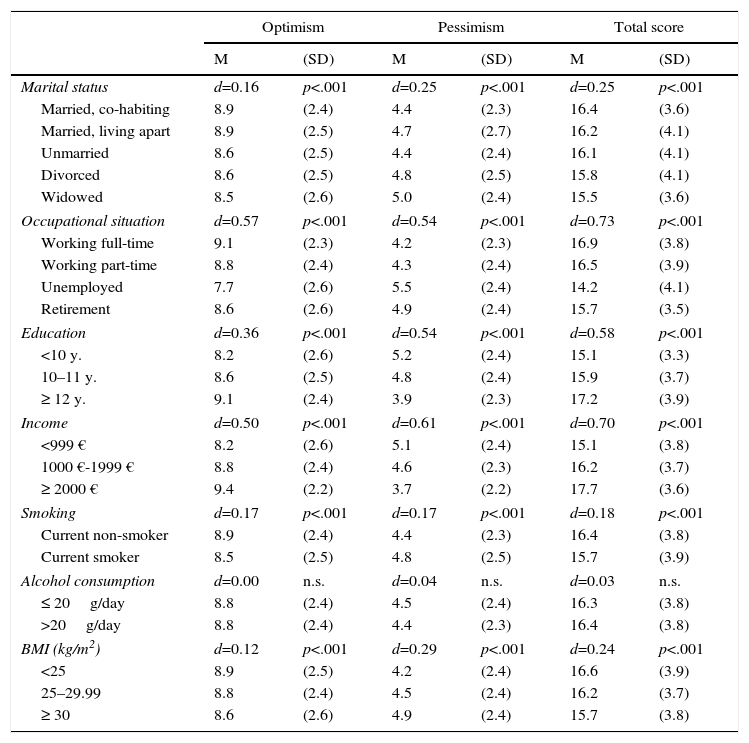
Low optimism (LOT-R total) scores were observed for people who were widowed (M=15.5), unemployed (M=14.2), had low levels of education (M=15.1), and had low income (M=15.1) (Table 6). The associations between the other factors (smoking, alcohol consumption and overweight) and optimism were lower; the influence of alcohol intake on optimism was negligible.
LOT-R mean scores, broken down by sociodemographic and behavioral factors.
| Optimism | Pessimism | Total score | ||||
|---|---|---|---|---|---|---|
| M | (SD) | M | (SD) | M | (SD) | |
| Marital status | d=0.16 | p<.001 | d=0.25 | p<.001 | d=0.25 | p<.001 |
| Married, co-habiting | 8.9 | (2.4) | 4.4 | (2.3) | 16.4 | (3.6) |
| Married, living apart | 8.9 | (2.5) | 4.7 | (2.7) | 16.2 | (4.1) |
| Unmarried | 8.6 | (2.5) | 4.4 | (2.4) | 16.1 | (4.1) |
| Divorced | 8.6 | (2.5) | 4.8 | (2.5) | 15.8 | (4.1) |
| Widowed | 8.5 | (2.6) | 5.0 | (2.4) | 15.5 | (3.6) |
| Occupational situation | d=0.57 | p<.001 | d=0.54 | p<.001 | d=0.73 | p<.001 |
| Working full-time | 9.1 | (2.3) | 4.2 | (2.3) | 16.9 | (3.8) |
| Working part-time | 8.8 | (2.4) | 4.3 | (2.4) | 16.5 | (3.9) |
| Unemployed | 7.7 | (2.6) | 5.5 | (2.4) | 14.2 | (4.1) |
| Retirement | 8.6 | (2.6) | 4.9 | (2.4) | 15.7 | (3.5) |
| Education | d=0.36 | p<.001 | d=0.54 | p<.001 | d=0.58 | p<.001 |
| <10 y. | 8.2 | (2.6) | 5.2 | (2.4) | 15.1 | (3.3) |
| 10–11 y. | 8.6 | (2.5) | 4.8 | (2.4) | 15.9 | (3.7) |
| ≥ 12 y. | 9.1 | (2.4) | 3.9 | (2.3) | 17.2 | (3.9) |
| Income | d=0.50 | p<.001 | d=0.61 | p<.001 | d=0.70 | p<.001 |
| <999 € | 8.2 | (2.6) | 5.1 | (2.4) | 15.1 | (3.8) |
| 1000 €-1999 € | 8.8 | (2.4) | 4.6 | (2.3) | 16.2 | (3.7) |
| ≥ 2000 € | 9.4 | (2.2) | 3.7 | (2.2) | 17.7 | (3.6) |
| Smoking | d=0.17 | p<.001 | d=0.17 | p<.001 | d=0.18 | p<.001 |
| Current non-smoker | 8.9 | (2.4) | 4.4 | (2.3) | 16.4 | (3.8) |
| Current smoker | 8.5 | (2.5) | 4.8 | (2.5) | 15.7 | (3.9) |
| Alcohol consumption | d=0.00 | n.s. | d=0.04 | n.s. | d=0.03 | n.s. |
| ≤ 20g/day | 8.8 | (2.4) | 4.5 | (2.4) | 16.3 | (3.8) |
| >20g/day | 8.8 | (2.4) | 4.4 | (2.3) | 16.4 | (3.8) |
| BMI (kg/m2) | d=0.12 | p<.001 | d=0.29 | p<.001 | d=0.24 | p<.001 |
| <25 | 8.9 | (2.5) | 4.2 | (2.4) | 16.6 | (3.9) |
| 25–29.99 | 8.8 | (2.4) | 4.5 | (2.4) | 16.2 | (3.7) |
| ≥ 30 | 8.6 | (2.6) | 4.9 | (2.4) | 15.7 | (3.8) |
Note. d: effect size for the comparison between categories with the lowest and highest mean scores; p: significance.
The first aim of this study was to test age and gender differences. As in previous studies, age differences were small in magnitude. Males were slightly less optimistic than females. Though the gender difference was statistically significant, the effect size of this difference was low (d=.12). Two previous German general population studies (Armbruster et al., 2015; Glaesmer et al., 2012) also found very small gender effects (d ≤ .07), and in a Colombian general population sample (Zenger et al., 2013) males were slightly more optimistic than females (d=.12 for the Total score). We also observed slight age differences; the older age groups reported less optimism than the younger ones. This was also in line with previous studies (Armbruster et al., 2015; Glaesmer et al., 2012; Zenger et al., 2013). The low occurrence of gender and age differences justifies reporting normative data for the whole population, without differentiating between age and gender groups.
Are optimism and pessimism independent variables? Most researchers reported only weak negative correlations between these subscales and concluded independency. In our total sample, the correlation was r=-.22, which is in line with other studies: r=-.12 (Zenger et al., 2013) and r=-.20 (Glaesmer et al., 2012). As in the most recent German study (Armbruster et al., 2015), the correlation between optimism and pessimism depends on the age of the subjects. Among young people, there was a clear negative correlation, while in the oldest group the correlation was even slightly positive. This is also in line with a strong negative correlation between the latent variables found in a Spanish sample of university students (Cano-García et al., 2015). One reason for the lack of a clear negative correlation between optimism and pessimism in the general population is the so-called acquiescence effect, a tendency to give affirmative answers to items irrespective of their content. This acquiescence or yes-set effect (Savalei & Falk, 2014) contributes to a small or inverse association of constructs which are theoretically in an opposite position. This acquiescence effect seems to be more pronounced in older people and in people with lower education levels. Whenever examinations use samples of students one must be aware that their response behavior differs from that of older and less educated people, a fact that limits the generalizability of those findings.
Regarding the dimensionality of the questionnaire, the two-factor model with correlated latent variables (Model 2) fit the data well, and the results are in line with those of a German and a Colombian representative sample (Glaesmer et al., 2012; Zenger et al., 2013) and other studies (Herzberg et al., 2006; Ribeiro, Pedro, & Marques, 2012). Therefore, the latent constructs of optimism and pessimism measured with the LOT-R can be seen as partially independent variables that are moderately correlated. Additionally, the (partial) invariance of the two-factor model across age and gender was confirmed. This is an important precondition in a statistical sense and allows for making meaningful comparisons between these subgroups.
Education, professional situation, and income were substantial predictors of optimism. Optimism was highest among well educated people with high income, working full-time. Several effect sizes were greater than .50, and, therefore, higher than those of the age or gender differences. It can be concluded that samples with students cannot be generalized to the whole general population. Unemployment was the factor most strongly associated with pessimism. In this context, it is also interesting to note that the effect sizes of the total scale are generally higher than those of the subscales optimism and pessimism. However, in contrast to the correlations with the other scales, the optimism subscale was not generally better than the pessimism subscale in terms of effect sizes between sociodemographic groups. There was no association between optimism and alcohol intake; and the association with cigarette smoking was statistically significant, but also weak in magnitude (d=.18 for the total score). Smokers were slightly less optimistic and more pessimistic than non-smokers. Perhaps this lack of optimism is one reason why it is difficult for those smokers to give up smoking.
Some limitations of this study should be mentioned. The response rate (33%) was low, and the sample is not representative of Germany, because it is based on a community sample. Nevertheless, the similarity of the LOT-R mean scores with those of a previous German sample (Glaesmer et al., 2012) indicates that there were no severe discrepancies in terms of mean scores. Due to the cross-sectional design of this study, we cannot derive causal relationships between optimism and associated factors such as obesity or employment status. Unemployed people might experience more pessimism, but it is also possible that pessimism causes behavior that leads to unemployment. Though this study cannot contribute to questions of causality, due to its large sample size it is useful in providing precise estimates of the strength of the associations.
Despite the limited representativeness, we believe that the mean scores presented in this study can be used as reference values whenever samples of patients are examined with the LOT-R. In many cases, this would be better than examining a small group of “normal” subjects as controls. Gender differences should be taken into account when making comparisons between several groups of patients. Taken together, the LOT-R proved to be a suitable instrument for the assessment of habitual optimism and pessimism.
FundingThis publication is supported by LIFE - Leipzig Research Centre for Civilization Diseases, an organizational unit affiliated to the Medical faculty of the University of Leipzig. LIFE is funded by means of the European Union, by the European Regional Development Fund (ERDF) and by funds of the Free State of Saxony within the excellence initiative (project numbers 713-241202, 14505/2470, 14575/2470). A. Hilbert was funded by the German Federal Ministry of Education and Research (grant 01EO1501).
We acknowledge support from the German Research Foundation (DFG) and Universität Leipzig within the program of Open Access Publishing.
