


Background/Objective: The purpose of this study was to assess psychometric properties of the Brief Symptom Inventory (BSI-18), evaluate the measurement invariance with respect to sex, age, and tumor location, and to analyze associations between social support and sociodemographic and clinical variables among individuals with resected, non-advanced cancer. Method: A confirmatory factor analysis was conducted to explore the dimensionality of the scale and test invariance across sex, age, and tumor localization in a prospective, multicenter cohort of 877 patients who completed the BSI-18 and Multidimensional Scale of Perceived Social Support (MSPSS). Results: The results show that 3-factor and 1-factor measurement models provided a good fit to the data; however, a three-factor, second-order model was deemed more appropriate and parsimonious in this population. Alpha coefficients ranged between .75 and .88. Test of measurement invariance showed strong invariance results for sex, age, and tumor location; strong invariance over time was likewise assumed. Less perceived social support appears to correlate with all BSI factors. Conclusions: The study confirmed the tridimensional structure of the BSI-18 and invariance across age, sex, and tumor localization. We recommend using this instrument to measure anxiety, depression, and somatization in epidemiological research and clinical practice.
Antecedentes/Objetivo: El propósito de este estudio fue evaluar las propiedades psicométricas del Brief Symptom Inventory (BSI-18), la invarianza con respecto al sexo, edad y localización del tumor, y analizar la asociación con el apoyo social y variables sociodemográficas y clínicas. Método: Se realizó un análisis factorial confirmatorio para explorar la dimensionalidad y se analizó la invarianza en función del sexo, edad y localización del tumor en una muestra prospectiva y multicéntrica de 877 pacientes que completaron el BSI-18 y la Multidimensional Scale of Perceived Social Support (MSPSS). Resultados: Tanto el modelo unifactorial como el trifactorial proporcionaron un buen ajuste a los datos; sin embargo, un modelo de segundo orden de tres factores se consideró más apropiado en esta población. Los coeficientes alfa oscilaron entre 0,75 y 0,88. Se halló una invarianza fuerte para sexo, edad y localización del tumor, y una fuerte invarianza en el tiempo. El apoyo social percibido se correlacionó negativamente con todos los factores BSI. Conclusiones: El estudio confirma la estructura tridimensional del BSI-18 y la invarianza en sexo, edad y localización del tumor. El instrumento puede recomendarse para evaluar la ansiedad, depresión y somatización en investigación epidemiológica y en la práctica clínica.
The diagnosis of cancer and multimodal therapy have been associated with increased risk of psychological distress and mental comorbidity (Bao et al., 2019; Jimenez-Fonseca et al., 2018). Approximately half of the oncology patients who initiate treatment with chemotherapy present anxiety and more than one-third display depression (Jimenez-Fonseca et al., 2018). Despite this, less than 10% of these people receive psychosocial treatment (Calderon et al., 2018). The failure to detect and treat high levels of psychological distress have been associated with lower adherence to treatment recommendations, less satisfaction with the care received, and worse quality of life (Kuba et al., 2019; Shin et al., 2017).
The Brief Symptom Inventory-18 (BSI-18) is one of the most widely used scales to appraise psychological distress (Derogatis, 2001). The BSI-18 is the shortest and most recent of the scales designed by Derogatis; its predecessors are the Symptom Checklist-90-Revised (SCL-90-R; 90 ítems; Derogatis, 1994) and the Brief Symptom Inventory (BSI; 53 items; Derogatis, 1993). The SCL-90-R and BSI contemplate nine dimensions of psychological distress versus the BSI-18 that explores three dimensions (6 items each) — Somatization, Depression, and Anxiety (Derogatis, 2001). According to Derogatis (2001), the BSI-18 has two main advantages over its predecessors: one is its brevity and is easy both to administer and to correct. Secondly, it has three symptom dimensions that are conceptual and empirically highly homogeneous; each one correlates closely with the sum total of all the items that constitute psychological distress (Abraham, Gruber-Baldini, Harrington, & Shulman, 2017; Galdón et al., 2008; Lancaster, McCrea, & Nelson, 2016).
Originally, the BSI-18 factorial structure was evaluated by means of a principal component analysis (PCA) based on a sample of 1,134 American workers (Derogatis, 2001). The PCA has exhibited a second-order factorial structure whereby the items on the questionnaire are weighed in three different factors: somatization, anxiety, and depression. The sum of all the items are weighted in a general factor of psychological distress (Derogatis, 2001). Several studies of the BSI-18 have validated its original three-dimensional structure design (Meijer, de Vries, & van Bruggen, 2011; Recklitis, Blackmon, & Chang, 2017; Wang et al., 2010; Wiesner et al., 2010). However, other authors have put forth an alternative 4-factor model (depression, somatization, agitation, and panic) (Andreu et al., 2008), as well as a 4-factor model, consisting of the original three dimensions plus suicidal ideation (Zabora et al., 2001). Despite this, support for this latter four factor model is weak, especially for suicidal ideation, given that it is based on a single item; the three factor model is therefore preferable (Recklitis et al., 2017). Finally, there are authors that have suggested that the BSI-18 examines a single dimension of general psychological distress (Meijer et al., 2011; Torres, Miller, & Moore, 2013).
Recently, the study of the scale’s factorial invariance has spawned interest, as it is important to be able to validly compare results from different individuals in clinical assessment, and across different groups (i.e., sex, age, or tumor). Testing the hypothesis of invariance enables intergroup comparisons to be made, yielding more easily interpretable outcomes versus those scenarios in which this premise is no examined. Thus far, only a handful of studies have looked at the matter of invariance based on certain variables such as sex and age (Li et al., 2018; von Brachel, Bieda, Margraf, & Hirschfeld, 2018; Wang et al., 2010; Wiesner et al., 2010), but not according to the tumor. Wiesner et al. (2010) used a mean and covariance structures (MACS) analysis to examine the BSI-18 in a sample of 4,711 mothers of fifth grade students. The authors concluded that among Latin women, the unifactorial solution was superior to the originally designed three-factor structure. Wang et al. (2010) investigated invariance in a study of Chinese adult drug users, and support the three-factor, second-order model over the unifactorial model, and indicate that the BSI-18’s factorial and metric structure is constant in all the study populations. Li et al. (2018) evaluated the factorial invariance of the BSI-18 in Chines sample, and concluded that the bifactorial model (somatization and depression) fit the data better and that it was also equivalent in both sexs. von Brachel et al. (2018) analyzed the longitudinal invariance of the BSI-18 in 1,081 patients undergoing psychotherapy, and concluded that the BSI-18 is better conceptualized as a four dimensional that exhibits a strict invariance of longitudinal.
In short, the study of the factorial structure and invariance of the BSI-18 yields disparate results and, to the best of our knowledge, no invariance studies have been conducted based on sex, age, and tumor type in a large sample of individuals with cancer. Therefore, the two initial objectives of the instrumental study (Carretero-Dios & Pérez, 2007; Ramos-Álvarez, Moreno-Fernández, Valdés-Conroy, & Catena, 2008) were: (1) to evaluate the factorial structure and psychometric properties of the BSI-18 in our population (cancer patients) and (2) to assess the measurement invariance of BSI-18 scores in groups defined by sex, age, and tumor site. Additionally, we appraised (3) the construct validity of the scores and (4) their sensitivity to treatment-induced change among subjects with resected, non-advanced cancer.
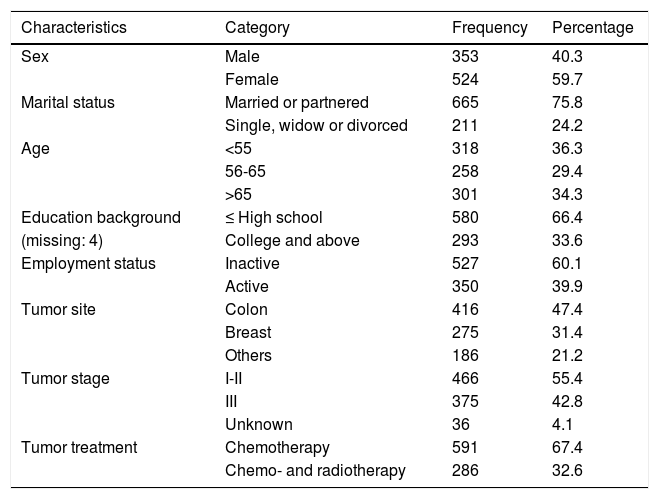
MethodParticipantsSocio-demographic and clinical characteristics are presented in Table 1. The sample comprised 877 patients with a mean age of 36 years (SD = 13.4, range 25-84); 59.7% the participants were female. Most were married or partnered (75.8%) and had a primary level of education (66.4%). As for place of residence, 40.5% of the participants live in a large city (>100,000 inhabitants); 26.6%, in a medium-sized city (10,000-100,000), and 32.8%, in a small-sized city (<10,000). As for clinical characteristics, the most frequent cancer types were colon (47.4%) and breast (31.4%), stage I-II (55.4%).
Sample demographic and clinical characteristics (N=877).
| Characteristics | Category | Frequency | Percentage |
|---|---|---|---|
| Sex | Male | 353 | 40.3 |
| Female | 524 | 59.7 | |
| Marital status | Married or partnered | 665 | 75.8 |
| Single, widow or divorced | 211 | 24.2 | |
| Age | <55 | 318 | 36.3 |
| 56-65 | 258 | 29.4 | |
| >65 | 301 | 34.3 | |
| Education background | ≤ High school | 580 | 66.4 |
| (missing: 4) | College and above | 293 | 33.6 |
| Employment status | Inactive | 527 | 60.1 |
| Active | 350 | 39.9 | |
| Tumor site | Colon | 416 | 47.4 |
| Breast | 275 | 31.4 | |
| Others | 186 | 21.2 | |
| Tumor stage | I-II | 466 | 55.4 |
| III | 375 | 42.8 | |
| Unknown | 36 | 4.1 | |
| Tumor treatment | Chemotherapy | 591 | 67.4 |
| Chemo- and radiotherapy | 286 | 32.6 |
Thirty-one physicians participated in this study; 80.6% (n = 25) were female; mean age was 36.8 years (SD = 8.3, range 28-62 years), with 12.7 years of experience (SD = 8.1, range 4-37 years). No significant differences were detected between male and female oncologists with respect to age (t = 0.32, p=.749) or years of experience (t = 0.31, p = .756). Most were super-specialists (71%) and worked at a public center.
InstrumentsBrief Symptom Inventory (BSI-18; Derogatis, 2001) includes 18 items divides into three dimensions (Somatization, Depression, and Anxiety) and the total score, the Global Severity Index (GSI) to assess general psychological distress in clinical and community populations (Appendix 1). Respondents were asked to answer in relation to how they had felt over the last 7 days and each item was rated on a 5-point Likert scale from 0 (not at all) to 4 (extremely). Raw scores are converted to standardized T scores which are characterized by a distribution with a mean of 50 and standard deviation (SD) of 10. According to the cutoff recommended by Derogatis (2001), a T-score ≥63 was used as indicative of caseness. In this study, Cronbach’s alpha was .75-.88.
Multidimensional Scale of Perceived Social Support (MSPSS; Zimet, Powell, Farley, Werkman, & Berkoff, 1990) is a 12-item, self-report scale that measures perceptions and adequacy of social support from three sources: family, friends, and significant others. The total score reflected the total degree of social support that individuals received. Items are scored on a 7-point Likert scale and total scores range from 7 to 84, with higher scores indicating greater perceived support. In this study, Cronbach’s alpha for the scale was .89.
Demographic survey. The following data were obtained: age, sex, marital status, educational level, occupational field, tumor site, stage, and treatment. The oncologist-related variables were sex, age, years of experience, type of medical oncologist (generalist vs. specialized), and type of hospital (academic vs. non-academic).
ProcedureNEOcoping is a national, multicenter, cross-sectional, prospective study of the Continuous Care Group of the Spanish Society of Medical Oncology (SEOM) conducted between July 2015 and February 2019 in 15 Medical Oncology departments in Spain, from 10 autonomous communities. The protocol was approved by the Ethics Committee of each hospital and by the Spanish Agency for Medicines and Medical Devices (AEMPS) and all participants signed informed consent forms prior to inclusion. The study consists of self-report scales that the patients completed at the beginning and end of adjuvant treatment. Each questionnaire contained written instructions and specified that completion was voluntary and anonymous. Patients completed all pre-treatment questionnaires during the week following their first visit to the Medical Oncology Department to decide on adjuvant treatment.
The population consisted of consecutive patients with histologically confirmed, non-advanced, surgically-treated breast and colorectal cancer for which international clinical guidelines considered adjuvant treatment to be an option. Patients were excluded if they were under 18 years of age, had been treated with preoperative radio-or chemotherapy, only hormone therapy, or adjuvant radiotherapy without chemotherapy, and if they had any serious mental illness that prevented them from understanding the study. We screened 1,003 patients; 877 were eligible for this analysis and 126 were excluded.
Data analysisData analyses were conducted in five stages. In the first stage, basic sample and item descriptive statistics were obtained. In the second stage, the dimensionality of the BSI-18 item scores was assessed using exploratory factor analyses (EFAs) and a multifaceted approach (detailed below). Given that a clear, interpretable solution was attained at this stage, multiple-group confirmatory factor analyses (CFAs) were then performed and factorial invariance was assessed in groups determined by sex, age, and tumor site. In the fourth stage, validity relations were appraised via (a) product-moment correlations between BSI-18 raw scale scores and MPSSS scores (practical validity) and (b) a structural equation model, in which the CFA was extended to include MPSS scores (theoretical validity). Finally, mean pre-/post-treatment changes were assessed by means of a two-wave structural model.
Descriptive statistics at the first stage were obtained with the SPSS v23. Second stage EFAs were performed with the FACTOR program (Ferrando & Lorenzo-Seva, 2017; Lorenzo-Seva & Ferrando, 2013) and dimensionality was assessed with (a) conventional goodness-of-fit indices; (b) measures of appropriateness and essential unidimensionality, and (c) added-value analyses. The estimation procedure for all EFAs was robust, unweighted least squares with second-order (mean and variance) corrections (ULS-MV). The indices selected in were (a) the Standardized root-mean-square residual (SRMS) and the root-mean-square error of approximation (RMSEA), as measures of relative fit, and the CFI index as a measure of comparative fit with respect to the null independence model. Measures in (b) consisted of: the H index, which assesses the strength and replicability of the solution; the explained common variance (ECV) index, which determines closeness to unidimensionality, optimal implementation of parallel analysis (PA) (Timmerman & Lorenzo-Seva, 2011), and Schwarz’s Bayesian Information Criterion (BIC). Finally, added-value analyses (Ferrando & Lorenzo-Seva, 2019) assess the extent to which scores on a given factor are better predicted from the score estimates based on this factor than from the score estimates based on the overall single factor.
Multiple group CFAs were fitted using robust, weighted least squares estimation with second-order (mean and variance) corrections (WLS-MV), as implemented in Mplus (Muthén & Muthén, 2012). Model fit and appropriateness were explored with RMSEA and CFI. As for reference values, CFI values ≥.95 are indicative of good model fit (Schermelleh-Engel, Moosbrugger, & Müller, 2003), whereas RMSEA values ≤.06 indicate a satisfactory fit (Hair, Black, & Babin, 2010).
The property of measurement invariance (MI) appraised at this stage indicates that the BSI items measure the same dimensions with the same structure in all the groups to be compared. This property is a prerequisite if BSI scores are to be validly interpreted and compared. Various MI levels can be obtained; likewise, there is considerable debate regarding the appropriate level for a clinical instrument such as the BSI. Our position is that strong invariance is an attainable goal that, if achieved, sufficed to establish valid comparisons both at the individual and at the mean-group level (Millsap & Meredith, 2007). Therefore, provided that strong invariance is obtained, the mean differences sex-, age-, and tumor site-defined groups were assessed at this third, CFA stage.
The CFA model of stage 3, extended so as to include the MPSS scores as external variables, was the structural model used to evaluated validity relations at the fourth stage. The model was fitted and model-data fit was gauged using the same procedures detailed above for the third-stage analyses. Finally, the two-wave model to appraise sensitivity to post-treatment change was strongly-invariant over time; likewise, it was fitted and assessed by means of the same procedures described in the third-stage analyses.
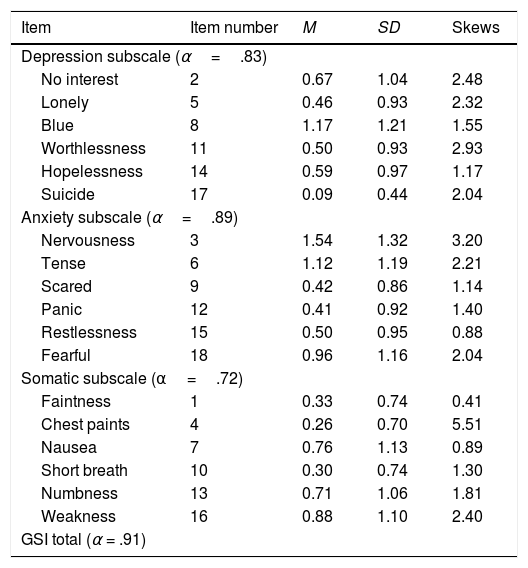
ResultsDescriptive statistics for BSI itemsDescriptive statistics of the eighteen BSI items can be found in Table 2. Mean item scores ranged from 0.09 (item 17) to 1.54 (item 3). BSI-18 item score distributions were unimodal and asymmetrical (positively skewed), thereby indicating that most of the values were concentrated at the lowest end of the response scale. Cronbach’s alpha estimates for raw test scores ranged from .75 to .88, which are similar to those reported in a community cancer sample (Galdón et al., 2008; Recklitis et al., 2017) that varied from .75 to .88 in adult survivors of childhood cancer (Recklitis et al., 2017) and .62-.70 in a Spanish breast cancer sample (Galdón et al., 2008).
Summary Statistics for the BSI-18 items by subscale, and skewness.
| Item | Item number | M | SD | Skews |
|---|---|---|---|---|
| Depression subscale (α=.83) | ||||
| No interest | 2 | 0.67 | 1.04 | 2.48 |
| Lonely | 5 | 0.46 | 0.93 | 2.32 |
| Blue | 8 | 1.17 | 1.21 | 1.55 |
| Worthlessness | 11 | 0.50 | 0.93 | 2.93 |
| Hopelessness | 14 | 0.59 | 0.97 | 1.17 |
| Suicide | 17 | 0.09 | 0.44 | 2.04 |
| Anxiety subscale (α=.89) | ||||
| Nervousness | 3 | 1.54 | 1.32 | 3.20 |
| Tense | 6 | 1.12 | 1.19 | 2.21 |
| Scared | 9 | 0.42 | 0.86 | 1.14 |
| Panic | 12 | 0.41 | 0.92 | 1.40 |
| Restlessness | 15 | 0.50 | 0.95 | 0.88 |
| Fearful | 18 | 0.96 | 1.16 | 2.04 |
| Somatic subscale (α=.72) | ||||
| Faintness | 1 | 0.33 | 0.74 | 0.41 |
| Chest paints | 4 | 0.26 | 0.70 | 5.51 |
| Nausea | 7 | 0.76 | 1.13 | 0.89 |
| Short breath | 10 | 0.30 | 0.74 | 1.30 |
| Numbness | 13 | 0.71 | 1.06 | 1.81 |
| Weakness | 16 | 0.88 | 1.10 | 2.40 |
| GSI total (α = .91) | ||||
Note. BSI-18=Brief symptom Inventory-18; GSI=Global Severity Index. All correlations were significant at p<.05.
Taking into account the descriptive results summarized above (skewed item scores), as well as the fact that the test is not very long and the sample is reasonably large, the best model choice to fit the data is nonlinear underlying-variables-approach FA (UVA-FA e.g. [Muthén & Muthén,2004]). In this modeling, the item scores are treated as ordered-categorical variables and the EFA is fitted to the inter-item polychoric correlation matrix (Ferrando & Lorenzo-Seva, 2014). As preliminary analyses, sampling adequacy was assessed by the KMO and Bartlett’s sphericity test and was considered to be very good.
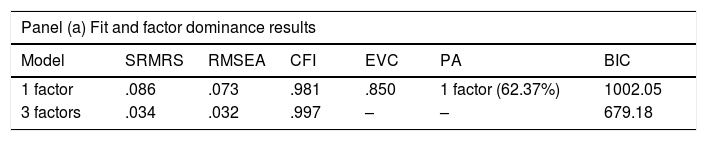
In accordance with previous studies, models containing between 1 and 3 factors were fitted to the data. The 4-factor solution was not attempted because the fit of the 3-factor model was too good. Double cross-validations based on random, fully independent sub-samples were made for the EFA solutions, and the across-samples results were virtually identical in all cases (coefficients of congruence were always above .96). So, only the results based on the entire sample are reported. Results for the unidimensional and the 3-factor solution are located in the upper panel of Table 3.
Dimensional assessment using exploratory factor analysis.
| Panel (a) Fit and factor dominance results | ||||||
|---|---|---|---|---|---|---|
| Model | SRMRS | RMSEA | CFI | EVC | PA | BIC |
| 1 factor | .086 | .073 | .981 | .850 | 1 factor (62.37%) | 1002.05 |
| 3 factors | .034 | .032 | .997 | – | – | 679.18 |
| Panel (b) Added-value and quality of the solutions results | ||||
|---|---|---|---|---|
| Added-value | H-index/marginal reliability(EAP scores) | Alpha reliability (raw scores) | Ordinal alpha | |
| General factor | -- | .955 | .90 | .93 |
| Depression factor | .925 (.487) | .919 | ||
| Anxiety factor | .952 (.572) | .952 | ||
| Somatization factor | .847 (.278) | .850 | ||
Note: SMRS=Standardized Root Mean Squared Residual; RMSEA=Root Mean Square Error of Approximation; CFI=Comparative Fit Index; ECV=Explained common variance; PA: Parallel Analysis; BIC: Bayesian Information Criterion; Added-Value results=first value: mean squared error reduction when predicting from the corresponding factor, second value within brackets: mean squared error reduction when predicting from the general factor.
As a summary, the unidimensional model has only a marginally acceptable fit in pure goodness-of-fit terms, whereas the fit of the 3-factor model is excellent by all the standards. However, the ECV value suggests that there is a strong dominant factor running through all the 18 items, and the PA-based procedure indicates the unidimensional solution as the most replicable. In contrast, the BIC results point to the 3-factor solution as being preferable.
To obtain further information in order to decide which dimensionality was most appropriate, the solution in three factors was next rotated to achieve maximum factor simplicity by using the Promin criterion (Lorenzo-Seva, 1999). The rotated pattern closely approached a simple structure (Bentler’s simplicity index was .98) and allocated all the items in the ‘a priori’ expected structure. Only two items: 8 (feeling blue) and 14 (hopelessness about the future) were found to be factorially complex and loaded on both the depression and anxiety factors.
The lower panel of Table 3 displays further measures aimed at comparing the unidimensional solution with the Promin rotated solution in three factors. Clearly, the rotated solution univocally demonstrates added value, because for all three factors, the true factor scores are better predicted from the corresponding estimates than from the score estimates in the single general factor (results in brackets). The panel also displays the reliability estimates for the factor scores derived from the solutions, as well as the alpha estimates for the raw total scale scores. The ordinal alpha estimate (Zumbo, Gadermann, & Zeisser, 2007) has been also included as theoretical upper limit for the reliability of the total scores.
The results summarized so far, suggest that the best solution for the BSI-18 in this population is a second-order solution, with 3 strongly related primary factors that are clear, meaningful, replicable, and lead to reliable scores, as well as a general second-order factor that runs throughout all the items and that can be understood as “psychological distress.” This general factor is also strong and replicable, and provides reliable scores: both factor score estimates and the simpler sum scores can be considered to be reliable enough to be used in clinical assessment. This general schema leads to the CFA solutions used in the next stage.
CFAs and measurement of invarianceFor the same reasons detailed above, and also for consistency in the procedures, all the structural models that follow (CFAs, extended validity model, and two-wave model) used the same UVA strategy as the EFA models in the previous section: variables were treated as ordered-categorical, and robust statistics based on mean-and-variance corrections were used for assessing model-data fit.
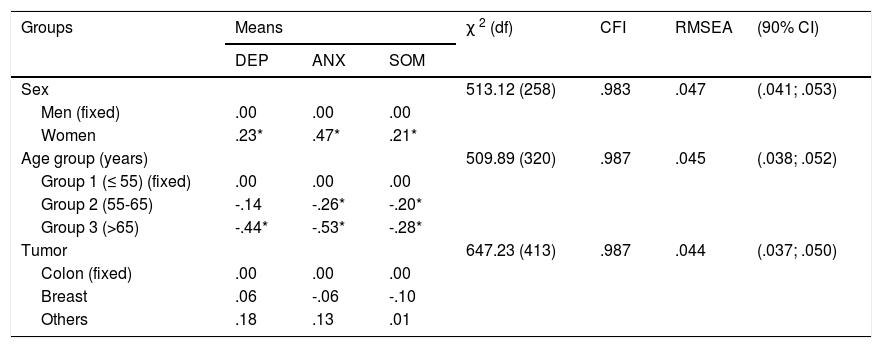
Based on the EFA results in the previous section, a second-order CFA model with three primary factors was fitted by using again a cross-validation schema based on independent random samples. Across-sample results of the proposed model were virtually the same in terms of both, parameter estimates, and goodness-of-fit measures. So, it is justified to consider a common solution, that, in principle, holds for the entire sample. The second-order loadings estimated in the full sample were: Depression=.98; Anxiety=.84; Somatic=.69. Based on this common solution, strong invariance assessments were next carried out. Table 4 shows the strong invariance results for sex, age, and tumor location. In all cases, the strong-invariance model based on the second-order solution has a remarkably good fit based on all the indices considered.
Results of the strong invariance model for sex, age, and tumor site.
| Groups | Means | χ 2 (df) | CFI | RMSEA | (90% CI) | ||
|---|---|---|---|---|---|---|---|
| DEP | ANX | SOM | |||||
| Sex | 513.12 (258) | .983 | .047 | (.041; .053) | |||
| Men (fixed) | .00 | .00 | .00 | ||||
| Women | .23* | .47* | .21* | ||||
| Age group (years) | 509.89 (320) | .987 | .045 | (.038; .052) | |||
| Group 1 (≤ 55) (fixed) | .00 | .00 | .00 | ||||
| Group 2 (55-65) | -.14 | -.26* | -.20* | ||||
| Group 3 (>65) | -.44* | -.53* | -.28* | ||||
| Tumor | 647.23 (413) | .987 | .044 | (.037; .050) | |||
| Colon (fixed) | .00 | .00 | .00 | ||||
| Breast | .06 | -.06 | -.10 | ||||
| Others | .18 | .13 | .01 | ||||
Note: SD = Standard Deviation; CFI=Comparative Fit Index; SMRS=Standardized Root Mean Squared Residual; RMSEA=Root Mean Square Error of Approximation; *=significantly different from zero at the .05 level (two-tailed).
As discussed above, if measurement invariance is achieved, it can be assumed that the same dimensions are measured in the different groups and that the items function in the same way in these groups. Therefore, differences in group mean scores can be validly interpreted as reflecting ‘true’ group differences in the dimensions being measured. So as to interpret the mean differences in Table 4, we note that, for identification purposes, the means are always fixed to zero in the first group and are freely estimated in the remaining. Results can be summarized as follows: no mean differences in any of the primary factors were obtained for tumor location. Finally, and as regards age groups, the results clearly suggest that the levels in all three factors tend to decrease with age.
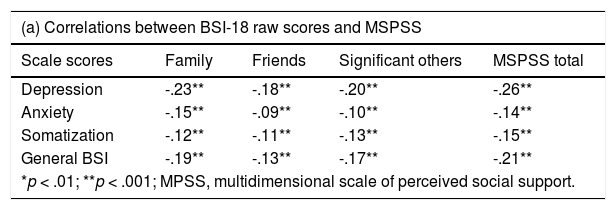
Convergent validity and assessment of changeValidity results in Table 5 can be summarized as follows. First, the profile of raw validity coefficients in panel (a) and standardized coefficients in panel (b) is virtually the same, which is expected. However, the disattenuated standardized coefficients are higher in all cases, as they should be, and the differences are more pronounced, thereby making the pattern in (b) more easily interpreted. Second, the structural model has quite an acceptable fit.
Validity assessment.
| (a) Correlations between BSI-18 raw scores and MSPSS | ||||
|---|---|---|---|---|
| Scale scores | Family | Friends | Significant others | MSPSS total |
| Depression | -.23** | -.18** | -.20** | -.26** |
| Anxiety | -.15** | -.09** | -.10** | -.14** |
| Somatization | -.12** | -.11** | -.13** | -.15** |
| General BSI | -.19** | -.13** | -.17** | -.21** |
| *p < .01; **p < .001; MPSS, multidimensional scale of perceived social support. | ||||
| (b) Structural standardized validity coefficients between the BSI-18 factors and MSPSS | ||||
|---|---|---|---|---|
| Factor | Family | Friends | Significant others | MSPSS total |
| Depression | -.31** | -.26** | -.28** | -.36** |
| Anxiety | -.15** | -.11** | -.10** | -.15** |
| Somatization | -.14** | -.13** | -.15** | -.18** |
| General BSI | -.25** | -.19** | -.20** | -.27** |
| *p < .01; **p < .001; MPSS, multidimensional scale of perceived social support. | ||||
| (c) Goodness-of-fit results for the structural validity model | |||
|---|---|---|---|
| χ2 (df) | CFI | RMSEA | (90% CI) |
| 539.62 (190) | .978 | .046 | (.041; .051) |
As for the substantive results, the Depression factor is, clearly, the one that most strongly and negatively correlated with the MSPSS scales. Somatization and Anxiety correlate significantly in all cases, albeit effect sizes are small. Finally, the relations revealed with respect to the general factor might well be due to the fact that it mostly reflects depression. Overall, then, less perceived social support appears to be associated with all BSI factors, but especially with Depression.
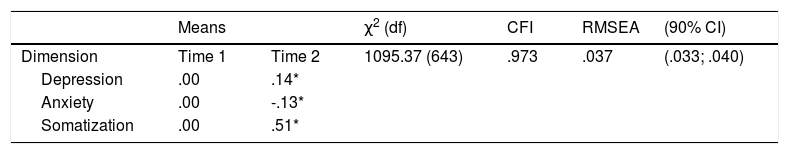
Table 6 presents the results for the two-wave longitudinal model. The constraints here were similar to those in the previous multiple-group analyses but were imposed over time instead of over groups. Thus, strong invariance over time was assumed and the mean of each dimension at Time 1 was set to zero. Results can be summarized as follows. First, the models exhibited fairly acceptable. Second, significant pre-test post-test changes were observed for the three dimensions: a mean increase in Depression and Somatization and a mean decrease in anxiety. In terms of effect sizes (Cohen’s d), the Depression and Anxiety effects would be qualified as small, whereas the somatization effect is more substantial and would qualify as medium.
Results of the two-wave model for assessing change.
| Means | χ2 (df) | CFI | RMSEA | (90% CI) | ||
|---|---|---|---|---|---|---|
| Dimension | Time 1 | Time 2 | 1095.37 (643) | .973 | .037 | (.033; .040) |
| Depression | .00 | .14* | ||||
| Anxiety | .00 | -.13* | ||||
| Somatization | .00 | .51* | ||||
Note: SD = Standard Deviation; CFI=Comparative Fit Index; RMSEA=Root Mean Square Error of Approximation; * = significantly different from zero at the .05 level (two-tailed).
The present study examines the BSI-18’s (Derogatis, 2001) factorial structure, invariance, and sensitivity to pre-/post-treatment change in a sample of adults with resected, non-metastatic cancer. The second-order model with three primary factors that fit the original proposed structure was the one that best fit the data in this study. The invariance study indicates that the BSI-18 was equivalent for both men and women, age, and tumor site. The longitudinal study results demonstrate that the scale was sensitive to the change.
Our results reveal that the BSI-18’s second-order model with three primary factors (Depression, Anxiety and Somatization) and its unifactorial model display good fit to the data. In line with the results achieved by the original author (Derogatis, 2001) and in various studies with individuals with cancer (Galdón et al., 2008; Recklitis et al., 2017), our results suggest that the individual subscales offer useful information for the clinician in this population and the BSI-18’s single dimension can contribute to evaluating psychological distress in general.
In addition, this study also analyzed the scale’s invariance on the basis of sex, age, and tumor location, using multi-group CFA models. The results demonstrate that there is no differential functioning of the BSI-18 items according to sex and, therefore, the test’s structure is equivalent in both men and women. These results are similar to those reported by several groups (Li et al., 2018; Torres et al., 2013). The results suggest that both males and females with cancer share a common understanding of the psychological distress evaluated by the BSI-18, despite the differences found in our study in that the women with cancer in our sample report higher levels of Depression, Anxiety, and Somatization than the men, similar to those detected in earlier studies (Chao et al., 2019; Jimenez-Fonseca et al., 2018).
Most items were also interpreted equivalently across tumor-site and age-defined groups. This is the first study to examine invariance based on tumor site and age. No differences were found in the means of any of the primary factors for tumor location, although the same cannot be said of age. The results indicate that the levels on all three factors tend to decrease with age. Several factors might account for these differences. Older patients have more friends and/or relatives that have gone through the same situation; consequently, there is less uncertainty. This patient group also tends to have fewer work and/or family responsibilities, which increase the stress derived from what they are experiencing.
The internal, single-wave results discussed so far, suggests that the BSI-18 can be a very useful instrument for clinical assessment in the population of interest. The invariance results suggest that the BSI-18 scores measure the same dimensions and with the same scale in the sub-groups considered, which implies that the trait estimates of individuals are comparable regardless of their sex, age, or type of tumor. Furthermore, the scores are not only invariant, but highly reliable also, which implies that accurate measurements can be made at the individual level.
As for construct validity, the Depression factor was the strongest and correlated negatively with social support. Anxiety and Somatization were also negatively associated with social support, albeit with a smaller effect size. Studies in the field of health have found that social support is an important indicator of an individual’s mental health status (Bao et al., 2019; Hill & Hamm, 2019). In our sample, Depression was the dimension that exhibited the strongest negative correlations; in keeping with earlier studies, our results also suggest that low levels of social support can aggravate symptoms of depression in oncological patients (Bao et al., 2019).
The results for the two-wave longitudinal model shed light on the change at six months on the three factors of the BSI-18 in cancer patients after receiving chemotherapy. Our results indicate that there was increased in Depression and Somatization and slight decrease in anxiety at 6 months post-treatment. This might be attributable to the effects of the chemotherapy administered and a variety of side effects it may have caused, such as nausea, vomiting, pain, hair loss, fatigue, etc., that can impact patients’ low mood and increase physical symptoms. In contrast, Anxiety was slightly lower following treatment versus at the beginning. Several different reasons can account for this: when initiating treatment, patients confront a life-threatening medical situation; they must get accustomed to the hospital setting and frequent testing and doctors’ visits; there is uncertainty between one test and the next or between treatment cycles that cause them to be more vigilant. With time and as the person grows accustomed to this atmosphere and many doubts surrounding treatment and its repercussions are cleared up, anxiety may abate somewhat.
This study has a series of limitations. First, the sample is heterogenous, to enable tumor site-based subgroup analyses to be conducted. Second, the results of our study might not necessarily be extrapolated to individuals with advanced tumors, whose clinical status and prognosis differ markedly. Finally, we must be cautious when interpreting these results, bearing in mind that all the subjects eligible to participate did so voluntarily, which may have introduced a self-selection bias. Likewise, a clinically relevant limitation is the absence of appropriately matched comparison samples to assess psychological status.
The strengths of this study include its prospective design, the application of widely validated and reliable measures, as well as a large sample of oncological patients with non-advanced, resected cancer from hospitals all over Spain.
FundingThis work was funded by the Spanish Society of Medical Oncology (SEOM) in 2015.
Below is a list of problems people sometimes have. Read each one carefully and indicate the number that best describes how much that problem has distressed or bothered you during the past 7 days including today.
- 1
Faintness or dizziness
- 2
Feeling no interest in things
- 3
Nervousness or shakiness inside
- 4
Pains in heart or chest
- 5
Feeling lonely
- 6
Feeling tense or keyed up
- 7
Nausea or upset stomach
- 8
Feeling blue
- 9
Suddenly scared for no reason
- 10
Trouble getting your breath
- 11
Feelings of worthlessness
- 12
Spells of terror or panic
- 13
Numbness or tingling in parts of your body
- 14
Feeling hopeless about the future
- 15
Feeling so restless you couldn’t sit still
- 16
Feeling weak in parts of your body
- 17
Thoughts of ending your life
- 18
Feeling fearful
The format of a five-point Likert scale from 0 (not at all) to 4 (extremely).
