


The impact of science on today's society has been defined as the most important cultural and social phenomenon of the last few centuries.1
Contributions to knowledge in the field of science are often only recognized if they are published in a scientific journal, and therefore the scientific capacity of a country is usually evaluated in terms of the quantity and quality of its publications. In recent years, the analysis of patents as indicators of innovation and technological capacity has slowly emerged from among the traditional indicators. Patent analysis is highly important in the field of competitive intelligence, as it makes technological information that otherwise would not be publicized available to all researchers.2 Patent documents provide information often not easily detected in the specialized literature.
These analyses are useful in innovation, technology transfer and industrial competitiveness, as well as to encourage investment in innovation and provide a basis for negotiating intellectual property assets.3 However, scientometric patent studies are scarce and limited, especially relating to the analysis of specific areas of knowledge.4
Scientists and technologists differ in how they inform the scientific community of progress.5 Scientists publish journal articles by the direct relationship between the publication and institutional recognition, even though sometimes the information is already known. Personal promotion is a compelling force in obliging the scientist to publish. Technologists, however, are less concerned about scientific publication; their interest is in patenting.6 Nevertheless, the interests of scientists are changing because it is increasingly difficult to obtain public subsidies.
Between 2004 and 2011, the field of Immunology had an average citation rate for papers published, of 22.56, in second place behind the field of Molecular Biology and Genetics, with an average of 25.68.7 Data for the average citation rates are given for the last 10 years. This paper aims to ascertain the situation of Spanish Immunology in the context of patents.
Materials and methodsThe patents published in the area of Immunology were obtained from the database SCOPUS (Elsevier BV Scopus™).
The documents of patents that are recovered from SCOPUS are web links of the documents of patents of the database of ESPACENET-WIPO.
The analysis of patents filed between 2004 and 2011 was carried out using Patent Cooperation Treaty (PCT) of World Intellectual Property Organization (WIPO) as the data source. Each year's patents were obtained in February of the following year.
All the patents were classified according to the International Patent Classification (IPC). We used the eighth version 2008.04.8 Also we used the Classification of Technological Classes, which give precedence to application over function, since the IPC gives priority to function over application.9
Applicants were analyzed by economic sectors: Private entities, universities, hospitals or public research organizations (PROs) and Individuals.
The World Economic Forum (WEF)10 publishes more than 100 items for comparison between countries, in order to identify areas in which a country has strengths and weaknesses in competitiveness. We used those items that may have an important relationship with patent applications in Immunology.
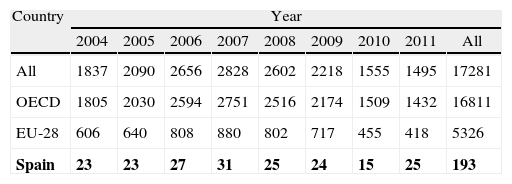
ResultsFrom 2004 to 2011, 89 countries applied for a total of 17,281 patents in Immunology. The highest number of applications was in 2007, since when they have decreased. The Organization for Economic Co-operation and Development (OECD) countries filed 97.28% of all patents, the European Union (EU) 30.76%, and Spain requested 193, ranking 16th, with 1.11% of all patents (Table 1).
Patents immunology, in requested via the PCT-WIPO (2004–2011).
| Country | Year | ||||||||
| 2004 | 2005 | 2006 | 2007 | 2008 | 2009 | 2010 | 2011 | All | |
| All | 1837 | 2090 | 2656 | 2828 | 2602 | 2218 | 1555 | 1495 | 17281 |
| OECD | 1805 | 2030 | 2594 | 2751 | 2516 | 2174 | 1509 | 1432 | 16811 |
| EU-28 | 606 | 640 | 808 | 880 | 802 | 717 | 455 | 418 | 5326 |
| Spain | 23 | 23 | 27 | 31 | 25 | 24 | 15 | 25 | 193 |
The decrease since 2007 was seen in almost all countries, with the exception of China, although the number of applications was very low, just 178 (0.84% of total).
Patent applications from a single applicant country accounted for 79.27% of requests, the majority, 61.64%, from the United States.
Spain applied for 87 patents jointly with other countries, yielding an average internationalization level of 45.07%. Spain filed jointly with 15 OECD countries, filing 44 applications with the United States, 23 with United Kingdom, 17 with Switzerland, 13 with France, 6 with Germany, 4 with Netherlands, 3 with Australia, Austria, Chile, Denmark and Sweden; 2 with Canada, Ireland and Italy; and 1 with Portugal.
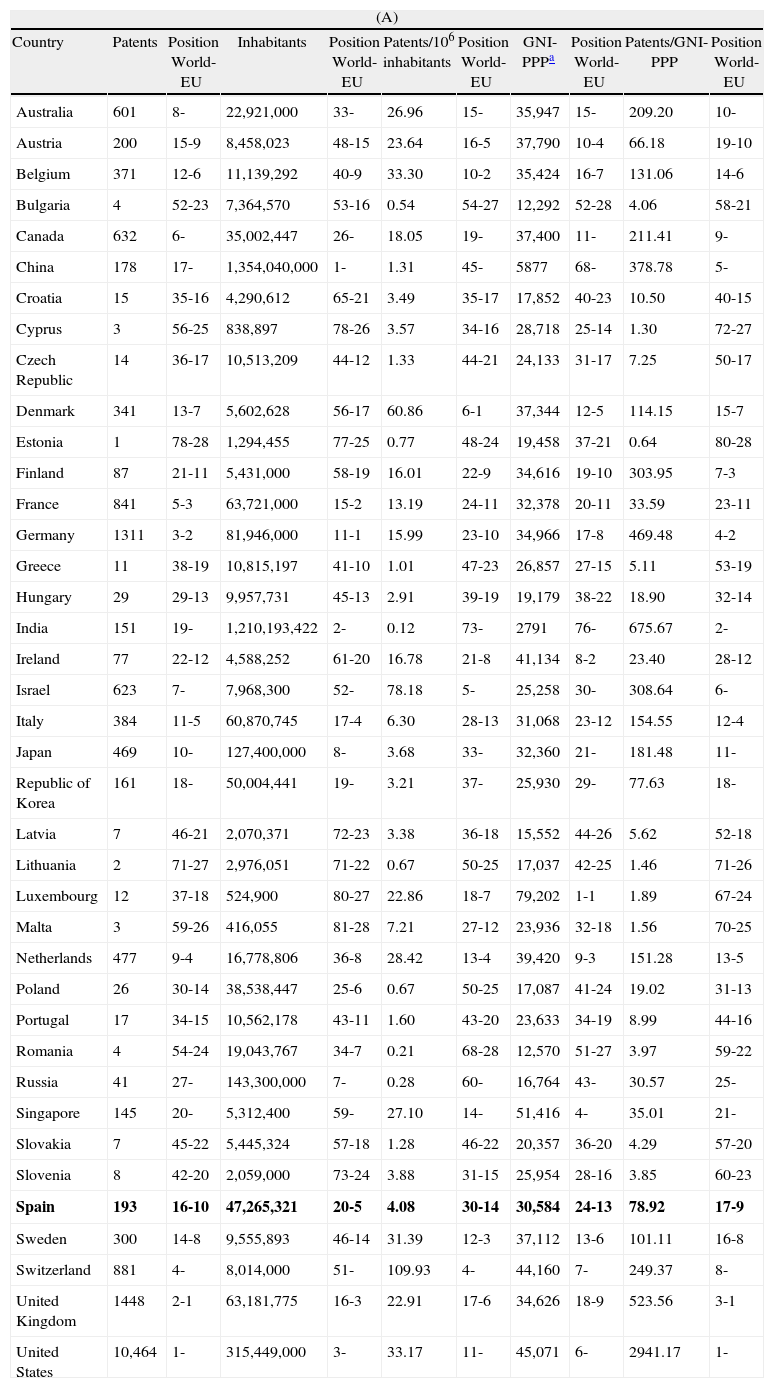
By number of inhabitants, Spain ranked 20th of the 89 countries studied and the 5th in the EU (countries). However, when analyzing patents per population, Spain dropped to 30th place of world and 14th in the EU. Comparatively, this ratio is eight times lower in Spain than in the United States, and almost 4 times lower than Germany (Table 2A).
Relative positions of EU and several important countries.
| (A) | ||||||||||
| Country | Patents | Position World-EU | Inhabitants | Position World-EU | Patents/106 inhabitants | Position World-EU | GNI-PPPa | Position World-EU | Patents/GNI-PPP | Position World-EU |
| Australia | 601 | 8- | 22,921,000 | 33- | 26.96 | 15- | 35,947 | 15- | 209.20 | 10- |
| Austria | 200 | 15-9 | 8,458,023 | 48-15 | 23.64 | 16-5 | 37,790 | 10-4 | 66.18 | 19-10 |
| Belgium | 371 | 12-6 | 11,139,292 | 40-9 | 33.30 | 10-2 | 35,424 | 16-7 | 131.06 | 14-6 |
| Bulgaria | 4 | 52-23 | 7,364,570 | 53-16 | 0.54 | 54-27 | 12,292 | 52-28 | 4.06 | 58-21 |
| Canada | 632 | 6- | 35,002,447 | 26- | 18.05 | 19- | 37,400 | 11- | 211.41 | 9- |
| China | 178 | 17- | 1,354,040,000 | 1- | 1.31 | 45- | 5877 | 68- | 378.78 | 5- |
| Croatia | 15 | 35-16 | 4,290,612 | 65-21 | 3.49 | 35-17 | 17,852 | 40-23 | 10.50 | 40-15 |
| Cyprus | 3 | 56-25 | 838,897 | 78-26 | 3.57 | 34-16 | 28,718 | 25-14 | 1.30 | 72-27 |
| Czech Republic | 14 | 36-17 | 10,513,209 | 44-12 | 1.33 | 44-21 | 24,133 | 31-17 | 7.25 | 50-17 |
| Denmark | 341 | 13-7 | 5,602,628 | 56-17 | 60.86 | 6-1 | 37,344 | 12-5 | 114.15 | 15-7 |
| Estonia | 1 | 78-28 | 1,294,455 | 77-25 | 0.77 | 48-24 | 19,458 | 37-21 | 0.64 | 80-28 |
| Finland | 87 | 21-11 | 5,431,000 | 58-19 | 16.01 | 22-9 | 34,616 | 19-10 | 303.95 | 7-3 |
| France | 841 | 5-3 | 63,721,000 | 15-2 | 13.19 | 24-11 | 32,378 | 20-11 | 33.59 | 23-11 |
| Germany | 1311 | 3-2 | 81,946,000 | 11-1 | 15.99 | 23-10 | 34,966 | 17-8 | 469.48 | 4-2 |
| Greece | 11 | 38-19 | 10,815,197 | 41-10 | 1.01 | 47-23 | 26,857 | 27-15 | 5.11 | 53-19 |
| Hungary | 29 | 29-13 | 9,957,731 | 45-13 | 2.91 | 39-19 | 19,179 | 38-22 | 18.90 | 32-14 |
| India | 151 | 19- | 1,210,193,422 | 2- | 0.12 | 73- | 2791 | 76- | 675.67 | 2- |
| Ireland | 77 | 22-12 | 4,588,252 | 61-20 | 16.78 | 21-8 | 41,134 | 8-2 | 23.40 | 28-12 |
| Israel | 623 | 7- | 7,968,300 | 52- | 78.18 | 5- | 25,258 | 30- | 308.64 | 6- |
| Italy | 384 | 11-5 | 60,870,745 | 17-4 | 6.30 | 28-13 | 31,068 | 23-12 | 154.55 | 12-4 |
| Japan | 469 | 10- | 127,400,000 | 8- | 3.68 | 33- | 32,360 | 21- | 181.48 | 11- |
| Republic of Korea | 161 | 18- | 50,004,441 | 19- | 3.21 | 37- | 25,930 | 29- | 77.63 | 18- |
| Latvia | 7 | 46-21 | 2,070,371 | 72-23 | 3.38 | 36-18 | 15,552 | 44-26 | 5.62 | 52-18 |
| Lithuania | 2 | 71-27 | 2,976,051 | 71-22 | 0.67 | 50-25 | 17,037 | 42-25 | 1.46 | 71-26 |
| Luxembourg | 12 | 37-18 | 524,900 | 80-27 | 22.86 | 18-7 | 79,202 | 1-1 | 1.89 | 67-24 |
| Malta | 3 | 59-26 | 416,055 | 81-28 | 7.21 | 27-12 | 23,936 | 32-18 | 1.56 | 70-25 |
| Netherlands | 477 | 9-4 | 16,778,806 | 36-8 | 28.42 | 13-4 | 39,420 | 9-3 | 151.28 | 13-5 |
| Poland | 26 | 30-14 | 38,538,447 | 25-6 | 0.67 | 50-25 | 17,087 | 41-24 | 19.02 | 31-13 |
| Portugal | 17 | 34-15 | 10,562,178 | 43-11 | 1.60 | 43-20 | 23,633 | 34-19 | 8.99 | 44-16 |
| Romania | 4 | 54-24 | 19,043,767 | 34-7 | 0.21 | 68-28 | 12,570 | 51-27 | 3.97 | 59-22 |
| Russia | 41 | 27- | 143,300,000 | 7- | 0.28 | 60- | 16,764 | 43- | 30.57 | 25- |
| Singapore | 145 | 20- | 5,312,400 | 59- | 27.10 | 14- | 51,416 | 4- | 35.01 | 21- |
| Slovakia | 7 | 45-22 | 5,445,324 | 57-18 | 1.28 | 46-22 | 20,357 | 36-20 | 4.29 | 57-20 |
| Slovenia | 8 | 42-20 | 2,059,000 | 73-24 | 3.88 | 31-15 | 25,954 | 28-16 | 3.85 | 60-23 |
| Spain | 193 | 16-10 | 47,265,321 | 20-5 | 4.08 | 30-14 | 30,584 | 24-13 | 78.92 | 17-9 |
| Sweden | 300 | 14-8 | 9,555,893 | 46-14 | 31.39 | 12-3 | 37,112 | 13-6 | 101.11 | 16-8 |
| Switzerland | 881 | 4- | 8,014,000 | 51- | 109.93 | 4- | 44,160 | 7- | 249.37 | 8- |
| United Kingdom | 1448 | 2-1 | 63,181,775 | 16-3 | 22.91 | 17-6 | 34,626 | 18-9 | 523.56 | 3-1 |
| United States | 10,464 | 1- | 315,449,000 | 3- | 33.17 | 11- | 45,071 | 6- | 2941.17 | 1- |
| (B) | ||||||||
| Country | R&D expenditureb | Position World-EU | Patents/R&D expenditure | Position World-EU | R&D expenditure in % GNIb | Position World-EU | Patents/R&D expenditure in %GNI | Position World-EU |
| Australia | 15.90 | 15- | 37.79 | 8- | 2.12 | 14- | 10.00 | 27- |
| Austria | 8.30 | 19-8 | 24.09 | 16-8 | 2.55 | 11-5 | 11.23 | 25-9 |
| Belgium | 6.90 | 21-9 | 53.76 | 6-2 | 1.89 | 16-7 | 3.33 | 47-14 |
| Bulgaria | 0.44 | 54-24 | 9.09 | 29-19 | 0.47 | 54-27 | 1.39 | 61-21 |
| Canada | 24.30 | 9- | 26.00 | 13- | 1.96 | 15- | 55.55 | 7- |
| China | 153.70 | 2- | 1.15 | 59- | 1.36 | 24- | 26.31 | 14- |
| Croatia | 0.70 | 48-20 | 21.42 | 18-9 | 0.86 | 36-18 | 2.89 | 51-15 |
| Cyprus | n.d. | 70- | n.d. | 70- | 0.48 | 50-25 | 1.18 | 63-23 |
| Czech Republic | 3.80 | 30-13 | 3.68 | 47-24 | 1.45 | 22-12 | 1.60 | 59-19 |
| Denmark | 5.10 | 28-12 | 66.86 | 3-1 | 2.64 | 8-3 | 21.73 | 19-7 |
| Estonia | 0.36 | 56-25 | 2.77 | 52-26 | 1.12 | 29-16 | 0.14 | 76-28 |
| Finland | 6.30 | 25-11 | 13.80 | 26-16 | 3.62 | 2-1 | 3.43 | 46-13 |
| France | 42.20 | 6-2 | 19.92 | 20-11 | 2.13 | 13-6 | 66.66 | 5-3 |
| Germany | 69.50 | 4-1 | 18.86 | 21-12 | 2.59 | 10-4 | 90.90 | 4-2 |
| Greece | 1.70 | 37-16 | 6.47 | 37-20 | 0.57 | 46-23 | 4.78 | 41-12 |
| Hungary | 1.70 | 37-16 | 17.05 | 23-14 | 0.99 | 33-17 | 4.90 | 40-11 |
| India | 36.10 | 8- | 4.18 | 43- | 0.76 | 38- | 50.00 | 9- |
| Ireland | 2.60 | 36-15 | 29.61 | 11-6 | 0.69 | 40-20 | 0.71 | 68-26 |
| Israel | 9.40 | 18- | 66.27 | 4- | 4.47 | 1- | 23.25 | 18- |
| Italy | 19.00 | 12-4 | 20.21 | 19-10 | 1.16 | 26-14 | 55.55 | 7-4 |
| Japan | 144.10 | 3- | 3.25 | 50- | 3.35 | 4- | 28.57 | 13- |
| Republic of Korea | 44.80 | 5- | 3.59 | 48- | 3.01 | 5- | 10.75 | 26- |
| Latvia | 0.23 | 61-26 | 30.43 | 10-5 | 0.61 | 43-21 | 2.09 | 55-18 |
| Lithuania | 0.47 | 53-23 | 4.25 | 42-22 | 0.79 | 37-19 | 0.42 | 74-27 |
| Luxembourg | 0.67 | 49-21 | 17.91 | 22-13 | 1.61 | 20-10 | 1.24 | 62-22 |
| Malta | n.d. | 84- | n.d. | 84- | 0.56 | 47-24 | 0.88 | 64-24 |
| Netherlands | 10.80 | 17-7 | 44.16 | 7-3 | 1.85 | 17-8 | 43.47 | 10-5 |
| Poland | 6.90 | 21-9 | 3.76 | 46-23 | 0.59 | 45-22 | 7.35 | 33-10 |
| Portugal | 2.80 | 32-14 | 6.07 | 38-21 | 1.14 | 28-15 | 2.48 | 52-16 |
| Romania | 1.30 | 41-18 | 3.07 | 51-25 | 0.47 | 54-27 | 1.40 | 60-20 |
| Russia | 23.10 | 10- | 1.77 | 57- | 1.11 | 30- | 6.13 | 37- |
| Singapore | 6.30 | 25- | 23.01 | 17- | 2.30 | 12- | 12.50 | 22- |
| Slovakia | 0.50 | 52-22 | 14.00 | 25-15 | 0.48 | 50-25 | 2.39 | 53-17 |
| Slovenia | 0.80 | 45-19 | 10.00 | 28-18 | 1.56 | 21-11 | 0.85 | 66-25 |
| Spain | 17.20 | 14-5 | 11.22 | 27-17 | 1.23 | 25-13 | 26.31 | 14-6 |
| Sweden | 11.90 | 16-6 | 25.21 | 15-7 | 3.59 | 3-2 | 14.08 | 20-8 |
| Switzerland | 7.50 | 20- | 117.46 | 2- | 2.95 | 6- | 166.66 | 2- |
| United Kingdom | 38.40 | 7-3 | 37.70 | 9-4 | 1.77 | 18-9 | 125.00 | 3-1 |
| United States | 405.30 | 1- | 25.81 | 14- | 2.63 | 9- | 3978.70 | 1- |
Current International dollar. http://data.worldbank.org/indicator/NY.GNP.PCAP.PP.CD/countries/1W?display=default.
By Gross National Income (GNI, formerly GNP) at purchasing power parity (PPP), Spain ranked 24th of the 89 countries studied and 13th in the EU. When analyzing patents per GNI-PPP, Spain pass to 17th place of world and 9th in the EU. This ratio is 37 times lower in Spain than in the United States, and 6 times lower than Germany (Table 2A).
The analysis of the amounts of expenditure on R&D per patent is valid when all patents are taken into account. In our case, there is a significant bias, since each country uses its strengths to patent. However, considering the obvious bias, we can perceive the interest of each country for Immunology.
By R&D, Spain ranked 14th for the 89 countries studied (no data for 27 countries) and 5th in the EU, but when analyzing patents per R&D, Spain dropped to 27th of the countries studied and 17th in the EU. This ratio is more than two times lower in Spain than in the United States, and 1.5 times lower than Germany (Table 2B).
By R&D as a percentage of GNI, Spain ranked 25th for the 89 countries studied (no data for 13 countries) and 13th in the EU, but when analyzing patents per R&D as a percentage of GNI, Spain passed to 14th of the countries studied and 6th in the EU. This ratio is 151 times lower in Spain than in the United States, and almost 3.5 times lower than Germany (Table 2B).
The United States is the hub for joint applications, followed by the United Kingdom and, to a lesser extent, Germany (Fig. 1).

Relations between the major patent country applicants in Immunology. AT=Austria, AU=Australia, BE=Belgium, CA=Canada, CH=Switzerland, CN=China, DE=Germany, DK=Denmark, ES=Spain, FR=France, GB=United Kingdom, IL=Israel, IT=Italy, JP=Japan, KR=Republic of Korea, NL=Netherlands, SE=Sweden, US=United States.
There were differences between Spain and all other countries with respect to ISI-FgH-OST-INPI technological classes. Spain was more highly represented in Class Organic products; and less represented in Classes Biotechnology and Analysis of Biological Materials (data not shown).
The number of IPC groups to which patents are assigned for protection is considered an indicator of quality. Worldwide patents were assigned to 3.83±0.24 (x±SE) groups of IPC; and Spanish patents were assigned to 3.56±0.02 groups.
There were no significant differences between forward citations received by Spanish patents, 0.37±0.07 and worldwide patents 0.46±0.009, during the first year of filing, although there was a greater number of citations received by worldwide patents. During the first year, 79.79% of the Spanish applications received no citations.
There were no significant differences between backward citations made by Spanish and worldwide patents, 6.19±0.40 vs. 5.88±0.05, respectively. No patents were cited in 5.69% of Spanish patents and one cited 44 patents.
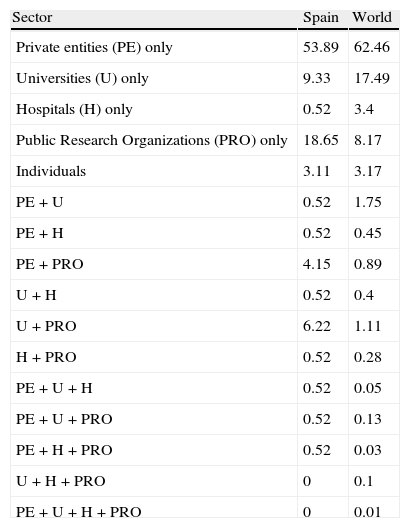
Private entities of Spain and around the world presented 60.64% and 65.77% of the patents, respectively. PROs of Spain and the world presented 30.58% and 10.72%, respectively. Collaboration between private entities and universities is much lower in Spain than in other countries (Table 3).
Comparison of patents in immunology, Spain and worldwide, according to economic sectors. Expressed in percentages.
| Sector | Spain | World |
| Private entities (PE) only | 53.89 | 62.46 |
| Universities (U) only | 9.33 | 17.49 |
| Hospitals (H) only | 0.52 | 3.4 |
| Public Research Organizations (PRO) only | 18.65 | 8.17 |
| Individuals | 3.11 | 3.17 |
| PE+U | 0.52 | 1.75 |
| PE+H | 0.52 | 0.45 |
| PE+PRO | 4.15 | 0.89 |
| U+H | 0.52 | 0.4 |
| U+PRO | 6.22 | 1.11 |
| H+PRO | 0.52 | 0.28 |
| PE+U+H | 0.52 | 0.05 |
| PE+U+PRO | 0.52 | 0.13 |
| PE+H+PRO | 0.52 | 0.03 |
| U+H+PRO | 0 | 0.1 |
| PE+U+H+PRO | 0 | 0.01 |
Thirty-one entities applied for over 50 patents, with the University of California standing out at 315. Of these 31 entities, 22 were from the United States, 8 from Europe (3 from France, 2 from Switzerland, 1 from Belgium, 1 from United Kingdom and 1 from Sweden) and 1 from Israel.
Thirteen Spanish organizations requested 3 or more patents during the years studied: 23 from Scientific Research Council (CSIC), 12 from Biomedicine Project Cima; 8 from Palau Pharma Inc., 5 from Almirall Inc., Bionostra Ltd., and Autonomus University of Madrid; 4 from Autonomus University of Barcelona; and University of Salamanca; and 3 from Foundation for Biomedical Research, Science and Technology Institute of Navarra, National Institute for Agricultural Research (INIA), Catalan Institution for Research and Advanced Studies (ICREA), and Oryzon Genomics Inc.
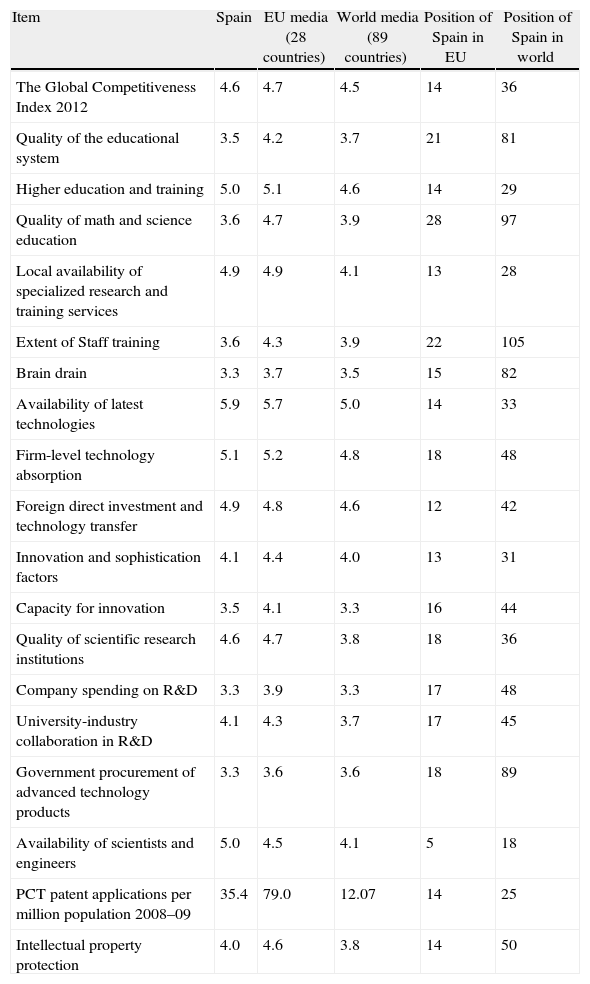
We have linked 19 of the 100 items, World Economic Forum analyzed, with patent applications in immunology. Innovation in Spain has a number of strengths with respect to all the countries analyzed, but when compared with neighbouring countries, some turn into weaknesses (Table 4).
Strengths and weaknesses of innovation in Spain, compared with the EU countries and 89 countries around the world.
| Item | Spain | EU media (28 countries) | World media (89 countries) | Position of Spain in EU | Position of Spain in world |
| The Global Competitiveness Index 2012 | 4.6 | 4.7 | 4.5 | 14 | 36 |
| Quality of the educational system | 3.5 | 4.2 | 3.7 | 21 | 81 |
| Higher education and training | 5.0 | 5.1 | 4.6 | 14 | 29 |
| Quality of math and science education | 3.6 | 4.7 | 3.9 | 28 | 97 |
| Local availability of specialized research and training services | 4.9 | 4.9 | 4.1 | 13 | 28 |
| Extent of Staff training | 3.6 | 4.3 | 3.9 | 22 | 105 |
| Brain drain | 3.3 | 3.7 | 3.5 | 15 | 82 |
| Availability of latest technologies | 5.9 | 5.7 | 5.0 | 14 | 33 |
| Firm-level technology absorption | 5.1 | 5.2 | 4.8 | 18 | 48 |
| Foreign direct investment and technology transfer | 4.9 | 4.8 | 4.6 | 12 | 42 |
| Innovation and sophistication factors | 4.1 | 4.4 | 4.0 | 13 | 31 |
| Capacity for innovation | 3.5 | 4.1 | 3.3 | 16 | 44 |
| Quality of scientific research institutions | 4.6 | 4.7 | 3.8 | 18 | 36 |
| Company spending on R&D | 3.3 | 3.9 | 3.3 | 17 | 48 |
| University-industry collaboration in R&D | 4.1 | 4.3 | 3.7 | 17 | 45 |
| Government procurement of advanced technology products | 3.3 | 3.6 | 3.6 | 18 | 89 |
| Availability of scientists and engineers | 5.0 | 4.5 | 4.1 | 5 | 18 |
| PCT patent applications per million population 2008–09 | 35.4 | 79.0 | 12.07 | 14 | 25 |
| Intellectual property protection | 4.0 | 4.6 | 3.8 | 14 | 50 |
The scientific-technological situation of a country is of high political interest, as advances in research are closely related to economic progress. Scientometric methods, therefore, are internationally accepted instruments. However, the use of patent data should be taken with caution due to the traditional differences existing in each country at the time of patenting. Furthermore, handling of patent data to obtain manageable databases is far more complicated than data management for publications.
These analyses show that the absolute number of Spanish patents using PCT-WIPO route increased from 2871 (2004) to 3430 (2011), with a peak in 2008 with 3596.11
Similarly, the global share of Spanish scientific journal articles has passed since the 2.26% of total articles in 2000 to 2.75% in 2008.12
If classes are assigned a quality index, we could consider that the quality of global patents is high, as they are attributed to more groups.
The CSIC files more patents in Immunology than any other Spanish PROs and outperforms private entities, universities, hospitals, and individuals. The comparison with the results of scientific papers shows a clear difference as, in the period 2003–2007, Spanish universities published 66% of the articles, followed by hospitals with 28% and the CSIC with 18%.12 Collaboration between private entities and universities is much lower in Spain than in other countries, perhaps because this partnership provides asymmetrical results, as the goals of each sector are different.
Patent studies should be made uniform, following demographic, economic and R&D variables, to provide the least biased information possible on a country's innovative activity.
The European Commission as early as 2002 indicated that in Spain the main weaknesses were the paucity of new patents registered and the low level of investment in R&D.13 The 2005 COTEC report noted the low regard Spanish employers have towards R&D and innovation as an essential element for competitiveness.14 Long-term investment in Spain is in the hands of foreign companies, with only the production of relatively low value added goods remaining in Spanish hands.15
Spanish companies invest little in R&D and have a weak relationship with the public sector, which is the largest investor in R&D. The integration of universities with the industrial world is imperative, but the large number of Spanish graduates is not absorbed by private companies. Similar results have been noted by other authors.16 We must not forget that behind each patent is the possibility to generate economic resources, which in turn can contribute to the creation of new ideas.
Conflict of interestThe authors have no conflict of interest to declare.