


Software measurement is widely recognized as an essential part of understanding, controlling, monitoring, predicting, and evaluating software development and maintenance projects. Both, software process improvement (SPI) and software measurement literature include many case studies of successful companies and descriptions of their measurement programs. However, there are still concerns on how to design efficient strategic measurement programs. These concerns include the lack of involvement of the SEO's personnel, bad alignment with its strategy and improvement initiative, difficulty to justify the utility of using standards or improvement initiatives, etc. All of the former results in inadequate measurement programs that often lead to poor decisions and economic loss. This paper describes a pilot study to observe and analyze the operation of measurement teams when using measurement methods such as Balanced Objective-Quantifiers Method (BOQM), Practical Software Measurement (PSM) and Balanced Scorecard and Goal-Driven Measurement (BSC&GQ[I]M) to design a strategic measurement program. From the results of the study, we gained some insight on common difficulties and problems, which are useful to consider when designing of strategic measurement programs. This paper describes an important milestone in achieving our main research goal, evaluate and find suggestions to design a strategic measurement program aligned correctly with the strategic goals, for effective decision making at all organization levels and justify the utilities or benefits of integrating improvement initiatives.
La medición del software es ampliamente reconocida como una parte esencial de entendimiento, control, monitoreo, predicción y evaluación de proyectos de desarrollo y mantenimiento de software. Ambos, la mejora de procesos de software y la literatura de medición de software contienen muchos casos de compañías exitosas y la descripción de sus programas de medición. Sin embargo, existen preocupaciones acerca de cómo diseñar eficientemente programas de medición estratégicos. Estas preocupaciones incluyen la pérdida de la intervención del personal, la mala alineación con la estrategia y la iniciativa de mejora, la dificultad para justificar la utilidad de los estándares o iniciativas de mejora, etcétera. Todos los resultados anteriores recaen en programas de medición inadecuados que a menudo conducen a malas decisiones y pérdidas económicas. Este artículo describe un estudio piloto para observar y analizar la operación de equipos de medición mientras utilizan métodos de medición tales como el método balanceado objetivo-cuantificadores, medición práctica del software y el cuadro de mando integral y medición dirigida por metas para diseñar un programa de medición estratégico. De los resultados del estudio, obtuvimos un panorama de los problemas y dificultades comunes, que son útiles a considerar cuando se diseña un programa de medición estratégico. En este trabajo se describe un hito importante en la consecución de nuestro objetivo principal de la investigación, evaluar y encontrar sugerencias para el diseño de un programa de medición estratégico alineado correctamente con los objetivos estratégicos, para la toma eficaz de decisiones en todos los niveles de la organización y justificar las utilidades o beneficios de la integración de las iniciativas de mejora.
If you can't measure it, you can't manage it. This saying is often used as a means to urge a Software Engineering Organization (SEO1) to define and implement measurement programs. In the past few years, several sources have described how measurement programs helped SEOs to improve the quality their processes and products (Mcloone and Rohde, 2007; Qi, 2007; El-Emam, 2007; Diaz-Ley et al., 2008; Gresse et al., 2003; Daskalantonakis, 1992). Today, there is a common agreement on that measurement programs help to support larger and continuous process and product improvement. Despite the popularity of measurement programs, cases in which these programs are not clearly conceptualized and therefore, fail to accomplish their intended purposes have also been observed. Many factors contribute to the former. For example, Asgarkhani (2006) discusses that the lack of awareness of the benefit of a measurement program from the SEO's personnel, leads to a lack of commitment in its design and implementation.
Additionally, designing measurement programs for effective decision-making at all SEOs' organizational levels is recognized as difficult task (Mathiassen et al., 2005). Alignment with business objectives (Basili et al., 2007 and 2010), justification of the benefits of improvement initiatives (Laporte et al., 2008), and integration of the strategic plan (Tuan et al., 2006) are often issues mentioned in designing effective measurement programs for SEOs. All the former becomes relevant because poorly designed measurement programs could cause problems such as bad decision-making and economic loss (Basili et al., 2007 and 2010; Tuan et al., 2006).
Fortunately, we are learning that an integral software measurement program with a SEO's business strategy is more likely to provide data to support decision-making (Basili et al., 2007 and 2010). However, we consider that it is not clear how to facilitate the design of measurement programs that reflect the progress toward SEOs' business goals at different organizational levels. Hereafter, these measurement programs will be called strategic measurement program.
In order to provide some insight into how to facilitate the design of strategic measurement programs, we report in this paper the results of a pilot study we performed with the purpose of identifying the common difficulties and problems. The study was carried out in an academic setting to observe and analyze the operation of measurement teams when designing a strategic measurement program with the following measurement methods: BOQM (A Balanced Objective-Quantifiers Methodology) (García et al., 2010), PSM (Practical Software Measurement) (McGarry et al., 2002; PSM, 2006; Prasad et al., 2009) and the BSC&GQ[i]M (Balanced Scorecard and Goal-Driven Measurement) (Goethert and Ficher, 2003; Goethert and Siviy, 2004). We discuss the identified difficulties and problems considering three main categories: comprehension, performance and utility of methods. All collected information was analyzed to answer next research questions:
- 1)
What are the difficulties and/or problems to design a precise strategic measurement program for effective decision making at all organization levels?,
- 2)
What are the difficulties and/or problems to align correctly the strategic goals with the strategic measurement program?, and
- 3)
What are the difficulties and/or problems to justify the utilities or benefits of integrating improvement initiatives in business strategy?
This information will help in achieving our main research goal, evaluate and find suggestions to design a strategic measurement program aligned correctly with the strategic goals, for effective decision making at all organization levels and justify the utilities or benefits of integrating improvement initiatives.
The organization of this article is as follows: in the next section we describe the methods and their importance. The following section shows the details of the pilot study. The fourth section presents the threats to validity of this pilot study. The last section presents the conclusions.
Overview of the selected measurement methodsIn this section, we present an overview of the measurement methods used in our pilot study and discuss the reasons why we selected them. In order to support our selection criteria, we also present a comparison of all of them with the ISO/IEC 15939 –a well-known and widely used standard for measurement processes in software engineering (ISO/IEC 15939, 2007). The comparison considers the support provided by the selected methods with regard to the measurement process' activities and tasks defined by this standard.
Practical Software Measurement (PSM)Practical Software Measurement (PSM) (McGarry et al., 2002; PSM 2006; Prasad et al., 2009) is a measurement framework developed in 1994 by the Joint Logistics Commanders, Joint Group on Systems Engineering (JLC-JGSE). Although PSM was initially created to support the software project management needs of the JLC-JGSE, later on it was extended to cover more measurement requirements. Particularly, those retrieved from project experiences of the US Army Armament Research, Development and Engineering Center (ARDEC) and the Department of Defense (DoD). At present PSM is still being used by the mentioned organizations.
PSM provides measurement users (i.e., project and technical managers) with quantitative information to support decision-making at several levels of a SEO. The framework incorporates the use of multiple measures and indicators to identify and evaluate information needs, including issues, risks and problems (McGarry et al., 2002). PSM makes it easy to show, in terms of systemic cause and effect relationships, how measurement can be tailored to satisfy the needs of measurement users. Thus, PSM works also as an impact analyzer.
As mentioned before, PSM is based on actual measurement experience of government and industry organizations. An aspect to highlight is that most of the PSM concepts have been formalized in the process measurement standard ISO/IEC 15939, and adopted in the Measurement and Analysis Process Area of CMMI (SEI, 2006). Additionally, it is known that over five thousand people around the world have been trained in PSM (Card, 2003). All this makes PSM a mature measurement framework and promoted its selection to support our pilot study.
Balanced scorecard and goal-driven measurementThe Balanced Scorecard and Goal-Driven Measurement (BSC&GQ[I]M) (Goethert and Ficher, 2003; Goethert and Siviy, 2004) is a formal measurement methodology defined by the Software Engineering Institute (SEI) in 2003. In 2004, the SEI's Software Engineering Measurement and Analysis (SEMA-SEI) updated it to improve the analysis and collection of measurement information.
BSC&GQ[I]M is based on the Balanced ScoreCard framework (BSC) (Kaplan and Norton, 2006) and the Goal Question Indicator Metric Approach (GQ[I]M) (Park et al., 1996) methods. GQ[I]M, the improved version of GQM (Basili and Weiss, 1984; Basili et al., 1994), supports the translation of strategic organization's objectives into measures and indicators as well as the their justification through goals-questions-measures. On the other hand, BSC helps to determine how well the strategic objectives are achieved and delimited into vision by refining the previous information into four main perspectives: financial, customer, internal business, and learning & growth. This refinement makes it easier in BSC&GQ[I]M to see how value is created in an organization by means of cause-effect relationships among the indicators identified across the four perspectives.
It is recognized that use of BSC&GQ[I]M provides a systematic way to obtain measures and indicators reflecting the health and performance of an organization (Goethert and Ficher, 2003). Additionally, several sources report the widespread use of BSC and GQM. BSC is used by 70% of companies in the US (Johnson and Beiman, 2007) and by 65% of top companies of New Zealand (Blundell et al., 2003). GQM is the second measurement method used by the SEI customers (Kasunic, 2006). Of these customers, 67.2% use it in combination with the measurement and analysis (M&A) process of CMMI. It is noteworthy that BSC&GQ[I]M can support the M&A process of CMMI with its measurement template (Goethert and Siviy, 2004). All these reasons justify the selection of BSC&GQ[I]M for our pilot study.
Balanced Objective-Quantifiers Method (BOQM)The Balanced Objective-Quantifiers Method (BOQM) (Mitre et al., 2011; García et al., 2010) is a measurement method developed by the Software Engineering Lab at Carlos III University of Madrid. BOQM is based on a set of widely used and mature measurement methods, namely GQM, PSM, BSC and the standard ISO/IEC 15939:2007.
BOQM defines a process driven by the SEO's key roles to design, implement, and control a quantitative strategy through indicators aligned with strategic objectives, through BSC and GQM principles. Additionally, the inclusion of PSM and ISO/IEC 15939:2007 enables the use of an information model, which defines the kinds of metrics and indicators frequently used in measurement systems and relationships between them. Thus it promotes the collection of good-quality measurement information (Staron et al., 2010).
BOQM has a successful case study in which common measurement program problems were minimized. Such problems include (1) the lack of alignment among strategic goals, SPI initiatives and measurement plans, (2) bad synergy between the roles involved in the strategic plan design and the measurement plans, (3) misuse of pre-existing knowledge for strategic plan design and (4) no communication of measurement information to all decision-making levels within a SEO (Mitre et al., 2011; García et al., 2010). The above made BOQM worthy of consideration for the realization of our pilot study.
The selected methods compared to the ISO/IEC 15939 standardSince ISO/IEC 15939 is a well-known and widely used standard for measurement processes in software engineering, we consider that we can support the selection of PSM, BOQM and BSC&GQ[I]M by showing that all of them have an acceptable degree of coverage of the process' tasks and activities defined by the ISO/IEC 15939 standard. Tables 1 and 2 show this information. We use the symbol “-” to denote no coverage and the symbol “*” to denote coverage.
ISO/IEC 15939 activities and tasks supported by BOQM, PSM and BSC&GQ[I]M (part 1)
| Activities supported | |||
|---|---|---|---|
| ISO/IEC 15939 Activities and tasks | BOQM | PSM | BSC&GQ[I]M |
| 4.1: Establish and sustain measurement commitment | |||
| 4.1.1: Accept the requirements for measurement | * | * | * |
| 4.1.1.1: The scope of measurement shall be identified | * | * | * |
| 4.1.1.2: Commitment of management and staff to measurement shall be established | * | * | – |
| 4.1.1.3: Commitment shall be communicated to the organizational unit | * | * | – |
| 4.1.2: Assign resources | * | * | – |
| 4.1.2.1: Individuals shall be assigned responsibility for the measurement process within the organizational unit | * | * | * |
| 4.1.2.2: The assigned individuals shall be provided with resources to plan the measurement process | * | * | – |
| 4.2: Plan the measurement process | |||
| 4.2.1: Characterize organizational unit | * | * | – |
| 4.2.1.1: Characteristics of the organizational unit that are relevant to selecting measures and interpreting the information products shall be explicitly described | * | * | – |
| 4.2.2: Identify information needs (strategic objectives or business objectives) | * | * | * |
| 4.2.2.1: Information needs for measurement shall be identified | * | * | * |
| 4.2.2.2: The identified information needs shall be prioritized | * | * | – |
| 4.2.2.3: Information needs to be addressed shall be selected | * | * | * |
| 4.2.2.4: Selected information needs shall be documented and communicated | * | * | – |
| 4.2.3: Select measures | * | * | – |
| 4.2.3.1: Candidate measures that satisfy the selected information needs shall be identified | * | * | – |
| 4.2.3.2: Measures shall be selected from the candidate measures | * | * | – |
| 4.2.3.3: Selected measures shall be documented by their name, the unit of measurement, their formal definition, the method of data collection, and their link to the information needs | * | * | * |
| 4.2.4: Define data collection, analysis, and reporting procedures | * | * | * |
| 4.2.4.1: Procedures for data collection, including storage and verification shall be defined | * | * | * |
| 4.2.4.2: Procedures for data analysis and reporting of information products shall be defined | * | * | * |
| 4.2.4.3: Configuration management procedures shall be defined | – | * | – |
| 4.2.5: Define criteria for evaluating the information products and the measurement process | * | * | * |
| 4.2.5.1: Criteria for evaluating information products shall be defined | * | * | * |
| 4.2.5.2: Criteria for evaluating the measurement process shall be defined | * | * | * |
| 4.2.6: Review, approve, and provide resources for measurement tasks | * | * | – |
| 4.2.6.1: The results of measurement planning shall be reviewed and approved | * | * | * |
| 4.2.6.2: Resources shall be made available for implementing the planned measurement tasks | * | * | – |
| 4.2.7: Acquire and deploy supporting technologies | – | * | – |
| 4.2.7.1: Available supporting technologies shall be evaluated and appropriate ones selected | – | * | – |
| 4.2.7.2: The selected supporting technologies shall be acquired and deployed | – | * | – |
ISO/IEC 15939 activities and tasks supported by BOQM, PSM and BSC&GQ[I]M (part 2)
| Activities supported | |||
|---|---|---|---|
| ISO/IEC 15939 Activities and tasks | BOQM | PSM | BSC& GQ[I]M |
| 4.3: Perform the measurement process | |||
| 4.3.1: Integrate procedures | * | * | * |
| 4.3.1.1: Data generation and collection shall be integrated into the relevant processes | * | * | * |
| 4.3.1.2: The integrated data collection procedures shall be communicated to the data providers | * | * | * |
| 4.3.1.3: Data analysis and reporting shall be integrated into the relevant processes | * | * | * |
| 4.3.2: Collect data | * | * | * |
| 4.3.2.1: Data shall be collected | * | * | * |
| 4.3.2.2: The collected data shall be stored, including any context information necessary to verify, understand, or evaluate the data | * | * | * |
| 4.3.2.3: The collected data shall be verified | – | * | – |
| 4.3.3: Analyze data and develop information products | * | * | * |
| 4.3.3.1: The collected data shall be analyzed | * | * | – |
| 4.3.3.2: The data analysis results shall be interpreted | * | * | – |
| 4.3.3.3: The information products shall be reviewed | * | * | – |
| 4.3.4: Communicate results | * | * | * |
| 4.3.4.1: The information products shall be documented | * | * | * |
| 4.3.4.2: The information products shall be communicated to the measurement users. | * | * | * |
| 4.4: Evaluate measurement | |||
| 4.4.1: Evaluate information products and the measurement process | * | * | – |
| 4.4.1.1: The information products shall be evaluated against the specified evaluation criteria and conclusions on strengths and weaknesses of the information products drawn | * | * | – |
| 4.4.1.2: The measurement process shall be evaluated against the specified evaluation criteria and conclusions on strengths and weaknesses of the measurement process drawn | * | * | – |
| 4.4.1.3: Lessons learned from the evaluation shall be stored in the “Measurement Experience Base” | * | * | – |
| 4.4.2: Identify potential improvements | * | * | – |
| 4.4.2.1: Potential improvements to the information products shall be identified | * | * | – |
| 4.4.2.2: Potential improvements to the measurement process shall be identified | * | * | – |
| 4.4.2.3: Potential improvements shall be communicated | * | * | – |
It is important to highlight that, despite the fact that BSC&GQ[I]M and BOQM do not completely cover the activities and tasks defined by the ISO/IEC 15939 standard, we believe that both methods are worthy of consideration because they deliver an important value to the measurement process by:
- a)
considering different organizational perspectives (i.e. financial control, customer satisfaction, internal process, learning and growth) of the BSC to determine how well the strategic objectives are achieved across them,
- b)
defining strategic objectives based on the vision of the organization.
The goal of this pilot study was to analyze the use of BOQM, BSC&GQ[I]M and PSM in work teams of students of Master in Science and Information Technology from Carlos III University of Madrid, with the specific research objectives of identifying difficulties and/or problems of all methods. By identifying these difficulties and/or problems we want to offer guidelines to:
- 1.
Align correctly the strategic goals with a measurement program.
- 2.
Design a precise measurement program for effective decision making at all the levels of an organization.
- 3.
Justify the utilities or benefits of integrating improvement initiatives in a business strategy.
In the following subsections, the experimental method and the data collection techniques are described. Moreover, the entire process –the design of the pilot study, its execution and the analysis and interpretation of data– will be described in detailed.
MethodThe experimental method used to achieve the research goals was based on the methodology of Wohlin et al. (2012) for software engineering research. Moreover, for data collection, the Seaman (1999) technique of observations was applied to the tutorials and reviews, and explanatory surveys explanatory were conducted (Wohlin et al., 2012) for the purpose of collecting information of learning, utility and performance of BOQM, PSM and BSC&GQ[I]M. Furthermore, some recommendations of the guidelines established by Jedlitschka and Pfahl (2005), were applied and adapted for the purpose of this investigation.
ContextThe context of the pilot study describes all the elements needed to perform the controlled experiment, such as the independent variables, the subjects participating in the experimentation process, and objects that use these subjects to perform the activities of the experiment.
The pilot study was conducted in the field of a process management course during the first term of the Master's in Science and Information Technology at the University Carlos III of Madrid, the best master's in computer science in the technology area in Spain (Periodico El Mundo, 2010).
Three lecturers, P1, P2 and P3 (Professor 1 to 3), were chosen to teach a different measurement method to a class, without expressing any preference for one particular method. These lecturers were selected based on their knowledge and similar experience. The classes were of two hours' duration and, as mentioned before, the methods taught were: BOQM (taught by P1), BSC&GQ[I]M (taught by P2) and PSM (taught by P3).
After these classes, four teams of students with similar skills and experience were formed according with the measurement abilities (these were also similar). The teams and the method they chose are described below.
- •
Team A. This team chose the method BOQM and comprised two members: the subjects A1 and A2.
- •
Team B. This team also selected BOQM and consisted of two students: subjects B1 and B2.
- •
Team C. Method: BSC&GQ[I]M; members: subjects C1, C2 and C3.
- •
Team D. Method: PSM; members: subject D1, D2 and D3.
In order to not promote any preference for a particular method, we established a common context for all measurement methods considered. This common context is defined by the independent variables of the experiment, which are described in Table 3.
Independent variables
| variable name | Abb. | Description |
|---|---|---|
| Experience and knowledge of teachers | VI1.1 | Experience and skills gleaned from the curricula of teachers with regard to measurement of software products and processes and software process improvement |
| Experience and skills of students | VI1.2 | Experience and skills gleaned from surveys of students in regard to measuring software products and processes, software engineering and software development. |
| Training time per method | VI1.3 | It is time to conduct classes for students by method. The descriptions of the practical case of a real SEO same for all works. |
| Material to monitoring the methods | VI1.4 | For each method: the references, documentation of follow-up activities, templates for presenting the measurement program, templates for indicators are given to students. |
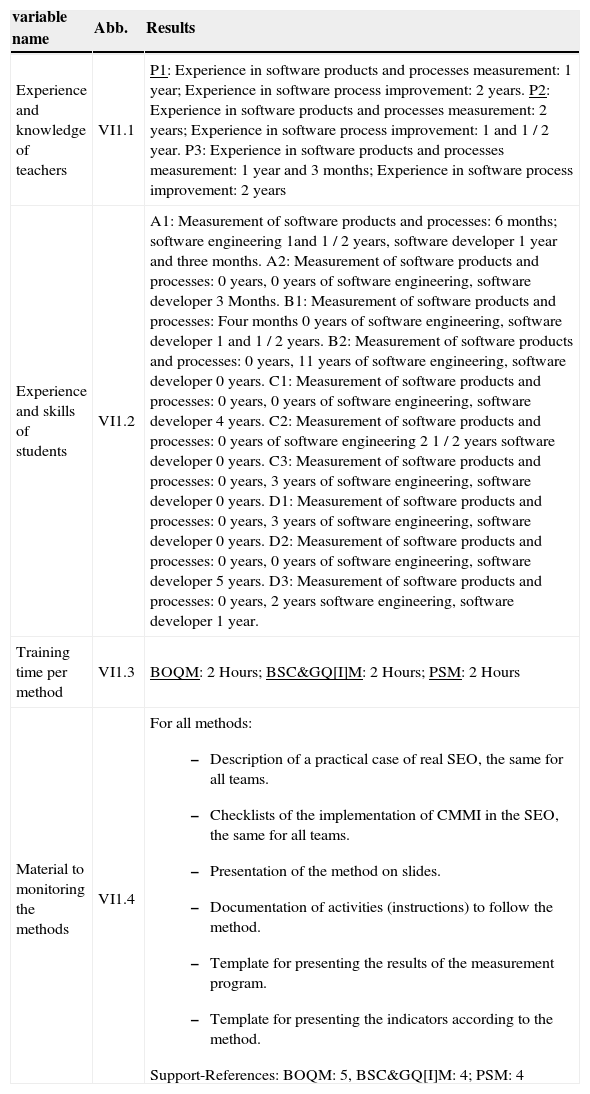
The results for these independent variables are shown in Table 4. As we can see, the experience and knowledge of the lecturers are quite similar. However, in the case of the students, only two of them differ from the others in experience. Specifically, B2 with 11 years' experience in software engineering and D2 with 5 years' experience in software development. The training time was the same for all methods and the provided material had a similar format for all the methods and a common case study scenario for all the teams.
Results of the independent variables
| variable name | Abb. | Results |
|---|---|---|
| Experience and knowledge of teachers | VI1.1 | P1: Experience in software products and processes measurement: 1 year; Experience in software process improvement: 2 years. P2: Experience in software products and processes measurement: 2 years; Experience in software process improvement: 1 and 1 / 2 year. P3: Experience in software products and processes measurement: 1 year and 3 months; Experience in software process improvement: 2 years |
| Experience and skills of students | VI1.2 | A1: Measurement of software products and processes: 6 months; software engineering 1and 1 / 2 years, software developer 1 year and three months. A2: Measurement of software products and processes: 0 years, 0 years of software engineering, software developer 3 Months. B1: Measurement of software products and processes: Four months 0 years of software engineering, software developer 1 and 1 / 2 years. B2: Measurement of software products and processes: 0 years, 11 years of software engineering, software developer 0 years. C1: Measurement of software products and processes: 0 years, 0 years of software engineering, software developer 4 years. C2: Measurement of software products and processes: 0 years of software engineering 2 1 / 2 years software developer 0 years. C3: Measurement of software products and processes: 0 years, 3 years of software engineering, software developer 0 years. D1: Measurement of software products and processes: 0 years, 3 years of software engineering, software developer 0 years. D2: Measurement of software products and processes: 0 years, 0 years of software engineering, software developer 5 years. D3: Measurement of software products and processes: 0 years, 2 years software engineering, software developer 1 year. |
| Training time per method | VI1.3 | BOQM: 2 Hours; BSC&GQ[I]M: 2 Hours; PSM: 2 Hours |
| Material to monitoring the methods | VI1.4 | For all methods:
|
Summarizing, the results of the independent variables are similar enough and did not represent a bias for a particular method, that is, we used a generic base line to get reliable results during the pilot study.
The materials provided to support the pilot study are described below in a detailed way.
- •
Slides of the presentation by each method (BOQM, BSC&GQ[I]M and PSM) to teach classes.
- •
Practical case study of a real software engineering organization (SEO). The SEO is a Spanish software company, leader in consultancy and IT services. The company has a turnover of nearly 700 million Euros and over 2500 employees. It covers practically all the market sectors in Spain. This organization is structured into the following operational areas: high level management, logistics and administration staff, business development staff, operations staff differentiated by specialties and organized into Centers of EXperts (CEX) and, finally, management of clients whose activity is oriented to satisfying immediate user needs. This structure is in accordance with a client-centered business strategy developed by CEX. The company wanted to begin an SPI project oriented to improving the performance of the Information Technologies (IT) Project Management and Software Engineering areas. The units of the company are: ERP (29 project managers, 120 technical personnel), Customer Relationship Management/Knowledge Management (55 project managers, 200 technical personnel), e-Business (28 project managers, 100 technical personnel), software development (28 project managers, 100 technical personnel), commerce and logistics (25 project managers, 60 technical personnel), Center of Experts (CEX) (20 project managers, 1000 technical personnel). More information regarding the practical case considered for this research work can be obtained at (García et al., 2006).
- •
Checklists of the implementation of CMMI in the organization for the implementation level.
- •
At the organizational level: the Development, ERP, CRM, KM, e-Business, Commerce and Logistics, and DTS divisions.
- •
At the CMMI process areas level, process areas Requirements Development (RD), Project Planning (PP) Requirements Management (REQM) and Quality Assurance Process and Product (PPQA).
- •
Documentation of the activities to follow to complete the work of each method.
- •
Template to present the results of the measurement program.
- •
Template for presenting the indicators.
The explanatory survey was applied to all students after the work. The purpose was to collect information about comprehension and utility of the method assigned (the survey can be seen online at http://www.cimat.mx/~hmitre/StudentsSurvey.png).
PlanTo achieve the research goal it is necessary to design variables that are directly related to:
- •
Comprehension. The ability to understand the measurement method.
- •
Utility. The perception of the usefulness of the measurement information for decision-making at all levels.
- •
Performance. The performance of design indicators and the measurement program.
- •
Comprehension. To measure the learning skills of the purpose of experimentation, we defined the category of comprehension of the measurement method. The purpose of this category is to measure the degree of understanding (learning) that the pupil had with respect to the method used to design the measurement program. This meant getting an average percentage of variables designed to determine if the student understood.
- •
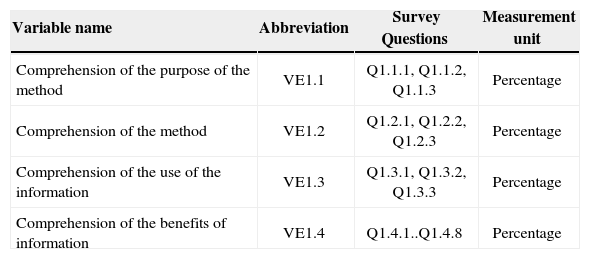
The limitations of the method compared to the capacity to generate measurement information for projects if the information is designed based on the vision and strategy of the SEO and / or in a competitive environment. This variable was defined as comprehension of the purpose of the method (VE1.1) and its corresponding questions are listed in Table 5.
Table 5.Survey variables for comprehension category
Variable name Abbreviation Survey Questions Measurement unit Comprehension of the purpose of the method VE1.1 Q1.1.1, Q1.1.2, Q1.1.3 Percentage Comprehension of the method VE1.2 Q1.2.1, Q1.2.2, Q1.2.3 Percentage Comprehension of the use of the information VE1.3 Q1.3.1, Q1.3.2, Q1.3.3 Percentage Comprehension of the benefits of information VE1.4 Q1.4.1..Q1.4.8 Percentage - •
The measurement features of the method that can be applied with your method to define indicators. It was possible to define the variable comprehension of the method (VE1.2). The relevant questions are shown in Table 5.
- •
The use of measurement information that this method can provide to participants of a software engineering organization (SEO), that is, if you know the features provided information to the measuring equipment and all levels of the SEO. The variable was defined as comprehension of the use of the information (VE1.3) (see Table 5).
The specific benefits of the method in relation to strategic management, process improvement, and measurement of software products and processes were considered. From this point, we were able to define the variable comprehension of the benefits of information (VE1.4) (see Table 5).
UtilityTo measure the use of the method's information by all roles involved in an effective way, and among the strategic management process aligned with software process improvement, we defined the utility method information category. This category sought, from the students' perspective and in percentage terms, the usefulness of the measurement program design and indicators on software products and processes, and participation of the roles involved in the strategy to all organizational levels of the software engineering organization (SEO). Specifically, the variables were designed to obtain a percentage of income:
- •
Data to measure progress and compliance with the objectives of the SEO, decision-making and conduct of a competitive strategy. The variable that was designed to measure this information is the utility method information (VE2.1) (see questions in Table 6).
Table 6.Survey variables for utility category
Variable name Abbreviation Survey Questions Measurement unit Utility method information VE2.1 Q3.1.1, Q3.1.2, Q3.1.3 Percentage Accuracy of the information of method in the practical case VE2.2 Q3.2.1 Percentage Useful information for implementing a measurement program VE2.3 Q3.3.1 Percentage Use of information for reporting to all levels of the SEO VE2.4 Q3.4.1, Q3.4.2, Q3.4.3, Q3.4.4 Percentage Added value of use of information VE2.5 Q3.5.1 Percentage - •
Indicators to adjust and meet the needs of measuring the context of the practical case. The variable that was designed to measure this is the accuracy of the information of method in the practical case (VE2.2) (see questions in Table 6).
- •
The procedures and documents for the collection and analysis of measurement data. The defined variable is useful information for implementing a measurement program (VE2.3) (see Table 6).
- •
Reports to inform and enable regular monitoring and decision making of senior management, tactical command and project managers. The variable to measure is the use of information for reporting to all levels of the SEO (VE2.4) (see Table 6).
- •
Information to provide added value to products and processes of SO. The measured variable is the added value of use of information (VE2.5) (see Table 6).
To measure the time of designing the measurement information and indicators, that is, promptness of the design for each method, we defined the category of performance to design measurement information. To make this measurement it is necessary to know about:
- •
How long it took each team of students to create a measurement program, from the vision and mission of the SEO to strategic objectives, techniques and procedures to arrive at the definition of indicators and this particular program for each method. Given the above, we defined the variable, time to define the measurement program (VD1.1). The specifications of this variable as well as its description, the method of measurement, the measuring unit and scale can be seen in Table 7.
Table 7.Dependent variables of the pilot study in the performance category
Variable name Abb. Description Measurement Method M. unit Scale Time to define the measurement program VD1.1 It is the time it takes to define the goals, needs, procedures for each team Count the number of hours per activity of the method before starting the activities of indicators Hrs. 1..n Time to define indicators VD1.2 It is the time it takes to define all indicators by team Count the number of hours it took the team to define the indicators Hrs. 1..n Number of indicators VD1.3 Number of indicators designed by team Count the number of indicators Num. 1..n Num. of tutorships VD1.4 Number of tutorships given to the team Count the number of tutorships Num. 1..5 Num. of reviews VD1.5 Num. of reviews on team results Count the num. of reviews Num. 1..5 Performance of indicators VD1.6 Time to define an indicator by the team Calculate by team VD1.6=VD1.2 / VD1.3 Indicator/ Hr. 1..n - •
How long it takes to define indicators by work team. To this effect, we defined the variable time to define indicators (VD1.2). The specifications are in Table 7.
- •
Number of indicators per team designed to meet the measurement needs of decision makers. The variable defined for this measure was the number of indicators (VD1.3) (see specifications in Table 7).
- •
To measure the performance indicators is necessary to know how long it takes on average per team to design an indicator. The way to measure this is to divide the time to define the indicators per team by the number of indicators per team. This variable was defined as performance of indicators (VD1.6) and its specifications are listed in Table 7.
However, during the pilot study, observations were made during the tutorials and reviews, only as additional data and for discussions. We identified two variables, the num. of tutorships and num. of reviews. The specifications listed in Table 7.
The observations on students during the tutorships were conducted with the aim of collecting the experiences attended by the teams. The experiences regarding comprehension of the method, and how the method information facilitates the design of the measurement program and the indicators (see variable VD1.4 in table 7).
Observations were made during the reviews on the work of the teams. In the reviews, difficulties were collected properly during the design of the measurement program and indicators (see variable VD1.5 in table 7).
Data collectionIn this pilot study, the execution of the main activities of the collection procedure and instrumentation are shown in the activity diagram of Figure 1 and described below:
- •
During the first activity and before teaching classes on the different methods, we planned to collect data from the curricula of teachers in the research group of the Software Engineering Laboratory (SELUC3M, Software Engineering Lab), University Carlos III Madrid. We selected three teachers with skills in measurement products and processes (MPP) and Software Process Improvement (SPI) with less than three years' experience (variable VI1.1 Table 4).
- •
After the teachers had taught the BOQM, PSM and PSM methods, using slides, (VI1.3 variable, table 4), we formed four teams and the researcher programmed the consulting and review periods After the teacher had trained the master group with presentations of the methods BOQM, PSM and PSM on slides (VI1.3 variable, table 4), we formed four teams and the researcher programmed the periods of consulting and reviews. We gave the following material to the teams (variable VI1.4 table 4):
- *
Practical case of a real SEO
- *
Checklists for implementing the CMMI
- *
Documentation of the method activities
- *
Measurement program template per method
- *
Indicator template per method
- *
References per method
- *
Surveys for each student
- *
- •
With the above material each team had to devise measurement programs and indicators during four months.
- •
While teams were designing their programs and indicators, the researcher was responsible for tutorships to teams and scheduled reviews of the work progress of work. Observations were made on tutorships of equipment and the reviews on progress of work.
- •
When the period of reviews, tutorships and the time schedule for completing the measurement program and its indicators were finished, then the work teams gave their work to the researcher and each student gave his corresponding completed survey to the researcher.
- •
From the surveys, we obtain the variables of experience and skills of the students in measuring software products and processes, software engineering and software development (variable VI1.2 Table 4). In addition, the variables of the categories of comprehension and utility of the surveys were collected (see variables in Table 5 and 6).
- •
The variables of the performance category that were collected from the jobs are: the time to define the measurement program, time to define the indicators, No. of indicators, No. of tutorships, No. of reviews and the performance of indicators (see Table 7).

The analysis procedure used for the work teams was the analysis of performance in the design of indicators, and duration for the design of the measurement program for all methods.
The procedure for data analysis in the surveys was a comparison between the averages for the categories of each method, specifically the categories of comprehension, utility and performance. It is worth mentioning that in the category of comprehension we assessed survey responses as an exam in relation to the method developed by the student; this way we obtained the degree of learning of the student with respect to the method. To qualify each variable, evaluation criteria were used per question.
To analyze the student's interest in learning the development of a measurement program, we analyzed the resulting observations made during the tutorships and reviews. As a result, evidences were collected to describe how learning interest affects performance.
The three analyses of the work, surveys and observations serve as the weight of evidence to support the validation of the goal of this pilot study. The results of all variables can be seen at http://www.cimat.mx/~hmitre/SurveyResults.png.
Next, in Tables from 8 to 10, we present the difficulties, problems and discussions identified from the results of each variable and category. Each table represents a specific research objective, in Table 8, to align correctly the strategic goals with the measurement program, Table 9, the problems and difficulties to design a precise measurement program for effective decision making at all organization levels, and Table 10, Problems and difficulties to justify the utilities or benefits of integrating improvement initiatives in business strategy.
Problems and difficulties to align correctly the strategic goals with the measurement program
| Problem and/or Difficulty | Category | Variable | Discussion |
|---|---|---|---|
| Students had some difficulties to understand the purpose of methods. We realized that even a well-documented method is not enough to describe its purpose. Other factor that influence in bad comprehension of method purpose, is the lack of experience, especially on strategic management and business management. This happens due to the requirement of knowledge of some methods is beyond the knowledge of a software engineer. These students do not understand the purpose of methods to align strategic goals with indicators. | Comprehension | VE1.1 | Our main lack in this problem was the training program. Giving a class on deriving measurable pieces from strategic goals is easiest way to solve it. |
| The degree of adjustment of the indicators with the measuring needs and/or the strategic goals of the practical case is the accuracy that can offers the software engineers with the help of method. Quarter of students achieved 75% of this accuracy, this means, they failed to extract the quantifiable information from measurement needs and/or strategic goals in a correct way. | Utility | VE2.2 | Each measurement template represent a measurable part of an strategic goal, so, if by each template the measurable portion is defined with its strategic goal, accurate information will be designed for each strategic goal. |
| Quarter of students had problems in time to define indicators. The speed to define an indicator hourly was doubled with the rest of the studentteams. The main reason was because they do not use a mechanism to define indicators from a set of measures categorized and organized. Both the organization of the measures as well as the mechanism accelerates the process of defining indicators. | Performance | VD1.6 | Time matters, but it not as important as the correctness of indicators. A set of measures organized as a tree of measures is beneficial to plot the best path that meets the measurement needs a strategic goal, this represent a correct alignment. |
Problems and difficulties to design a precise measurement program for effective decision making at all organization levels
| Problem and/or Difficulty | Category | Variable | Discussion |
|---|---|---|---|
| Understand the methods and the characteristics that stand out over other methods, are the basis for knowing how to use and exploit its method. In one hand, in strategic measurement programs, the alignment of strategic goals and indicators directly influence the whole strategy achievement. In other hand, understand how to design and obtain a result of measure (metric) is essential to design an indicator, this is known as a measurement method. Less than quarter of students failed to understand this alignment and the measurement method. Even the result is not serious, the reason is the lack of knowledge management strategic and product and process measurement. | Comprehension | VE1.2 | A value extracted from an electronic resource or hard copy source by applying a measurement method is a piece for decision makers. A correction without spotlight is shooting in dark. Our suggestion is to add the resource owner for effective correction. |
| Understanding the use of information is key to design effective measurement elements. The main measurement element is the measurement template (or measurement construct as known at ISO/IEC 15939), since it helps to collect information, build the indicator, informs to decision makers and how to achieve strategic goals. Quarter of students failed to understand the use of a template measurement. Once again, the reason is the lack of knowledge on product and process measurement. | Comprehension | VE1.3 | Understanding the functions of the measurement template is basic. The quality of indicators presented to decision makers depends on it. |
| Just quarter of students partially comprehend the utility of method information in what to expect from an external analysis. To lead a competitive strategy, strategic goals need to be defined from external factors, and the best way to discover such factors is making a market analysis. Anew, students fell into the same problem, lack of knowledge and experience of market analysis. | Utility | VE2.1 | At the end of performing the strategic measurement program, one of the best boosts to the success is the external analysis. For this reason, market analysis should be part of the training program. |
| Unexpectedly, almost all students do not comprehend the utility of method information to design a measurement program (VE2.3). Collection and analysis procedures are the basic part of a measurement program, in the opinion of students, documents of methods analyzed were not enough to analyze and collect information, and even with methods based on the ISO/IEC 15939 procedures. In our opinion, students should have been studied the standard to discover its true potential. | Utility | VE2.3 | The collection, analysis and report periods are very useful to inform to decision makers in time and with precise information. Designers must be clear about its utility for better design. |
| The different levels of decision making (directive, managerial, operational levels) into a SEO are pieces that maintain the whole strategy in control, without a report procedure to all decision making levels, the strategic goals are disconnected pieces without control. A method not prepared to inform to all levels, such as a classic method designed to report to project managers, will have problems of 75% of effectiveness of how information goes through SEO. Quarter of students confirm this assertion. | Utility | VE2.4 | Here the picture is clear, if the reports are not designed for all decision making levels, then effectiveness of decisions will be badly affected throughout the organization. |
| The measurement program is composed by plans and procedures, but methods that its purpose is a competitive strategic measurement program, inserts more detailed information into a program such as: external and internal factors, improvement methods aligned with indicators, dashboards design for decision makers. This exhaustive required information provokes delays in program plan. Therefore half of students with this kind of method had delay problems. They doubled the time to define the strategic measurement program spending time especially on defining external and internal factors. | Performance | VD1.1 | Students with a software engineer profile is not enough to design a strategic measurement program, time and quality of information are affected. Our suggestion is integrating strategic management and market analysis practitioners in the process of strategic measurement program definition. |
Problems and difficulties to justify the utilities or benefits of integrating improvement initiatives in business strategy
| Problem and/or Difficulty | Category | Variable | Discussion |
|---|---|---|---|
| Knowing the benefits of the method information is easer to design and control the benefits of the whole strategy. Designing competitive strategic goals is a benefit resulting from a market analysis. Also, justifying improvement initiatives in business strategy is a benefit of aligning the practices or activities of improvement initiatives (e.g. CMMI, ISO/IEC 12207) with the resources used to get values in the measurement template (or measurement construct). Three quarters, or nearly all students do not understand the benefits of design a competitive strategic goals and justify improvement initiative in the strategy. Besides the lack of knowledge in strategic management, students do not know how to perform market analysis. | Comprehension | VE1.4 | An indicator represents a way to achieve a part of strategic goal and is used to control the action plan. In itself, the indicator is the cornerstone of a strategic management system, and the best way to justify the use of improvement initiatives is to noted what activities (or practice) and its resulting work product of the initiative was used to generate indicator measures. Thus, we can say that we are measuring the products of the initiative activities. |
According to our discussions all problems can be categorized in the next knowledge areas: strategic management, business management, market analysis, and product and process measurement. In sum, there still some concerns without a validated solution, but considering improve the training plan with the mentioned problems and discussions can be an initial solution.
Threats to validityIn this section we discuss the main threats to validity of our pilot study. We consider that all of them have impact on four well-known types of threats to validity (Wohlin et al., 2012): internal – how sure we are that the treatment of the pilot study actually caused the outcome, in this case the impact of the internal profile of students and teachers on the validity; external –how sure we are that we can generalize the results outside the scope of our study, in this case the selection procedure of students and teachers and grouping teams; construct –how to obtain the measures to find the problems and difficulties related to the utilities or benefits of integrating improvement initiatives in business strategy, align correctly the strategic goals with the measurement program, design a precise measurement program for effective decision making at all organization levels; finally, conclusion – how to draw statistically correct conclusions based on qualitative measures.
InternalInstrumentation. We observed that students requested more tutorships and reviews for BOQM teams due to the lack of strategic business knowledge. But, this had minor impact on results. This is why maturation issues are not important for the outcome of the study.
ExternalProfiles of the teachers. Even, we observed that the three professors selected from our research group SEL-UC3M had similar abilities their experience on measurement had minor impact on the results of students. TBD
Profiles of the students. Regarding students, the selection of the students' profiles was crafted to be as homogenous as possible. This an important requirement to ensure that all of them have the same kind of organizational vision deal with some important aspects of the study, e.g. the alignment of measurement and the strategy. However, and because of the availability of students at the moment of the study, it was difficult to resolve the level of experience among certain students, i.e. student B2 --with 11 years of experience in software engineering, and student D2 --with 5 years experience in the development of software. Eventually, no student had experience in strategic management, of course it, was necessary, but its impact is homogeneous in the results.
Grouping of the students. Even though the master degree was considered good in Spain, the number of students was too small, about 13 students, so we did not get to create a good filter for this study. However, the measurement capabilities of four teams were very similar and therefore not considered a problem on the results of impact. TBD
ConstructSample size. One of our mayor concerns is the sample size used in this pilot study because it impacts on the quality of the quantitative evidence to the support the hypotheses associated to our research goals. Increasing the sample size will enhance the generalizability of our findings.
ConclusionThe tools utilized. The tools used for this empirical study were: surveys to know the comprehension and utility of methods information, observations and reviews over delivered products (measurement program, templates and indicators) and during the tutorships, and a snapshot of strategy implementation in a determinate moment of a SEO.
All the discussed threats to validity of our pilot study are important. However, and despite them, we consider that the obtained results are valuable in our way to better understand the main problems and difficulties when defining strategic measurement programs. Many of the discussions provided in this paper are useful to design a strategic measurement program, especially for software engineers, strategists, market analysers, and top, middle and operative charges in a SEO.
Conclusions and Future WorkSoftware measurement is an essential part of understanding, controlling, monitoring, predicting, and evaluating software development and maintenance projects. Both, software process improvement (SPI) and software measurement literature include many case studies of successful companies and descriptions of their measurement programs. However, there are problems on how to design efficient strategic measurement programs. In order to get a better understanding of these concerns, in this paper we presented the results obtained from pilot study, which involved the use PSM, BSC&GQ[I]M and BOQM, to design strategic measurement program.
From the obtained results, it was possible to identify some common problems to design a measurement program for effective decision making at all organization levels, to align correctly the strategic goals with the measurement program, and to justify the utilities or benefits of integrating improvement initiatives in business strategy.
We discussed the identified problems considering three main categories: comprehension –the ability to understand the measurement method, performance– the ability to design indicators and the measurement program in a short time, and utility –the ability to understand the usefulness of the measurement information for decision-making at all levels.
Despite the fact we obtained valuable information, the fact that most of this information is qualitative and the fact that our pilot project was conducted with students makes its generality limited. Our future work includes performing more experiments involving people with a more organizational mature background as most of the problems detect were related to the lack of solid experience on product and process measurement as well as on market analysis. We consider that replicating our study several times with this kind of subjects will help to refine our findings in order to obtain more sounding conclusions.
We are also considering to include theGQM+Strategies method in future studies. It is because this method is adjustable to any mature and handy SEO (Basili et al., 2007; Basili et al., 2010).
Is a software engineering researcher at CIMAT Zacatecas, Mexico and member of the SEL-UC3M (Software Engineering Lab, sel.inf.uc3m.es) group at Carlos III University of Madrid. He holds a BSc degree in computer science from the Technological Institute of Culiacan (Mexico, 2003), a MSc degree in computer science and technology from the Carlos III University of Madrid (Spain, 2007) and a Ph D. degree in computer science and technology from the Carlos III University of Madrid (Spain, 2010). His current interests are software process improvement, strategic management in software engineering organizations (SEO), IT governance, knowledge management, product and process measurement and game design and development.
Chicago citation style Mitre-Hernández, Hugo Arnoldo, Javier García-Guzmán, Antonio De Amescua-Seco, Perla Velasco-Elizondo. Designing a Strategic Measurement Program for Software Engineering Organizations: Discovering the Difficulties and Problems. Ingeniería Investigación y Tecnología, XV, 02 (2014): 253–269.
ISO 690 citation style Mitre-Hernández H.A., García-Guzmán J., De Amescua-Seco A., Velasco-Elizondo P. Designing a Strategic Measurement Program for Software Engineering Organizations: Discovering the Difficulties and Problems. Ingeniería Investigación y Tecnología, volume XV (issue 2), April-June 2014: 253–269.
PhD. Holds a BSc in engineering and a PhD in computer science (Carlos III University of Madrid). He is a software process improvement consultant at PROGRESION SMP. He has 9 years' experience as a software engineer and consultant for public and private companies. He has participated in numerous research projects related to software process improvement and its integration with the organizational business processes, financed by public (European and national) and private funds. He has published several books and international scientific papers related to software engineering and collaborative working environments. His current research interest is formal measurement of processes improvement, ISO 15504 assessments, software capacity evaluations and audits and knowledge management related to software engineering.
PhD. Holds a BSc in engineering and a PhD in computer science (Polytechnic University of Madrid). He is a lecturer in software engineering at Carlos III University of Madrid and founding partner of PROGRESION SMP, whose main research areas are software development methodologies and software process improvement. He has been responsible for the Spanish standard software development methodology, called METRICA V3, for public administration. He has published several books and over 100 technical publications on software engineering and management. He is a member of the Spanish Association of Software Metrics (AEMES) and SPIN-Spain (Software Process Improvement Network).
PhD. Is a professor of software engineering at the Autonomous University of Zacatecas and faculty member of the master of software engineering program at that institution. She earned her PhD in 2008 at The University of Manchester-School of Computer Science. From 2010–2011 she was a postdoctoral researcher, working in the ABLE group led by Prof. David Garlan, at The Institute for Software Research (ISR) of The Carnegie Mellon University-School of Computer Science. From 2001–2003, she was associated researcher at the National Laboratory of Advanced Computer Science (LANIA). Her research primary interests include software composition, software architecture and software engineering education in industrial settings.
A Software Engineering Organization (SEO) is an organization with effective management and improvement of internal processes in software development, operation and maintenance. Term introduced by Garcia et al. (2010).