


The Gilberto Borja Navarrete (previously San Marcos Viaduct) spans the River San Marcos in the Mexico City-Tuxpan corridor. It is a singular structure both for its location in Eastern Sierra Madre and its dimensions: at the time of construction, its pier 4, which towers 208m over the foot of the valley, was the tallest ever built in a balanced cantilever bridge.
El viaducto Gilberto Borja Navarrete (anteriormente viaducto San Marcos), situado en el corredor México D.F.-Tuxpan, permite el cruce del cañón del río San Marcos. Es una estructura singular tanto por su ubicación en plena Sierra Madre Oriental, como por sus dimensiones. La pila4, con una altura de 208m, ha sido en el momento de su construcción la pila más alta del mundo en un puente construido por voladizos sucesivos.
Mexico is presently implementing an ambitious motorway construction plan under various public-private financing schemes in an endeavour to complete its road communication network. At this time several sections of motorways between Mexico City and Tuxpan on the Gulf of Mexico are under construction to connect the capital to the Atlantic shore and further development in the centre of the country's east coast.
Construction of the Nuevo Necaxa – Ávila Camacho section of the motorway in northeastern Puebla (Fig. 1) was awarded by the Mexican Communications and Transport Secretariat (Spanish initials, SCT) to AUNETI, a joint venture between Globalvía, a Spanish company, and Mexico's ICA. The 36-km section crosses part of Eastern Sierra Madre, with a very abrupt descent from the high central plateau to the eastern seaboard.

Design and construction were awarded to CONNET, a joint venture formed by FCC Construcción, Spanish builders, and ICA.
1.2The motorwayThe 36km of Eastern Sierra Madre spanned by this section of the motorway is a dense tropical forest in a very mountainous region whose orography poses considerable difficulty for road construction. Six tunnels and 12 viaducts had to be built to cross it. Several of the piers supporting the viaducts are over 100m tall.
1.3The valleyThe geographic formation that posed the biggest challenge to motorway construction was the San Marcos River valley which has to be crossed by Gilberto Borja Navarrete Viaduct (Figs. 2 and 3). The valley is characterised by differences in elevation of up to 800m between the summits and the river and slopes of nearly 45° on both sides. The motorway runs by the hillside of the valley, sustaining a 5.8% grade for several kilometres. To minimise the earthwork needed for the approaches, the bridge crosses the valley at a meander in the river.
1.4Layout

The layout over the valley is curved in the plan view with a constant radius of 1150m: in the elevation view it ramps at a 5.8% grade at heights of 205–254m over the riverbed. The super elevation is a constant transverse slope 5.2%.
The 17.6-m wide deck comprises two carriageways with two 3.5-m wide lanes each, 1.0- and 0.5-m shoulders and a 0.6-m protected median. It s fitted with concrete outer guard-rails.
The final layout was the result of an optimisation study in which the prevailing boundary condition was the need to build the bridge at mid-height, where the slope is nearly 45°; any change in that layout intended to improve the viaduct per se would have entailed digging very deep excavations or erecting very high embankments. For those very reasons, the small radius of curvature could not be enlarged, despite the resulting complexity for long span design and construction.
2Formal design2.1Solutions studiedIn this stage of the project, cable-stayed, launched girder and balanced cantilevering solutions were studied.
Span length was limited to around 250m due to the transverse deflection generated by the small radius of curvature. At the same time, the presence of the river and of a vertical stone wall around 40m high at the foot of the hill on the Tuxpan side determined the need for a span of at least 180m. Those two constraints conditioned the position of the middle pier to a site near the riverbed, which meant that it would have to be around 200m tall.
The tightly curved layout ruled out the use of arch-bridge solutions and that, together with the maximum span restriction and the need for very tall piers, rendered cable-stayed solutions too costly to be competitive. The study consequently focused on continuous girder deck solutions.
Given the viaduct location in a scantly accessible valley and the construction difficulties attendant upon its huge dimensions, construction-related factors had to be studied very carefully during the design phase.
2.2Typologies studiedThe possible continuous girder solutions for deck construction had to be narrowed down to methods not calling for a falsework, given the span lengths involved. Two families of solutions were consequently studied.
- •
Launched deck: the approach here was to build a composite deck with spans on the order of 100m.
- •
Balanced cantilevering with cast-in-place concrete segments: in this approach, both steel and precast concrete solutions had to be ruled out, as they would have entailed shipping the segments to the site across the valley walls, which was utterly impossible. This family of solutions was analysed assuming a span range of 135–220m.
In light of the results of this study, to the effect that the most economically solutions were based on segmental construction, these were the methods chosen for more detailed analysis.
2.3Spans and pier typologiesAs noted above, the position of one of the piers (pier 5 in the final solution) was determined by the topography of the Tuxpan side valley wall. That, in conjunction with the limit on the maximum span length, called for building a 200-m tall pier at the foot of the valley.
Given these boundary conditions, span length was analysed under the premise that for reasons of building efficiency, the same length should be used in all the centre spans: the measure found to be the best alternative was 180m.
The solution ultimately defined consisted in an 850-m long viaduct with spans measuring 57, 98, 3×180, 98 and 57m. The inner area of the bridge, i.e., the two 98- and three 180-m spans, was built by cantilevering the segments from the four middle piers. A falsework was used to build the two outer spans, each designed with an additional 6.5-m that cantilever off the pier into the adjacent centre span (Fig. 4).

The six piers were 33, 76, 166, 208, 121 and 54m high. The forces resulting from the horizontal actions induced by the overall height of the structure would be resisted primarily by the shorter piers, generating very high loads on these members. A number of structural solutions and pier-deck connections were analysed to find a reasonable solution for the loads on each pier.
Given their height, the piers located in the centre of the valley had to be very stiff, particularly during construction when they would behave like free cantilever. They were consequently designed as box sections fixed to the deck. The length of the viaduct informed the use on the outer piers (1 and 6) of longitudinal guided sliding rubber bearings and a much more slender design than in the central piers to prevent forces induced by horizontal action from accumulating on these members. The same type of bearings was specified for the abutments.
As pier 2 is much shorter than the rest of the centre piers, horizontal action would generate extremely high forces in this member. Several solutions were considered to prevent this from occurring.
- •
Neoprene bearings at the top: this solution, requiring provisional restraint during construction, would greatly reduce the forces on the pier, but the trade-off would be a substantial rise in the loads borne by the remaining piers, for the horizontal actions would be transferred nearly entirely to the other three piers, most prominently pier 5.
- •
A double wall: while this solution would reduce longitudinal forces considerably, transverse stiffness would remain high, subjecting the member to considerable stress that it would be scantly able to resist.Moreover, the substantial longitudinal (rheological, seismic and wind) actions generated as a result of the length and curvature of the viaduct would exert very high stress on piers 2 and 5.
- •
Box section to optimise pier stiffness: this was the solution ultimately adopted. It consisted in restraining the four centre piers, varying the section dimensions in both directions and optimising the cross-sectional variation in each pier to determine relative stiffness values that would both be suitable and guarantee optimal collaboration between the two shortest centre piers (2 and 5). Optimisation was sought in terms of both overall structural behaviour and the reinforcement ratios that would be required in all the piers, section by section.
The San Marcos valley lies in an Upper Jurassic limestone formation. The healthy limestone Santiago facies at the bottom is overlain by the Tamán facies, consisting of calcareous and clayey limestone lutite. The Pimienta facies at the top comprises limestone with lutite intercalations. Overall, the rock is characterised by decimetric stratification (Fig. 5).

The rock is semi-fractured to a significant depth, with cracking and greater alteration in the outermost 7–12m; it is covered by a 1.2-m layer of residual clayey topsoil.
Colluvium in the form of residual soils up to 10m thick is found in some areas. The riverbed is covered by an alluvial layer also around 10m thick.
The valley walls are steeply sloped, on the order of 30° on the Mexico City side and 45° on the Tuxpan side, where the wall is nearly vertical from the base to a height of 40m.
4Structural engineering4.1PiersTheir height makes the piers the most prominent elements in the viaduct and the most demanding to design. As noted above, they have a box section. RC-35 concrete was used throughout.
Centre piers 2–5 are restrained by the deck, with a section measuring 9.2 by 8.0m at the crown and a wall thickness of 0.6m at front and rear and 0.5m on the sides. All these dimensions vary with height.
In piers 3 and 4, the dimensions taper with height at a rate of 1/50 on the transversal and 1/75 on the longitudinal side. Pier 4 towers 208m over the river from a base measuring 17.53 by 13.55m (Fig. 6).

The dimensions in piers 2 and 5 taper at a rate of 1/50 on the transversal and 1/150 on the longitudinal side of the section to optimise their reaction to longitudinal actions, as discussed earlier (Fig. 7).

Pier reaction to seismic loads was also taken into consideration in the engineering of their shape, for the intention was not to use pier ductility to reduce such loads. The reasons for that decision were as follows. It appeared to be scantly cost-effective to provide for the formation of plastic hinges during an earthquake with the concomitant need to repair piers over 100m tall in the event. Moreover, serious doubts arose around how a plastic hinge would behave at the base of a pier as large as the ones supporting the viaduct. Furthermore, given the height of the piers and optimised shape, their substructure could be made to react to a quake within an elastic range with no need for additional elements (such as dampers) to isolate these members against earthquakes. This approach lowered the risk of the need for repairs and structural intervention after an earthquake.
The wall thickness, conditioned by the need to prevent local buckling, reached a maximum of 1.0m at the base of pier 4. Wall thickness was engineered to AASTHO [1] criteria, according to which a reduction factor must be applied to the compressive bearing capacity of hollow rectangular pier walls whose transverse slenderness is over 1/15. In this case slenderness was limited to 1/16 to apply the smallest possible reduction factor. Alternative ways to prevent local buckling were explored, such as the use of transverse diaphragms to reduce the free length: this solution was ruled out due to the formwork complexities it would entail. Similarly, stiffening the walls with horizontal diaphragms or ribs was also rejected due to the construction difficulties involved.
4.2AbutmentsClosed abutments were envisaged. Abutment 1, 15m tall, has angled wing walls parallel to the edges of the carriageway (Fig. 8).

Abutment 2 is tiered, with a maximum height of 12m. Located at mid-height of the valley wall, its own walls are fairly atypical: the one on the right is an angled wing wall with a 43-m extension in the form of stabilised soil structure, whereas the one on the left abuts against the hillside and thus needs no angled wing wall (Fig. 9).
4.3Foundations
The abutments and all the piers with the exception of pier 4 are built on shallow foundations.
The foundations under piers 1 and 6 lie in the stratum of fractured limestone with lutite intercalations, where the allowable stress in SLS analysis is 6kg/cm2. The foundations under piers 2, 3 and 5, which support the main spans, lie in the semi-fractured limestone stratum, where the allowable stress in SLS analysis is 10kg/cm2. The foundations under pier 5 have the largest plan view dimensions: 26m×22m by 3.5m deep. RC-25 concrete was used in all the footings.
Fractured rock outcrops in one-fourth of the area where the pier 4 foundations are located, while the rest of the area consists of alluvial sand and gravel to a maximum depth of 20m. The deep foundations consequently designed consist of 64 piles 1.5m in diameter topped with a 34m×34m square pile cap 7.5m deep at its deepest. The piles were built with RC-25 and the cap with RC-30 concrete.
4.4DeckThe RC-40 concrete deck is a continuous, variable depth box girder 850-m long and 18.7m wide at carriageway level. With a maximum depth over the piers (2–5) of 10m and a minimum of 3.6m at mid-span, the deck has an arched intrados. The box girder measures 9.2m wide and its top slab cantilevers 4.75m on each side. By engineering the girder depth (L/18) over the piers so generously in the segmentally erected sections, the longitudinal prestressed and passive shear reinforcement ratios in the deck could be minimised. Given the dimensions of the viaduct, the increase in depth over the piers is imperceptible and hence has no inverse impact on deck slenderness.
The webs are a constant 0.5m thick, while the thickness of the bottom slab varies from 0.30 to 1.25m to accommodate the compression block in the hogging moment area over the pier.
As the top slab of the deck is wider than usual for a single box girder having no transverse stiffeners, during the design stage the performance of the unstiffened section was compared to the behaviour of a section with cross-ribs. The solution with no transverse beams was found to be feasible in terms of both structural performance and passive reinforcement ratios and was consequently chosen in light of the construction advantages afforded.
The transverse bending stress induced by heavy vehicles was analysed by detailed finite elements analysis to optimise member thicknesses while maintaining ratios of 0.63m3 of concrete per m2 of deck in the areas where the depth was a constant 3.60m, and 1.13m3 of concrete per m2 of deck on average in the spans where depth varies from 3.60 to 10.0m. Deck self-weight was also optimised with this approach, therefore improving overall bridge reaction to longitudinal deflection and reducing the effects of seismic action.
Slanted walls built as extensions to the front and rear sides of the piers at the deck-pierhead connection improve stress transfer between those sides and the top and bottom slabs of the deck (Fig. 10).

Deck prestressing is located in the top and bottom slabs in the main spans. Consequently, to prevent slab breakage due to construction errors (sheath warping at construction joints), links of reinforcement were inserted in the 60cm adjacent to the inter-segment joints alongside the sheaths to stitch the slab if it were to rend [2]. The design also envisaged transverse ribs on the ends of the mid-span closure segments to help resist any local stress that may be generated in the bottom slab as a result of staggering due to possible differences in elevation between the edges of the segments to be joined.
The top prestressing in the segmentally built part of the deck conforms to the standard pattern for balanced cantilever bridges, in which each pair of segments is tensioned with a family of post-tensioning tendons (four in this case). These tendons, located in the top slab, are laid in a straight line to within a short distance of the outer edge of the segments under construction, where they curve towards the haunches for front-side anchorage in the thickest part of the slab (Fig. 11). One particularity that merits note is that as the first three pairs of segments in the cantilevered sections are not prestressed, the shortest top tendon is long enough to contribute to ULS bending strength, bearing in mind the shift rule of the bending moment. Each family of tendons was only tensioned from one of the ends, alternating ends with the other family tendons. Such alternate tensioning distributes the passive end prestressing losses on the two sides of the cantilever under construction. As tensioning at both ends would not improve the prestressing effect on the critical areas around the centre of each tendon over the pier, it was ruled out to optimise resources and tensioning times.

The bottom prestressing, which lies in a straight line in the plan view, is anchored on the bottom of the girder. In the sections where the bottom tendons are anchored, the bottom slab is strengthened with transverse ribs to prevent it from having to resist the local bending generated by the prestressing local forces.
In the outer spans, built over a falsework, the prestressing in the web is parabolic whereas in the bottom slab it runs along a straight line. Since the span lengths are tightly conditioned by the shape of the valley, the outer spans are not structurally proportionate. To accommodate the resulting positive and negative moments generated in the sections over piers 1 and 6, the total prestressing loads in these sections had to be centred by extending the straight prestressing in the bottom slab. The extension was then used as continuity prestressing for connection to the adjacent segmentally built section.
5Design5.1Defining actions and legislation5.1.1General regulationsThe structure was designed to AASHTO LRFD 2004 specifications, supplemented by Mexican legislation on the definition of heavy vehicle live load and seismic and wind action.
5.1.2Wind actionAs wind action is not sufficiently defined in road legislation, it was supplemented with:
- •
the Mexican Federal Electricity Commission's “Manual de Diseño de Obras Civiles. Diseño por viento”,
- •
the U.S. National Oceanic and Atmospheric Administration's (NOAA) hurricane records,
- •
a number of wind tunnel tests.
The preliminary design contained local wind studies defining a very low wind velocity. After a review of the NOAA's hurricane records, a design velocity (200-year return period maximum velocity 10m off the ground in open terrain with few obstacles) of 160km/h was established. That value is equivalent to an IAP 98 (Spanish code on actions to be considered in wind design) reference velocity of 27m/s.
5.1.3Seismic actionSeismic action was defined for a spectrum specifically established for the viaduct by the Mexican Communications and Transport Secretariat. The acceleration peak in that spectrum was 0.36g. Due to the structure has high fundamental period (3.4s longitudinally and 5.3s transversely), its substructure would be affected by actions ranging from 0.10 to 0.15g.
5.2Wind testsThe most thorough understanding possible of the structure's reaction to wind was deemed necessary for a number of reasons, including structure size, the difficult topography, the fact that wind action was the determinant for dimensioning the piers and the need to ascertain the possibility of the appearance of aerodynamic instability. To that end, wind tunnel tests were conducted to determine the performance of cross-sections of some bridge elements, vehicle drag, local wind behaviour and structural behaviour during construction. Tests on the finished bridge as a whole were not felt necessary, for the structure is not subject to aeroelastic phenomena.
The section model tests were conducted in the wind tunnel at the Ignacio da Riva Institute, a body under the aegis of the Technical University of Madrid's School of Aeronautical Engineering [3], while the global model tests were performed at Force Technology, a Danish firm [4,5].
5.2.1Section model testsThe drag coefficient for the deck was determined with section models tests run on the sections with the maximum and minimum depths. The mean value found, 1.6, was 3% lower than obtained by applying Eurocode 1 [6] and IAP 98 [7], which yielded a value of 1.64, and substantially lower than the 2.0 specified in Mexican legislation [8]. A conservative design value of 1.7 was adopted.
A number of models were analysed in the wind tunnel to determine the drag coefficient for the piers. Mean drag coefficients for different wind directions were calculated for both a scale model of pier 4 and a representative cross-section from the upper part of that pier. Coefficients of around 1.54 were obtained for both models, a value slightly lower than the 1.60 specified by the Mexican roads legislation, which was the coefficient ultimately applied (Fig. 12).
5.2.2Wind drag on vehicles
At a height of 200m, wind velocity may often exceed the speed regarded as safe for traffic, particularly lorry traffic. A section model test was therefore run in the wind tunnel to analyse lorry performance on the deck in a cross-wind and verify the effectiveness of a wind barrier. The test modelled a lorry travelling on the deck, assuming the presence of a New Jersey type barrier with a built-in wind barrier similar to the one used on the Millau viaduct (Fig. 13).

The findings showed that the wind barrier lowered the lorry overturn moment by 22%, a decline regarded as fairly insignificant, given that the shielding afforded by New Jersey type barriers reduces the vehicle drag problem substantially. In light of the test results and the lack of precedents in Mexico for this type of barriers, no wind shield was installed.
5.2.3Local wind behaviourGiven the special location and topographic conditions prevailing in the area surrounding the viaduct, a test was conducted to ascertain local wind behaviour. The test was run on a 1:1500 scale model of the area within a 4.5-km radius of the viaduct location (Fig. 14).

The test consisted in measuring the three components of wind velocity and turbulence at 22 points in the space occupied by the pier and deck (in the absence of these structures) for 12 geostrophic wind directions (at high altitudes).
The findings showed that for nearly all the geostrophic wind directions, the valley channelled the wind in the mid-canyon direction. Hence the maximum local wind velocities were generated at a 60° angle to a line perpendicular to the mean direction of the deck.
Inasmuch as the particular topography of the site, in a valley with meanders and steeply sloping walls, modifies the wind velocity profiles at high altitudes substantially, local wind velocity and direction vary depending on the direction of the surrounding walls. The shield effect generated by the wind against the valley wall causes velocity to rise considerably at the summit. For that reason, the maximum wind velocity at the deck elevation was recorded in the outer piers, where it was over twice the value expected due to the height of the shaft.
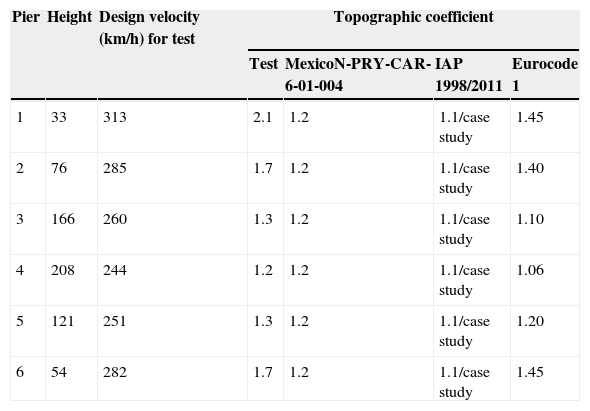
This effect, quantified as the topographic coefficient in Eurocode 1 [6], was determined from the test results. As Table 1 shows, the values calculated were much higher than found using the existing legislation, an observation that supports the need for testing in structures located in complex topographies.
Comparison of topographic coefficients.
| Pier | Height | Design velocity (km/h) for test | Topographic coefficient | |||
|---|---|---|---|---|---|---|
| Test | MexicoN-PRY-CAR-6-01-004 | IAP 1998/2011 | Eurocode 1 | |||
| 1 | 33 | 313 | 2.1 | 1.2 | 1.1/case study | 1.45 |
| 2 | 76 | 285 | 1.7 | 1.2 | 1.1/case study | 1.40 |
| 3 | 166 | 260 | 1.3 | 1.2 | 1.1/case study | 1.10 |
| 4 | 208 | 244 | 1.2 | 1.2 | 1.1/case study | 1.06 |
| 5 | 121 | 251 | 1.3 | 1.2 | 1.1/case study | 1.20 |
| 6 | 54 | 282 | 1.7 | 1.2 | 1.1/case study | 1.45 |
The test findings were used to determine the design wind velocity and direction of wind action on each point in the structure.
5.2.4Structure under constructionA wind test on the bridge during the final stages of construction was deemed necessary to check for the possible appearance of aerodynamic instability, in light of the dimensions of the viaduct. That involved testing a 1:300 scale model of part of the terrain surrounding the bridge and the bridge itself before any of the closure segments were cast, i.e., with the piers behaving as free cantilevers. This model was tested under turbulent wind conditions (Fig. 15).

The findings verified that all the variables (such as displacements and moments) rose steadily with rising wind velocity with no deviations or signs of instability.
A single pier, with no surrounding terrain, was subjected to a laminar wind flow to study the possible appearance of vortex shedding-induced excitation (Fig. 16). Further to the results, such a development could not be ruled out. This was regarded as a very remote possibility, for as the bridge is set in a highly curved valley, non-turbulent wind would be unlikely to reach the structure. No specific measures were therefore taken in this respect.

No aeroelastic developments arose during construction.
5.3Structural analysis5.3.1General modellingThe sharp curvature of the deck prompts interaction between the longitudinal and transverse forces on the structure. Consequently, the engineering was conducted with 3D frame models of the entire structure to study its performance both in service and during construction. The models were developed with GT STRUDL software, supplemented with proprietary pre- and post-processing programmes for entering actions and verification, respectively. Linear elastic calculations were performed with these models to check behaviour in SLS and ULS analysis.
Models were developed for every construction stage to determine the reaction both to the actions envisaged (such as self-weight, unbalanced situation during construction, wind) and to accidental events (such as earthquake or travelling formwork fall).
The greatest instability-induced problems in piers are known to arise during construction, before the decks are inter-connected. Non-linear analysis of the cantilevering piers was performed with PYRUS 5 software, which models both geometric and material non-linearity.
5.3.2Special studies5.3.2.1Pier 4 foundationIn the pier 4 foundation, the gravel stratum penetrated by the piles varies in depth from 0 to 20m. As a result, the piles are not uniformly stiff and when the pier is exposed to horizontal action, the shear on each pile varies. Moreover, since the centre of the shear stress in the foundation does not concur with the pier centreline, the direction of the shear stress on the piles differs from the direction of the external action. This same non-uniform stiffness problem arises in connection with vertical actions, translating into non-uniform distribution of the vertical action on the pier.
A non-linear model was developed to analyse the global performance of the foundation, in which each pile was modelled in the form of a stiff vertical bar of calibrated length, restrained by the pile cap and resting at the bottom on five non-linear springs (one each for the three directions of displacement and the other two for longitudinal and transverse rotation). This equivalent non-linear member generated the same head forces and displacement as the real pile.
Defining such equivalent piles called for a detailed analysis of the individual behaviour of each one and of its interaction with the surrounding geotechnical profile.
Lateral behaviour was calibrated by modelling the pile as a bar resting transversely on elastic springs representing ultimate limit state behaviour; terrain stiffness and bearing capacity for each depth were calculated from the Vesic [9] formula as shown in Eq. (1):
where kb is the modulus of subgrade reaction, E its modulus of elasticity, υ the Poisson ratio and D pile diameter.
The properties of the springs and length of the equivalent bar needed to represent the reaction of an individual pile to horizontal loads and unit moments can be deduced from the results of applying such loads and moments to its head.
A finite elements model run with Plaxis, specific geotechnical software, was used to reproduce the behaviour to a vertical load by a single pile perforating the strata of healthy and altered rock underlying pier 4. The model showed that the end bearing capacity began to develop at the same time as shaft friction capacity and did not develop fully until the shaft developed its full friction bearing capacity (Fig. 17).

The pile end bearing non-linear behaviour was determined with this Plaxis model. The findings were entered in a frame model for a free-standing pile in which each pile was modelled with several non-linear vertical springs representing shaft friction stiffness and one non-linear spring representing the end bearing stiffness. This model delivered a behaviour pattern for the non-linear vertical spring which was then applied to the simplified model for each pile in the general model of the foundation.
Sonic test piles revealed construction problems that called for building additional piles, an issue discussed in a later section. The additional piles were consequently entered in the model to verify foundation behaviour as a whole, and the properties of the equivalent bars were recalculated based on an analysis of the single pile models for each pile. In addition, the anomalies detected in the initial piles were modelled conservatively based on the estimated damage.
The volume of the pile cap and the variability of the groundwater level in the rainy and dry seasons called for an in-depth study of both the pile cap weight for seismic purposes and of hydrostatic pressure when the cap is submerged, which would reduce compressions on the piles.
5.3.2.2Pier segmentsAs noted above, since the piers vary widely in height, a substantial proportion of the horizontal actions is absorbed by the shortest members, reducing the load on the taller central piers. Under such conditions, careful attention to the transfer of forces from the deck to the piers is imperative, particularly for piers 2 and 5, where pierhead forces are very high.
Forces are transferred from the deck to piers 2–5 across the 0 segments, which are fitted with two slanted diaphragms that together form a triangular structure.
Stress transfer from the deck to the pier is clearly spatial [10]. A three-dimensional finite elements model with flat, plate-like elements was used to study and design the reinforcement for that region (Fig. 18). The stresses and load flows found with those models were subsequently compared to strut and tie schemes to ensure structural performance under ultimate limit state conditions.

The process of the strut and tie models was:
- -
in finite elements, obtaining the main stress on each element in the 0 segment generated by each load on the pierhead considered: axial, or the longitudinal or transverse bending moment,
- -
determining the mechanisms whereby these loads are transferred from the deck to the pierhead, given that part of the load is transferred directly across the box girder elements (webs and slabs) and part over the triangular cell comprising the pier, the slanted diaphragms and the bottom slab on the girder,
- -
finding the share in per cent of each mechanism in unit load transfer,
- -
strut and tie modelling of each transfer mechanism and verifying the reinforcement ratios needed.
The viaduct is located in an area characterised by a complex orography that called for building a 5-km access road up the valley wall through a tropical forest. With a 700-m difference in elevation from one end to the other, the access road had a mean grade of 14%, although in some sections it sloped by up to 35% (Fig. 19).

As the road was built on the Mexico City side, a provisional Bailey-type cable-stayed bridge with an 80-m span had to be erected to carry traffic to the other side (Fig. 20).

Considerable excavation was required to build the footings because of the steep slopes on the valley walls and the size of the foundations, most prominently for pier 2, where 76,000m3 of materials were removed from excavations up to 50m deep (Fig. 21). Part of the land excavated was restored with fills, up to 15m high. Significant volumes were also involved, with a maximum of 22,000m3 in pier 5; the lower parts of the pier shafts were strengthened to be able to resist the transverse bending moment generated by the thrust from these fills.
6.2Foundations6.2.1Pier 4 foundations
Viaduct construction began in March 2009 with the pier 4 foundations.
Pier 4 is sited on a meander in San Marcos River in a region where heavy rainfall occasions variations in the water level on the order of 10m. A review of the various options led to a decision to build the foundations behind a 180-m long, 5-m high temporary embankment where work could proceed while the flow rate did not exceed 1000m3/s. This ensured a 6-month construction window from December to May.
First, 64 1.5-m diameter piles were bored at least 2.5m into the healthy rock. In the alluvial soil strata the piles were cast with temporary casings. Because of the slant on the rock surface, the piles varied widely in length, from 9 to 25m. To prevent any reduction of the end bearing capacity, a maximum 3-m difference in toe elevation between any two adjacent piles was established.
In light of the large number of piles involved, the design called for sonic testing as soon as the first few were cast to detect and correct possible problems in the construction procedure. A series of hindrances retarded the tests, which were not conducted until all the piles had been finished in July 2009.
An analysis of the sonic findings showed that only 14 piles (22%) were unaltered. The alterations in the remainder adopted a variety of forms. The area affected also varied: problems were identified in the mid sections, at the crown and in the toe. The cause of these problems could not be clearly established: on the one hand, since the foundation was located in a meander, its presence induced a very strong hydraulic gradient in the direction of the chord underneath the foundations and hence a current in the alluvial layer that may have cut through or washed away the fresh concrete during construction. On the other, several piles were found to have large amounts of fine alluvial materials at the bottom, possibly denoting defective removal and cleaning. The problems at the crown may have been attributable to contaminated concrete.
Concrete cores were obtained from the affected piles to verify the actual scope of the problems and the safety of each was recalculated in light of the estimated loss of bearing capacity. In all, 53% of the piles built were found to be acceptable.
Repairing procedures consisting of the injection of cement grout were implemented in the piles with insufficient capacity and cores were subsequently bored to verify the effectiveness of these measures. This work had to be suspended due to the rise in the water level of the river. After it was resumed, the injection operations were completed in March 2010. As these measures proved unable to repair a sufficient number of piles to ensure the necessary structural performance of the foundation, in May 2010 the foundation was strengthened with an additional fourteen 1.20-m diameter piles interspersed in the original layout (Fig. 22).

To ensure proper construction, the new piles were designed with permanent casing throughout. They are consequently not friction piles, but carry loads at the toe only. This procedure avoided water currents and made it easier to ensure non-contamination of the concrete. The trade-off is that these are more flexible members as they work at the toe only. They consequently had to be modelled with the methods described above to suitably analyse their effectiveness. These supplementary piles were completed in June 2010.
Pouring the 6000m3 of concrete needed to build the 34m×34m×7m pile cap posed a problem in connection with controlling the temperature, for the concrete had to be kept under 80°C to prevent the possible formation of secondary ettringite. A number of solutions were studied: casting by stages, deployment of refrigeration pipes, use of low heat of hydration cement and inclusion of ice chips.
As casting was initially to be a two-stage process, the pile cap was fitted with the necessary continuing steel for each stage. The need to make up for lost time and avoid further months-long suspensions in pier construction due to rises in the water level and subsequent flooding determined continuous concrete casting in the pile cap using low heat of hydration cement and replacing part of the mixing water with ice flakes.
Concrete was cast continually for 4 days, monitoring the heat of hydration with thermometers installed inside the material. When casting was completed, the top of the cap was protected with styrofoam to reduce the thermal gradient between the core and the surface (Fig. 23). The operation was conducted without incident and without exceeding the maximum setting temperature. Construction on the pier 4 shaft could therefore be initiated before the onset of seasonal flooding.
6.2.2Other foundations
All the other piers have shallow foundations and are located far enough from the river to elude the problems that arose in pier 4.
The greatest challenges arose around the excavations needed to access the elevations defined for the foundations and provide suitable protection for operations conducted on such steep slopes. The final elevations for the foundations were defined and the respective outcropped rock approved in situ.
Pier 5 has the largest footing, measuring 26m×22m and a depth of up to 3.5m, for a total volume of 1662m3. All the piers footings were cast continuously, and all necessary measures were adopted to prevent overheating during setting.
6.3Piers erectionConstruction of the total 660m of pier shafts was the object of intense study by the worksite team. To minimise operations at high elevations, the reinforcement was pre-assembled at the base of each pier. To that end, separate reinforcement panels were designed and built for each side and then joined with threaded connectors. To reduce the number of connectors and expedite assembly, each reinforcement panel measured two climbing cycles high and one half of a pier side wide (the latter to accommodate crane limitations) (Fig. 24).

The shafts on main piers 2, 3 and 5 were built using conventional climbing formwork with a shutter height of 5.0m (Fig. 25). The formwork was adjusted on the ground with each new climbing cycle to accommodate the variations in pier sections, i.e., it had to be lowered and re-hoisted into position after each cycle. Given that modus operandi and the fact that the reinforcement was pre-assembled for two climbing cycles, the mean construction time per cycle came to 9 days, with a minimum of 5 days in some cycles.

PERI self-climbing formwork with a height of 4.5-m was used on pier 4 (Fig. 26). Here also, the reinforcement was pre-assembled for each pair of climbing cycles, whereby pier construction proceeded at a mean rate of 6 days per cycle, with a minimum of 4 days in some of the cycles.

In piers 3–5, with heights upward of 120m, double car lifts were installed (Fig. 27).
6.4Deck
The main deck spans were built using three pairs of travellers supplied by Freyssinet México with a capacity of up to 200t per segment (Fig. 28). Segment size was adjusted in the design stage to optimise the use of this travelling formwork. Each section of segmentally built deck was broken down into one 13.20-m long zero segment resting on the pier, erected with a special formwork, and 20 symmetrical segments per side erected with the traveller. The length of these segments ranged from 2.7m nearest the piers to 5m at mid-span.

The construction schedule for the three sets of travelling forms was as follows:
- 1.
deck over pier 2, completed in February 2012,
- 2.
nearly simultaneously, the decks over piers 5 and 3, completed in June and July 2012, respectively,
- 3.
deck over pier 4 completed in September 2012 with the travellers used on pier 2.
In other words, work was conducted simultaneously on the decks over piers 3, 4 and 5 (Fig. 29). Since the pier 4 deck conditioned construction time, productivity was maximised there, systematically erecting one segment every 5 days, although the mean rate in this section was 8 days per segment due to a series of minor incidents.

The closure segments construction schedule was adjusted to the worksite team's organisational requirements. Locking was begun in span 2 in July 2012 and completed in span 5 in November 2012.
The concrete pumping facility used during deck construction proved to be of key importance to the works. In pier 4 the concrete had to be pumped first vertically to a height of 218m and then up to 90m horizontally for delivery from the base of the pier to the segments under construction at the far end of the cantilever. The pump deployed was among the most powerful on the market: a 640-HP Putzmeister BSA 1400.
The outer span sections comprised the span itself plus a 6.5-m cantilever, both built with falsework.
Closures were the most complex operation, for the closure segment had to provide a perfect match to both end segments on the two cantilevers to be joined. This operation was most sensitive on the two outermost central spans: i.e., where the pier 2 arm connected to the span on pier 1 and the pier 5 arm to the span on pier 6. The complexity was due to the significant difference in stiffness between the cantilevered decks and outer spans. Moreover, sunlight-induced vertical oscillations of up to 5cm/day were measured in the cantilever, while the deck over falsework underwent no fluctuation. This problem was solved by blocking the two ends at the top with steel beams and resting the closure segment formwork on an extension of the falsework. This procedure reduced movements in the fresh concrete during casting.
To reduce possible deck cracking, the most suitable time of day to block the segment and cast the concrete had to be determined to limit the intensity of tensile stress and retard its appearance until the concrete had developed sufficient strength.
Locking the ends of the segmental deck sections was less problematic because the two parts to be connected had similar stiffness values. In these cases the two ends were tied with the rails used by the travellers, whose structure served as the formwork to pour the concrete in the closure segment (Fig. 30).
6.5Geometric monitoring
Geometric monitoring during construction was an arduous task due to the absence of nearby topographic references and poor visibility due to the fog that frequently covered the valley (Fig. 31).

Geometric monitoring of the deck entailed devising and adhering strictly to a positioning plan for each segment. In addition, the segments were subject to camber in the plan view because of the bridge curvature and the height of the piers. Transverse movements of up to 120mm were foreseen at the pierheads during design stage. The maximum vertical precamber in the deck was 250mm.
Precambers were assessed with software developed by the FCC Bridges Department to supplement commercial structural engineering software. This software, which calculates the deferred effects of concrete creep and shrinkage step by step over time, has been successfully used in the design and geometric monitoring of many bridges built by FCC.
Steel rods were set into the joints at each segment to verify the fluctuations in its geometry over time and facilitate geometric monitoring. These rods were monitored topographically after each pair of segments was built.
The geometric error in the closure segments was under 2cm with just two exceptions, in which one of the ends had to be ballasted to reduce the relative error and ensure an acceptable match.
7ConclusionsGiven the conditions imposed by the valley and the road layout, the best structural solution to span the river was a girder bridge with very tall piers. The viaduct ultimately built has three piers over 100m tall, the most prominent being pier 4, whose 208-m shaft is one of the tallest in the world (Fig. 32).

The article discusses some of the most complex issues that had to be addressed during the design stage: wind action, the pier 4 foundations and 0 segment design.
A number of difficulties arose during the construction of the pier 4 foundations, but once surmounted, the rest of the structure was erected with no material incidents and very high performance in both pier climbing cycles and segmental deck construction.
The main bridge structure was completed in November 2012 and after other road works reached conclusion, the respective section of motorway was opened to traffic in September 2014.
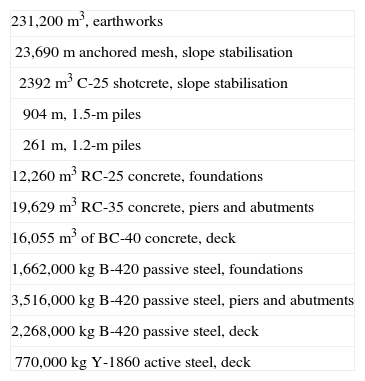
8Quantities| 231,200m3, earthworks |
| 23,690m anchored mesh, slope stabilisation |
| 2392m3 C-25 shotcrete, slope stabilisation |
| 904m, 1.5-m piles |
| 261m, 1.2-m piles |
| 12,260m3 RC-25 concrete, foundations |
| 19,629m3 RC-35 concrete, piers and abutments |
| 16,055m3 of BC-40 concrete, deck |
| 1,662,000kg B-420 passive steel, foundations |
| 3,516,000kg B-420 passive steel, piers and abutments |
| 2,268,000kg B-420 passive steel, deck |
| 770,000kg Y-1860 active steel, deck |
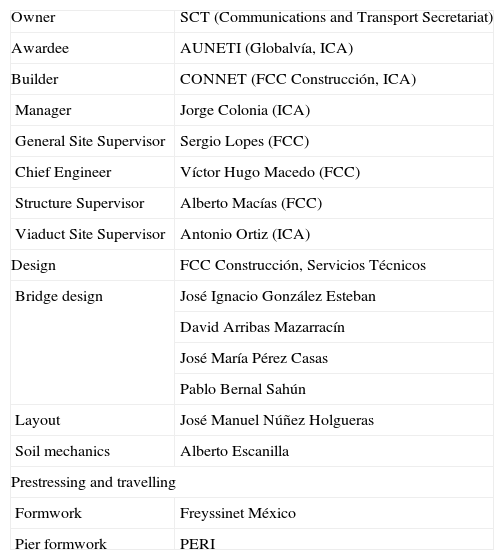
| Owner | SCT (Communications and Transport Secretariat) |
| Awardee | AUNETI (Globalvía, ICA) |
| Builder | CONNET (FCC Construcción, ICA) |
| Manager | Jorge Colonia (ICA) |
| General Site Supervisor | Sergio Lopes (FCC) |
| Chief Engineer | Víctor Hugo Macedo (FCC) |
| Structure Supervisor | Alberto Macías (FCC) |
| Viaduct Site Supervisor | Antonio Ortiz (ICA) |
| Design | FCC Construcción, Servicios Técnicos |
| Bridge design | José Ignacio González Esteban |
| David Arribas Mazarracín | |
| José María Pérez Casas | |
| Pablo Bernal Sahún | |
| Layout | José Manuel Núñez Holgueras |
| Soil mechanics | Alberto Escanilla |
| Prestressing and travelling | |
| Formwork | Freyssinet México |
| Pier formwork | PERI |