


The shear resisting actions in reinforced concrete elements without transverse reinforcement is analyzed by means of optimized strut-and-tie models with concrete ties. Biaxial failure criteria are used for uncracked and cracked regions. The stress transfer capacity across cracks is accounted for by including the inclination between the stress field and the crack opening and sliding. An experimental case-study is analyzed. It is shown that that different shear resisting actions can occur in different regions of the beam. The strut-and-tie scheme in the critical region is consistent with the Multi-Action Shear Strength Model (MASM).
En este artículo se presenta un estudio sobre los mecanismos resistentes a cortante en elementos de hormigón armado sin armadura transversal, basado en la optimización de modelos de bielas y tirantes, con tirantes de hormigón, y criterios de rotura biaxiales para la zona fisurada y no fisurada. Se comprueba la capacidad de transmitir tensiones de forma oblicua a las fisuras según la abertura y deslizamiento de la fisura. Se analiza un caso experimental y se observa que se pueden dar diferentes mecanismos resistentes simultáneamente en distintas zonas del elemento. El esquema de bielas y tirantes de la zona crítica es consistente con el modelo de cortante multi-acción (MASM)
Shear in concrete has been studied since several decades without achieving consensus about the resistant model for design. Although, agreement exists in that resistance involves several actions, with at least, the actions of the uncracked zone, aggregate interlock, residual tension of cracked zone, the longitudinal reinforcement and transversal reinforcement [1]. As quantifying these actions is difficult, most practical models available in codes involve some empirical component. However, it seems that models that assume different determinant actions can produce reasonably similar results. Historically, this has motivated debates that, far from looking for consensus and complementarity in the similarities, the models are presented as incompatible.
This paper deals with the analysis of this problematic with a novel, yet relatively simple, approach by means of the analysis of strut-and-tie (SAT) schemes of shear tests; hence, internal and external equilibrium is evident. In Schlaich et al. [2], the existence of concrete ties in SAT models was suggested, particularly in elements without transverse reinforcement loaded in shear, reinforcement anchorage and uncracked zones. The physical development of tensile stresses after cracking is studied here based on the model of Walraven [3] for aggregate interlock (AI).
Given the variability of the capacity of the concrete ties, a single SAT scheme is not adequate for explaining all load stages. Hence, topological optimization [4] is applied to the SAT scheme by means of the Gradient Descent Method (GDM) [5]. This methodology is applied to an experimental case without transversal reinforcement. It is found that the relevance of each resisting action changes in each zone of the beam, depending on the crack inclination and opening. Different resisting actions, therefore, co-exist in space and time. The action that exceeds its capacity first controls the shear resistance of the element. This explains, in part, the diversity of hypotheses in the existing models. However, it also evident that some of these models are partial views of the same process. Hence, if posted properly, the theories should be complementary to each other. The method is applied to investigate the feasibility of a pure AI beam model and the Multi-Action Shear Model (MASM).
2Case studyThe specimen under consideration is a rectangular RC beam without transversal reinforcement from [6]. Although the campaign aimed at investigating the effects of high fines contents in the shear strength, the selected element is a reference beam with a normal fines content (175kg/m3), corresponding to specimen C175-SM. The beam geometry and test configuration are shown in Fig. 1. The shear span ratio (a/d) is 3.0.

Concrete strength the day of the test (90 days) was fc90=31.3MPa, the elastic modulus was Ec=32.4GPa. The tensile strength was estimated as fct=3.13MPa, and average yield stress of the reinforcement is fy=550MPa.
The crack pattern at failure is shown in Fig. 2. It can be observed that the crack inclination in the central part is relatively vertical (∼78°). However, close to the support, an inclined crack develops with an angle of 46° in the mid-height of the section. In the bottom of the beam the shear crack connects to a bending crack and, at an advance load stage, a horizontal crack develops at the height of the longitudinal reinforcement, denoting bond slip in this region.
 scheme.")
The experimental failure load was 145.5kN, producing a shear force of 87.24kN. When accounting for the self-weight of the beam, the shear force at 0.60m (where the transition of the shear crack to the almost horizontal crack in the compression head takes place) is 88.76kN.
3Analytical shear strength according to the MASMShear resistance can be explained by a number of actions that can be superimposed; hence the problem is highly redundant and non-linear. Fig. 3 shows possible internal forces to balance a moment variation (shear) between sections 1 and 2. In a pure beam-action (Fig. 3b), the lever arm is constant and a variation of force is needed, although it needs shear stresses to cross the formed cracks. Conversely, in a pure arch action (Fig. 3c), shear stresses don’t reach the reinforcement, thus there is no variation of forces, only of the lever arm.

The Multi-Action Shear Model (MASM) was developed in [7] assuming that, in the first stage, beam action is predominant but, after cracks widen, the mechanism that transfer stresses across cracks softens, and the combined beam-arch action develops in the critical zone (Fig. 3d). The summary of the MASM is presented in Fig. 4. A simplified version of this theory for code applications was further developed in [8], referred as Compression-Chord Capacity Model (CCCM).

By applying MAAS to the case study, the capacity of the different actions is:
- •
Compression chord: Vcc=77.0kN (83.9%)
- •
Cracked web: Vw=14.8kN (16.1%)
- •
Longitudinal reinforcement: Vl=0 (0%)
- •
Transverse reinforcement: Vs=0 (0%)
The predicted ultimate shear strength is 91.8kN (Vtest/Vana=0.967).
4Internal equilibrium analysisIn order to investigate internal equilibrium, a SAT model was developed with an internally isostatic truss, where concrete tension ties are needed. A topological optimization [4] procedure was implemented based on the GDM [5] that varies the coordinates of the nodes. Hence, the geometry of the truss can be modified as to minimize the difference between the vertical component of the forces in the bars that represent Vcc and Vw. This approach will be used to investigate if it is possible to produce an equivalent strut-and-tie scheme that explains the same shear share in the inclined cracked zone while satisfying internal and global equilibrium. In the following, all trusses are loaded with the analytical shear force at failure VR=91.8kN.
4.1A pure aggregate interlock systemA truss with constant depth, i.e. pure beam action, is first analyzed. After cracking, this system is equivalent to pure aggregate interlock action (Section 3). Inclined concrete ties and struts are needed to transfer the shear forces from top to bottom. The truss forces, when the experimental failure load (91.8kN) is applied, are shown in Fig. 5 and compared against the crack pattern.

In order for this model to be valid, concrete ties should cross the developed cracks. In the region farther than 700mm from the support, ties are inclined at 67° and cross cracks inclined at 78°, i.e. the angle between the tie and the crack is approximately 35°. The Walraven's AI model [3] can be used to investigate if this shear transfer is possible, by means of coupling crack opening (ω) and slip (Δ), as in Eqs. (7) and (8). Considering the coexistence of both tension and compression stress fields in this region, the stresses in the plane of the crack are: σr=−0.46MPa (tension) and τr=1.09MPa (point 1 in Fig. 6). The stress can be transferred by the crack up to crack widths of 0.3mm or smaller. However, for a crack width up to 1.5mm, this capacity is only deteriorated 27%, which would allow for certain redistribution through variation of the ties inclination; however, for larger crack widths the deterioration is abrupt. Therefore, AI action is considered capable of transferring the shear forces in this zone of the beam.


Within 500mm from the support, there exists a tie that crosses a crack inclined 46°. The stresses in the crack plane are σr=−1.62MPa (tension) and τr=0.06MPa (point 2 in Fig. 5). Although the tie and strut forces are similar to those in the zone with 78° cracks, because of the inclination at which the crack formed, its plane is basically subjected to direct tension, with a minor shear stress in the plane. Fig. 6 shows that this stress state cannot be transferred through the crack plane, even for a crack width as small as 0.01mm. Therefore, this region is more critical than the 78° cracks region.
Finally, there is a TTC node in the bottom part, within 200mm from the support, where the crack pattern shows a horizontal bond crack (point 3), Fig. 3. The stress state in the crack plane is σr=0MPa and τr=1.24MPa. It is evident that the principal tensile stress in this point is σ11=1.24MPa, which is less than the tensile strength (3.1MPa). Furthermore, assuming that the horizontal crack has formed, the shear stress in the crack plane could be able to transfer the force of the model up to a crack width of more than 1.5mm.
From this analysis, it can be concluded that the pure beam action in the whole span, based on AI for the shear resistance, cannot explain the resisted shear force (91.8kN). The critical component is the tie in the 46° inclined shear crack region, which is transferred by almost direct tension.
4.2Plausible strut-and-tie schemes with combined arch and aggregate interlock actionsThe Gradient Descent Method (GDM) was used to optimize the geometry of the SAT truss to make it consistent with predicted share of shear resistance predicted by the MASM. In particular, the geometry of the reference truss (Fig. 2) was modified in order to minimize the difference in the share of resisting actions with respect to the prediction of the MASM. Further, the resulting strut-and-tie mechanisms will be investigated with the same approach as in the previous section to determine if they are plausible. Concretely, the vertical component of bar 8–9 should match Vcc=77kN (compression chord capacity) and the vertical component of bar 3–8 (cracked concrete web) should match Vw=14.8kN.
The GDM showed that there are more than one possible solution, depending on the initial perturbation applied to the truss, all complying internal equilibrium. Fig. 7 shows three plausible SAT schemes that matches the share of shear resisting actions in the region of the inclined crack that predicts the MASM. In Fig. 7a–c, the red line denotes the position of the neutral axis computed from elastic theory. Fig. 7d shows the evolution of the vertical component of bars 8–9 (Vcc) and 3–8 (Vw) during the iteration of the optimization process. It can be seen that the shear of the compression chord increases from 10% in the initial perturbation to almost 75%, while the share of the bar 3–8 (Vw) reduces from 80% to almost 15%.
 and evolution of shear resistance share through optimization of iterations of truss c).")
In all SAT models of Fig. 7, a lower lever arm is needed in the region of the inclined crack than to the right of the crack, as expected from Fig. 3b. This indicated that a combination of beam and arch actions exists in this zone. Among the SAT models in Fig. 7, the one in Fig. 7.c produces reduces the inclination of tie 8–3 with respect to the crack plane, hence producing higher shear stresses in the crack. Moreover, the position of node 7 seems to be more adequate as the length of ties and struts are shorter in the region close to the support. Therefore, the capacity of model 6c will be analyze in the following. This model is shown in more detail in Fig. 8.

In the zone with 78°cracks, the stress forces and inclination are identical to those of Fig. 5, hence the verification is identical to that of Section 4.1. As cracks width increases, crack transfer capacity degrades in a relatively uniform manner, as shown in Fig. 9. In fact, for w=0.6mm the tie capacity is 90% the demand and for w=1.5mm the capacity is 75% of the failure load.

In the region between 260mm and 600mm, the inclined shear crack develops. According to the hypotheses of MASM, this force is mainly resisted by residual tension and it is evaluated in terms of fracture energy and aggregate size. As the estimated force in Vw is MASM already assumes these degrading process, the tie capacity is consistent with the damage state.
Nevertheless, if the capacity of the crack to transfer the forces is investigated by means of the same AI model used above, one can verify whether this capacity is consistent. The stress state in the plane of the crack (inclined 46°) is σr=−0.27MPa (tension) and σr=−0.27MPa (point 2 in Fig. 7). As observed in Fig. 10, this stress state is almost of direct tension; shear in the crack plane is 16% of the tensile stress. However, because the tensile force magnitude of the optimized truss is smaller than in the original one, the AI model predicts that the stress combination can be transferred through the crack up to w=1.64mm. Therefore, the capacity of the region is adequate.

The horizontal crack within 260mm from the support has a principal tensile stress σ11=−2.06MPa (tension), which may not be enough for producing the crack by itself. However, it should be noticed the increment of this stress with respect to the reference geometry with pure beam-action of section 4.1 (1.24MPa), which results from the lower position of node 8. Furthermore, the presence of the bending crack close to that node, may weaken this zone, activating the horizontal cracking. If this is the case, the node strength will depend on the shear capacity of the horizontal crack.
In the plane of the crack, the stress state is σr=0MPa and τr=2.32MPa. The shear stresses can be transferred in this node if the crack width is not larger than w=0.15mm. Otherwise, the tension tie capacity will degrade as function of the crack width. As the degradation is rather smooth (Fig. 11), some redistribution can take place; although, capacity reduces abruptly at w=1.6mm.

This failure mode is not explicitly considered in the current version of the MASM. However, it is evident that the two mechanisms are linked, as both the increment of shear stresses in this node and the shear force carried by bar 8–9 are activated by the lower position of node 8, together with the subsequent reduction of the demand in tie 3–8 that crosses the inclined cracked zone. Furthermore, if the horizontal crack exceeds 1.5mm, this node may activate failure.
One hypothesis of the MASM is that failure of the beam takes place when biaxial stress state on the end of bar 8–9 (node 9) reaches Kupfer's failure surface, affected by the size effect of the model. The analysis of node 9 is considered next in detail. Fig. 12 shows the geometry considered for node 9 and its free body showing the forces applied to the different faces. Because the irregular polygon that results has two unloaded edges on the top, but the lower edges are loaded, it is evident that the stress state is not uniform in the node.

In order to analyze the stress distribution in this node, it will be subdivided into the four inner polygons shown in Fig. 12. The forces in the edge of each nodes are obtained from equilibrium analysis and shown summarized in Fig. 13. Here, the rectangular polygon (N° 3) is further subdivided into two triangles (3a and 3b), when triangle 3a has an unloaded edge on the top and triangle 3b has a loaded edge in the bottom to balance the tensile forces arriving from tie 4 to 9.

From the forces in Fig. 13, dimensions of the polygon and the constant width of the beam (b=225mm), the stress state in each subdivision of node 9 is computed and shown in Fig. 14, including the principal stresses, from which the material failure can be verified. The possible critical points in Fig. 14 are the triangular polygons 2, 3a and 3b.

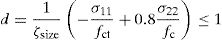
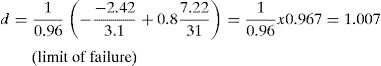
In [7] the verification of this node is carried out through the principal stresses in the critical point of the vertical side edge of node 3a, by considering an approximation of the shear stress distribution in this edge, the critical point is considered located at a distance 0.425x from the bottom edge, see Fig. 15. The principal stresses in this critical point are: σ11=−2.42MPa (tension) and σ11=−2.42MPa (compression). The distance to Kupfer's failure envelope [7] in the tension-compression region is:

The stress distribution of the vertical edge of triangle 3b is different from triangle 3a as it is only loaded with normal stresses but the bottom edge has shear and tension. However, in Fig. 15 it is shown that the principal stresses in this triangle are equivalent to does found in the critical point of triangle 3a.
The principal stresses in triangle 2 are shown in Fig. 14. Compared to polygon 3, this region is more loaded in tension than in compression and the stress state is almost touching Kupfer's failure surface (i.e. ratio stress state to resistance is 0.978). Therefore, it can be concluded that failure can take place in either zones 2 or 3, althoguh in this case, verification of zones 3 and 2 provide almost the same capacity.
5ConclusionsThere are multiple feasible strut-and-tie schemes that can explain internal equilibrium and the share of shear resistance actions assumed in MASM for inclined cracked elements without transversal reinforcement. It was shown that some combination of beam and arch actions is needed close to the region of zero moment in order to explain the shear capacity of the specimen. In this case study, at a distance larger than 550mm from the support (M/V>1.4d), equilibrium could be explained by a pure beam action and aggregate interlock, although this was not the critical region of the specimen.
The share of shear resistance action is variable in the different regions of the beam for a given load state. Therefore, there may exist simultaneous governing actions. Aggregate interlock can be an effective action to transfer the stresses through cracks in the zone of the beam where cracks are fairly vertical (78° as observed in this case study). However, when bending moment is small, cracks are more inclined (46° as observed in this case study) and the stresses components in the crack plane mostly produce direct tension, with fairly small shear in the crack plane. This prevents aggregate interlock to carry all the shear force produced if the beam action remains fully active.
If the inclined shear crack width remains within reasonably small values (e.g. smaller than 1mm), aggregate interlock will be capable of explaining 70–90% of the observed shear capacity, see Fig. 16. This justifies that apparently different theories provide not too different results in average, although scatter may be large.

The horizontal bond crack in the bottom part close to the support was explained by the truss model compatible with the MASM share of strength, but not by the truss for pure beam action and 100% aggregate interlock. In the analysis here conducted, it was observed that failure load of this node can be close to the failure load of the compression head. If horizontal crack width exceeds 0.3mm some redistribution should take place, e.g. by lowering node 7. However, in this case study, failure took place in the compression chord zone, as reported in [6].
The capacity of the compression in the top node can be controlled by node with and irregular shape, which may be studied by subdividing it into simpler regions. In particular, three critical zones were identified. In two of them (3a and 3b) the stress state was a combination of tension and compression in similar extents, corresponding to the vertical edges to the left and right of the node. In spite of the different load distributions in the two edges, the verification is equivalent in the two regions and can be considered similar to that made in [7] for the MASM.
Region 2 is more loaded in tension than in compression and its capacity is close to Kupfer's failure surface. Therefore, although failure was controlled by region 3, this node could control capacity in some cases. However, it should be noticed that this region is not bounded by the edge of the element and, therefore, may allow for larger dimensions according the to the SAT method that may result in lower stresses.
The authors want to acknowledge the financial support provided by the Spanish Ministry of Economy and Competitiveness (MINECO) and the European Funds for Regional Development (FEDER), through Research projects: BIA2015-64672-C4-1-R and BIA2015-64672-C4-3-R.