


Adenocarcinoma is preceded by chronic atrophic gastritis, gastric intestinal metaplasia and dysplasia. Trefoil factor 3 (TFF3) is a peptide secreted by goblet cells, which is abundantly present in intestinal metaplasia.
AimTo evaluate the utility of serum TFF3 as a non-invasive biomarker for the diagnosis of intestinal metaplasia and gastric cancer.
MethodsSingle-center, cross-sectional study of 274 patients who consecutively underwent upper gastrointestinal endoscopy with gastric biopsies (updated Sydney system). TFF3 levels were measured in serum by a commercial ELISA kit. Patients with normal histology or chronic atrophic gastritis without intestinal metaplasia comprised the control group. In addition, 14 patients with invasive gastric cancer were included as a reference group. The association between TFF3 levels and intestinal metaplasia was assessed by logistic regression.
ResultsPatients with intestinal metaplasia (n=110) had a higher median TFF3 level as compared to controls (n=164), 13.1 vs. 11.9ng/mL, respectively (p=0.024). Multivariable logistic regression showed a no significant association between TFF3 levels and intestinal metaplasia (OR=1.20; 95%CI: 0.87–1.65; p-trend=0.273). The gastric cancer group had a median TFF3 level of 20.5ng/mL, and a significant association was found (OR=3.26; 95%CI: 1.29–8.27; p-trend=0.013).
ConclusionSerum levels of TFF3 do not discriminate intestinal metaplasia in this high-risk Latin American population. Nevertheless, we confirmed an association between TFF3 levels and invasive gastric cancer.
El adenocarcinoma gástrico es precedido por la gastritis crónica atrófica, metaplasia intestinal y displasia gástrica. Trefoil factor 3 (TFF3) es un péptido secretado por las células caliciformes, que están abundantemente presentes en la metaplasia intestinal.
ObjetivoEvaluar la utilidad de TFF3 sérico como biomarcador no invasivo para el diagnóstico de metaplasia intestinal y cáncer gástrico.
MétodosEstudio transversal, de 274 pacientes a los que se les realizó endoscopia digestiva alta consecutivamente con biopsias gástricas (sistema Sydney actualizado). Los niveles de TFF3 se midieron en suero mediante un kit de ELISA comercial. Los pacientes con histología normal o gastritis crónica atrófica sin metaplasia intestinal formaron el grupo control. Además, se incluyeron como grupo de referencia 14 pacientes con cáncer gástrico avanzado. La asociación entre los niveles de TFF3 y la metaplasia intestinal se evaluó mediante una regresión logística.
ResultadosLos pacientes con metaplasia intestinal (n=110) presentaron una mediana de TFF3 más alta en comparación con el grupo control (n=164), 13,1 vs. 11,9ng/ml, respectivamente (p=0,024). Sin embargo, la regresión logística multivariable no mostró una asociación significativa entre los niveles de TFF3 y la metaplasia intestinal (OR=1,20; IC95%: 0,87-1,65; p-trend=0,273). El grupo de cáncer gástrico tuvo una mediana significativamente mayor de TFF3 de 20,5ng/ml (OR=3,26; IC95%: 1,29-8,27; p-trend=0,013).
ConclusiónLos niveles séricos de TFF3 no permiten el diagnóstico no invasivo de metaplasia intestinal en esta población latinoamericana de alto riesgo. La asociación entre los niveles de TFF3 y el cáncer gástrico avanzado fue confirmada.
Gastric cancer (GC) is the fourth most common cause of cancer-related death worldwide, and one of the leading causes of cancer-related death in Chile.1 Delayed diagnosis of GC may contribute to a high mortality rate, as there are limited treatment options for its advanced stages. As such, early identification and surveillance of gastric cancer precursor lesions is imperative for diminishing the burden of this lethal disease.
Intestinal-type gastric adenocarcinoma carcinogenesis is a dynamic, inflammation-driven process that begins with Helicobacter pylori (Hp) induced chronic superficial gastritis and variably progresses to chronic atrophic gastritis (CAG), gastric intestinal metaplasia (GIM), dysplasia and finally gastric adenocarcinoma.2,3 It is estimated that 0.25% of patients with GIM will progress to GC every year.4 In particular, incomplete-type (vs. complete-type) and corpus-extended IM (vs. antrum-restricted) may increase the risk of progression to GC.5 Since published recommendations for endoscopic surveillance of patients with GIM are not universal, the decision to endoscopically monitor patients should be made according to their specific risk factors.5–7 While many efforts have been done to develop GC screening strategies in high-risk Asian populations, the high cost and invasiveness of routine endoscopy have limited their application in other populations.8,9 In this context, noninvasive biomarkers could provide cost-effective strategies for screening for premalignant conditions and early-stage GC.
Trefoil factor 3 (TFF3) is a member of a group of small and stable peptides secreted from the goblet cells of intestinal mucosa.10–12 In gastric carcinogenesis, atrophic areas with GIM are filled by goblet cells. This increased number of goblet cells enhances the gastric mucosa's theoretical capacity to produce TFF3. In mouse models, TFF3 overexpression has been shown to promote mucinous metaplasia, and its upregulation has been associated with GIM in humans, suggesting that this biomarker is intimately related to early gastric carcinogenesis.13–15 Additionally, previous studies have found that TFF3 has 80% sensitivity and specificity for the detection of invasive GC, when measured in combination with serum pepsinogens I and II.16–19 This could be explained by the presence of GIM in the gastric mucosa where the GC emerges, overexpression of TFF3 in tumor cells and by the increased vascular permeability of this peptide in advanced stages of GC, augmenting its titers over its constitutional secretion by other parenchyma. Notwithstanding, scarce data has been published about the role of TFF3 in the detection of premalignant conditions, contrasted with a more extensive evaluation of other biomarkers such as pepsinogen I and II. A recent study carried out in Singapore demonstrated that high TFF3 serum titers were significantly correlated with OLGIM III-IV in patients with negative Hp serology.20 Thus, we hypothesize higher levels of serum TFF3 could be observed earlier in the carcinogenesis in patients with GIM as compared to those without GIM and could serve as a biomarker to non-invasively detect GIM priori to an upper gastrointestinal endoscopy (UGE).
The aim of our study was to assess the utility of TFF3 as a serum biomarker for the detection of GIM and GC, in a Chilean population with a high GC mortality.21
MethodsStudy design and subjectsWe conducted a single center, cross-sectional study of patients who underwent UGE as part of a public health campaign in Nueva Imperial, Chile. Symptomatic patients over 40 years of age were consecutively recruited between May and June 2016. Patients with digestive symptoms (i.e. epigastric pain, dyspeptic symptoms, weight loss) or family history of GC referred to UGE with gastric biopsies following Updated Sydney System biopsy protocol were included in the study. Patients with prior history of inflammatory bowel disease and total or partial gastrectomy were excluded. Demographic information and medical history were collected from all subjects at the time of recruitment. A fasting blood sample was obtained from all individuals prior to the UGE procedure. Additionally, 14 patients with advanced-stage GC, who underwent treatment during 2016 at a large referral public hospital in Santiago, Chile were included in this study as a positive reference group. Blood samples from patients with GC were obtained prior to any chemotherapy or surgical intervention. Patients were weighed and measured, and body mass index was calculated. Self-reported information on family history of GC, diabetes mellitus 2, hypertension, smoking, history of peptic ulcer, past history of Hp diagnosis and treatment, menopause and potable water availability was collected using a questionnaire.
All patients provided written informed consent. This study was performed in accordance with the ethical standards established in the Declaration of Helsinki. This study was approved by the Ethics Committees of Hospital Clínico Universidad Católica, Servicio de Salud Araucanía Sur and Dr. Sótero del Rio Hospital.
Serum TFF3 enzyme-linked immunosorbent assay (ELISA)Following blood extraction, serum was separated and stored at -20°C until analysis. Serum TFF3 levels were measured using the Human TFF3 Quantikine ELISA kit (R&D Systems, Inc. Minneapolis, Minnesota, USA), according to the manufacturer's instructions. All samples were analyzed in duplicate and mean values were used for analysis (Intraclass correlation coefficient=0.99). Briefly, monoclonal antibodies specific for human TFF3 were pre-coated onto ELISA microplate. Then, standards and 50-fold diluted serum samples (50μL) were pipetted into each well and incubated for 2h at room temperature on a shaker. After washing away unbound substrate, 200μL of an enzyme-linked polyclonal antibody specific for human TFF3 were added to each well and incubated for 2h at room temperature. Following four washes to remove any unbound antibody-enzyme reagent, 200μL of a substrate solution was added to the wells and placed in a color developer for 30min at room temperature. The color development was stopped by adding 50μL of the stop solution, and the intensity of the color was measured using a microplate reader set to 450-nm wavelength. The concentration of human TFF3 in serum samples was calculated from a standard curve using the reconstituted recombinant human TFF3 standards.22
Histological classification of gastric mucosal biopsiesFive gastric biopsies were collected from all patients according to the USSBP.23 Gastric samples were evaluated by three separate pathologists for diagnosis of CAG, GIM, dysplasia and GC, following international classifications.23–25 CAG was classified using the Operative Link for Gastritis Assessment (OLGA) staging system and GIM was classified using the Operative Link for Gastric Intestinal Metaplasia (OLGIM) staging system. GIM histology as complete or incomplete type was not available.
Patients with normal histology or any degree of CAG without GIM, were combined as the control group. Patients with GIM were further stratified into two subgroups according to the anatomical location: antral-restricted and corpus-extended (regardless of the presence of IM in the antrum or incisura) (Fig. 1).
 Normal gastric mucosa; (B) chronic atrophic gastritis without intestinal metaplasia with mononuclear infiltration of lamina propria and loss of glandular structures; (C) intestinal metaplasia with replacement of gastric epithelium by intestinal type epithelium with goblet cells; (D) gastric adenocarcinoma with irregularity of glandular structures and infiltrating tumoral cells.")
Study groups description, gastric location of gastric intestinal metaplasia and histology. (A) Normal gastric mucosa; (B) chronic atrophic gastritis without intestinal metaplasia with mononuclear infiltration of lamina propria and loss of glandular structures; (C) intestinal metaplasia with replacement of gastric epithelium by intestinal type epithelium with goblet cells; (D) gastric adenocarcinoma with irregularity of glandular structures and infiltrating tumoral cells.
An additional antral mucosal sample was obtained for Hp detection via urease testing (He-py Test®, BiosChile, Chile). Giemsa staining was performed in the five biopsies used for global histological diagnosis. Active Hp infection was defined as positivity in at least one of the two tests.
Statistical analysisCategorical variables were expressed as percentages and continuous variables as means with 95% confidence intervals (95%CI) or medians with interquartile ranges (IQR), as appropriate. The Chi-square test was used to compare categorical variables between histological groups. T-test and Mann–Whitney U test were used to compare continuous variables between groups. Kappa was calculated to estimate the agreement between Hp diagnostic tests (urease vs. Giemsa staining). Spearman rank correlation was used to compare TFF3 levels between OLGIM stages. TFF3 serum values were stratified into tertiles based on the distribution in the control group. Multivariable logistic regression models were used to assess the association between serum TFF3 tertiles and GIM, with effects reported as adjusted odds ratios (aOR). The first TFF3 tertile was considered the referent for all comparisons. Multinomial logistic regression was used to analyze the extension and severity (OLGIM stages) of GIM. All models were adjusted by age, sex, active Hp status, family history of GC and smoking. Finally, receiver operating characteristic (ROC) curves were used to assess the discriminatory value of TFF3 for diagnosing GIM and maximized cut-off was assessed by Youden's index. p-Values<0.05 were considered statistically significant. Statistical analyzes were performed using STATA v14.2 (Statacorp, College Station, TX, USA).
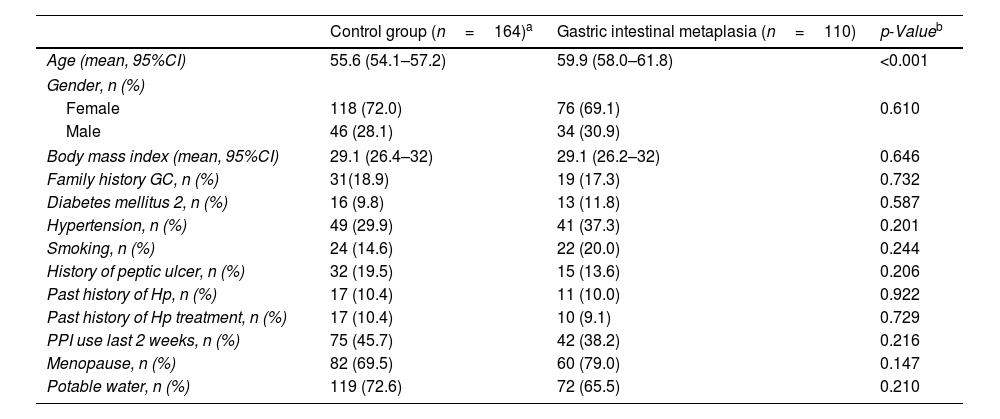
ResultsPatient characteristicsTwo-hundred and seventy-four patients were enrolled in this study (GIM group: 110; control group: 164). The overall mean age of patients was 57.4 years (95%CI: 56.1–58.6) and 70.8% (n=194) were female. Patients in the GIM group were older than those in the control group (59.9 vs. 55.6 years; p<0.001).
Urease testing was positive in 45.3% (n=124) and Giemsa staining was positive in 57.3% (n=157) of patients. Agreement between urease and Giemsa staining was high with a Kappa of 0.70 (p<0.001). Accordingly, active Hp infection was diagnosed in 58.8% (n=161) of patients. Overall, there was no statistical difference in active Hp infection between GIM and control groups with 56.4% (n=62) compared to 60.4% (n=99), respectively (p=0.509). Complete baseline characteristics stratified by histological group are summarized in Table 1.
Patient's baseline characteristics according to histologic group.
| Control group (n=164)a | Gastric intestinal metaplasia (n=110) | p-Valueb | |
|---|---|---|---|
| Age (mean, 95%CI) | 55.6 (54.1–57.2) | 59.9 (58.0–61.8) | <0.001 |
| Gender, n (%) | |||
| Female | 118 (72.0) | 76 (69.1) | 0.610 |
| Male | 46 (28.1) | 34 (30.9) | |
| Body mass index (mean, 95%CI) | 29.1 (26.4–32) | 29.1 (26.2–32) | 0.646 |
| Family history GC, n (%) | 31(18.9) | 19 (17.3) | 0.732 |
| Diabetes mellitus 2, n (%) | 16 (9.8) | 13 (11.8) | 0.587 |
| Hypertension, n (%) | 49 (29.9) | 41 (37.3) | 0.201 |
| Smoking, n (%) | 24 (14.6) | 22 (20.0) | 0.244 |
| History of peptic ulcer, n (%) | 32 (19.5) | 15 (13.6) | 0.206 |
| Past history of Hp, n (%) | 17 (10.4) | 11 (10.0) | 0.922 |
| Past history of Hp treatment, n (%) | 17 (10.4) | 10 (9.1) | 0.729 |
| PPI use last 2 weeks, n (%) | 75 (45.7) | 42 (38.2) | 0.216 |
| Menopause, n (%) | 82 (69.5) | 60 (79.0) | 0.147 |
| Potable water, n (%) | 119 (72.6) | 72 (65.5) | 0.210 |
Normal histology or CAG without GIM was diagnosed in 59.8% (n=164) of patients. Among patients in control group, CAG without GIM was observed in 50% (n=82). GIM was observed in 40.2% (n=110) of the patients. The distribution by OLGIM system was: 64.6% (n=71) as stage I; 20% (n=22) as stage II; 9.1% (n=10) as stage III; and 3.6% (n=4) as stage IV. There were 3 patients with unspecified OLGIM score due to inappropriate biopsies. GIM was defined as antral-restricted in 48.2% (n=53) and as corpus-extended in 51.8% (n=57) of patients. No cases of dysplasia or GC were observed during the study period.
Serum TFF3 levelsMedian serum TFF3 levels were significantly higher in the GIM group as compared to the control group [13.1ng/mL (IQR: 10.3–18.2) vs. 11.9ng/mL (IQR: 9.4–14.9), respectively, p=0.024]. There was no significantly difference in TFF3 levels between antral-restricted and corpus-extended GIM (12.1ng/mL vs. 13.7ng/mL, p=0.236). Similarly, there was also no significantly difference in median TFF3 levels between antral-restricted GIM and control group (12.1 vs. 11.9ng/mL, p=0.342).
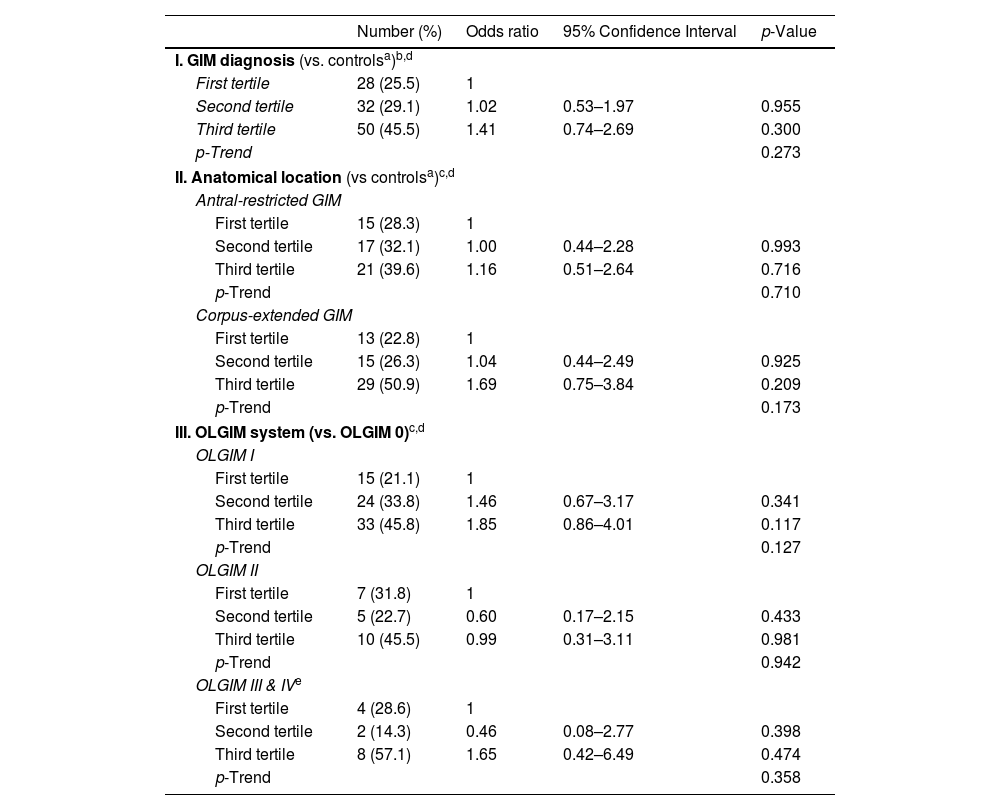
Table 2 summarizes the proportion of patients with GIM, antral-restricted and corpus-extended GIM according to TFF3 tertiles. No significant differences were observed in the proportion of patients in each tertile, between the GIM and negative control group (p=0.103) and between antral-restricted and corpus-extended GIM (p=0.197).
Association between serum TFF3 tertiles and gastric intestinal metaplasia (GIM) diagnosis, GIM anatomical location and Operative Link for Gastric Intestinal Metaplasia (OLGIM) stage.
| Number (%) | Odds ratio | 95% Confidence Interval | p-Value | |
|---|---|---|---|---|
| I. GIM diagnosis (vs. controlsa)b,d | ||||
| First tertile | 28 (25.5) | 1 | ||
| Second tertile | 32 (29.1) | 1.02 | 0.53–1.97 | 0.955 |
| Third tertile | 50 (45.5) | 1.41 | 0.74–2.69 | 0.300 |
| p-Trend | 0.273 | |||
| II. Anatomical location (vs controlsa)c,d | ||||
| Antral-restricted GIM | ||||
| First tertile | 15 (28.3) | 1 | ||
| Second tertile | 17 (32.1) | 1.00 | 0.44–2.28 | 0.993 |
| Third tertile | 21 (39.6) | 1.16 | 0.51–2.64 | 0.716 |
| p-Trend | 0.710 | |||
| Corpus-extended GIM | ||||
| First tertile | 13 (22.8) | 1 | ||
| Second tertile | 15 (26.3) | 1.04 | 0.44–2.49 | 0.925 |
| Third tertile | 29 (50.9) | 1.69 | 0.75–3.84 | 0.209 |
| p-Trend | 0.173 | |||
| III. OLGIM system (vs. OLGIM 0)c,d | ||||
| OLGIM I | ||||
| First tertile | 15 (21.1) | 1 | ||
| Second tertile | 24 (33.8) | 1.46 | 0.67–3.17 | 0.341 |
| Third tertile | 33 (45.8) | 1.85 | 0.86–4.01 | 0.117 |
| p-Trend | 0.127 | |||
| OLGIM II | ||||
| First tertile | 7 (31.8) | 1 | ||
| Second tertile | 5 (22.7) | 0.60 | 0.17–2.15 | 0.433 |
| Third tertile | 10 (45.5) | 0.99 | 0.31–3.11 | 0.981 |
| p-Trend | 0.942 | |||
| OLGIM III & IVe | ||||
| First tertile | 4 (28.6) | 1 | ||
| Second tertile | 2 (14.3) | 0.46 | 0.08–2.77 | 0.398 |
| Third tertile | 8 (57.1) | 1.65 | 0.42–6.49 | 0.474 |
| p-Trend | 0.358 | |||
Increasing OLGIM stage was associated with increasing serum TFF3 levels (Rho coefficient=0.124, p=0.04). The stage-specific TFF3 medians by OLGIM were: 11.9ng/mL for stage 0; 13.0ng/mL for stage I; 13.5ng/mL of stage II; 14.0ng/mL for stage III, and 18.8ng/mL for stage IV.
Among controls, a significant increase in serum TFF3 levels by age was observed. No significantly differences on TFF3 levels were observed by sex or body mass index.
Multivariate analysisSerum TFF3 levels were not significantly associated with GIM when adjusting for confounding variables with aOR 1.20 (95%CI: 0.87–1.65; p-trend=0.273). Age was independently associated to GIM with aOR 1.47 (95%CI: 1.06–2.04; p-trend=0.021). Tertile specific aORs are presented in Table 2. Moreover, multinomial regression demonstrated that serum TFF3 was not associated to corpus-extended GIM with aOR 1.33 (95%CI: 0.88–2.00; p-trend=0.173). Similarly, OLGIM stages and serum TFF3 tertiles were not associated (Table 2).
Sensitivity and specificity of TFF3 for diagnosis of GIMUsing a maximized cut-off of 12.7ng/mL the area under the curve for diagnosis of GIM was 0.58 (95%CI: 0.51–0.65), with a sensitivity and specificity of 55.5% and 58.5%, respectively. Patients without Hp infection had a higher AUC compared to patient with Hp infection [0.63 (95%CI: 0.53–0.73) vs. 0.54 (95%CI: 0.45–0.64 (Fig. 2).
Gastric cancer reference group curve analysis of serum trefoil factor 3 for the diagnosis of gastric intestinal metaplasia in patients with and without active Helicobacter pylori (Hp) infection.")
The mean age of the GC group was 57.5 years (95%CI: 54.3–60.7) and 78.6% were female. Median serum TFF3 level was 20.5ng/mL (IQR: 13.3–31.7). Serum TFF3 level were independently associated to GC with aOR 3.26 (95%CI: 1.29–8.27; p-trend=0.013), adjusting for age and sex. Also, whereas the second serum TFF3 tertile was not significantly associated to GC with aOR 3.01 (95%CI: 0.30–29.79; p=0.355), the third serum TFF3 tertile was significantly associated to GC with aOR 10.12 (95%CI: 1.18–86.55; p=0.035). Using a maximized cut-off of 19.05ng/mL the area under the curve for diagnosis of CG was 0.77 (95%CI:0.63–0.91), with a sensitivity and specificity of 64.3% and 84.0%, respectively.
DiscussionCAG with GIM is a GC precursor, and as such, the ability to detect this histological lesion noninvasively would be advantageous for designing surveillance strategies in high-risk patients. In this study, we report, for the first time, the association between circulating TFF3 levels and GIM. We found no association between TFF3 levels and GIM diagnosis. Stratified analyses also failed to find an association between TFF3 and anatomic location of GIM (antral-restricted vs. corpus-extended), or severity (OLGIM staging). Accordingly, ROC analysis demonstrated that this biomarker is neither sensitive nor specific for the diagnosis of GIM. Thus, our findings suggest that TFF3 has limited clinical utility for the non-invasive detection of GIM.
Goblet cells, when are present in the gastric mucosa, are pathognomonic for GIM. As TFF3 is known to be secreted by goblet cells, we hypothesized higher levels of serum TFF3 in patients with GIM as compared to those without GIM. However, we found that the levels were not significantly higher in the GIM group. As previously reported,15–19 we found higher levels of TFF3 in patients with invasive GC. We speculate that the positive association between TFF3 and GC may be explained by a larger extension or advanced metaplastic process in the gastric mucosa of patients with cancer. Alternatively, these higher levels could also represent an overexpression of TFF3 in tumor cells and/or enhanced permeability of this peptide to the bloodstream during advanced stages of carcinogenesis.15,26,27
Of note, increasing age, which is a risk factor for GIM,28–30 was independently associated with increasing serum TFF3 levels. It is unclear whether this association is due to an age-related upregulation of TFF3 expression, or whether elevated serum TFF3 levels reflect an underlying increase in metaplastic changes in older patients. This finding may be considered on the interpretation of serum TFF3 values.
Given that incomplete GIM confers a higher risk of GC, future studies should address differences in serum TFF3 levels by histological subtypes. Akiou and colleges17 reported that both TFF1 and TFF2 are associated with GC. The role of these additional members of the trefoil factor family should be evaluated in patients with GIM and other premalignant conditions. Further studies of premalignant conditions should also address the utility of TFF3 prospectively over time and in combination with other gastric cancer biomarkers such as pepsinogen I and II, in order to determine if GIM with elevated titers of serum TFF3 could be associated to an increased risk of progression to GC in comparison to GIM on its own. Also, as we confirm the association of TFF3 and GC, future studies could assess its utility in prognosis or treatment response.
The strengths of our study include having a well-characterized series of symptomatic patients who consecutively underwent UGE with mapping gastric biopsies. All histologic diagnoses were assessed independently by two experienced pathologists. Also, all serum samples were analyzed in duplicate, providing a more precise measurement of TFF3 levels. Our study also had limitations. The limited number of patients with corpus-extended GIM and advanced OLGIM stage (OLGIM III & IV), limited the statistical power of subgroup comparisons. The lack of characterization of GIM in complete and incomplete type impedes drawing conclusions about the performance of TFF3 in specific types of GIM. A more recent and larger study in Singapore concluded that TFF3 accurately discriminate OLGIM III & IV patients from OLGIM 0–II, particularly in Hp negative patients.20
In conclusion, serum levels of TFF3 do not discriminate GIM in this high-risk Latin American population. Nevertheless, we confirmed an association between TFF3 levels and invasive GC.
FundingGrant Support: Conicyt-Fondap 15130011 (AC), Fondeyct 1151411 (AC), Prevecan project (AR) and Residentś project grant PUC PBN̊25/16(GL).
Conflict of interestsThe authors declare that they have no conflict of interest.
