


When deciding in which segment to invest or how to distribute the marketing budget, managers generally take risks in making decisions without considering the real impact every client or segment has over organizational profits. In this paper, a segmentation framework is proposed that considers, firstly, the calculation of customer lifetime value, the current value, and client loyalty, and then the building of client segments by self-organized maps. The effectiveness of the proposed method is demonstrated with an empirical study in a cane sugar mill where a total of 9 segments of interest were identified for decision making.
Cuando se está decidiendo en qué segmento invertir o cómo distribuir el presupuesto de marketing, los Gerentes corren el riesgo de terminar tomando decisiones de manera general sin considerar el verdadero impacto que tiene cada cliente o segmento de clientes en las utilidades de la organización. En este artículo, se propone un modelo de segmentación de clientes que considera en primera instancia el cálculo de tres dimensiones: el valor de cliente en su ciclo de vida, el valor actual y la lealtad; para posteriormente construir los segmentos mediante mapas auto-organizados. La efectividad del modelo se probó en un Ingenio Azucarero donde se identificaron 9 segmentos de interés para la toma de decisiones de marketing.
Quando se está a decidir em que segmento investir ou como distribuir o orçamento de marketing, os Gestores arriscam ao tomar decisões de uma maneira geral, sem considerar o impacto real que cada cliente ou segmento tem sobre os lucros da organização. Neste artigo, propõe-se uma estrutura de segmentação que considera, em primeiro lugar, o cálculo do valor do cliente ao longo da vida, o valor actual e a fidelidade do cliente, e depois a construção de segmentos de clientes através de mapas auto-organizados. A eficácia do método proposto é demonstrada através de um estudo empírico sobre uma fábrica de cana-de-açúcar, em que um total de 9 segmentos de interesse foram identificados para a tomada de decisões.
From the modern management perspective, maximizing customer value is the key to surviving fierce competition in the business world. Differentiating more profitable customers from less profitable customers and focusing on lifelong, rather than short-term, customer relationships are key business strategies for survival in today's competitive marketplace (Chan & Ip, 2011). As result, building long-term customer loyalty is crucial to business sustainability (Keh & Lee, 2006; Kumar & Reinartz, 2006; Lars, 2007).
Mulhern (1999) proposed that customer value based on profit is an important base for behavior segmentation, due to central importance of benefits. Looking forward to keeping customers, who generates most benefits as well as maximize their profit, enterprises start managing their customer portfolio as a fundamental asset for achieving a sustainable competitive advantage along time, which has required modifying from transactional marketing philosophy to relation marketing. Therefore, business and marketing approach must fundamentally focus on customer or customer value (Rust, Zeithaml, & Lemon, 2000). What it means, a new vision looked at customer select and manage for optimizing their value in a long term. The customer diverse segments have a potential different benefit for companies and benefit pattern could vary depending on the period where customer life cycle is and other considerations. Looking after the customer group which represents the most valuable customers during the time, it could significantly increase the company benefit (Payne & Holt, 2001). By this way, resources and an appropriate business strategy can then be allocated and formulated respectively for business sustainability (Kumar & Reinartz, 2006). In addition, Bayón, Gutsche, and Bauer (2002) recognized that possible investors need to be convinced of the amount and sustainability of a calculated customer value.
A way to identify the most valuable customers is through benefit criteria which could be applicable in whatever kind of business. Customer value has been studied under the name of lifetime value (LTV), customer lifetime value (CLV), customer equity (CE), and customer profitability (Hwang, Jung, & Suh, 2004). Researchers have tried different methods to calculate the value of individual customer to make rankings of individual clients or segments or even predictions of the value, as can be found in Verhoef and Donkers (2001), Jain and Singh (2002), Bayón et al. (2002), Stahl, Matzler, and Hinterhuber (2003), Hwang et al. (2004), Venkatesan and Kumar (2004), Gupta and Lehmann (2006), Kim, Jung, Suh, and Hwang (2006), Khajvand, Zolfaghar, Ashoori, and Alizadeh (2011), Han, Lu, and Leung (2012) and Verbeke, Dejaeger, Martens, Hur, and Baesens (2012).
In addition to that, there are different ways to describe customer behavior; one of these is using Kohonen self-organizing maps (SOM) that recently have been important. Self-organizing maps are a particular type of neural network used for clustering and data visualization (Criado, Arroyo, & López, 2005).
Researches about segmentation using SOM could be found out in Lee, Suh, Kim, and Lee (2004), Jonathan (2005), Kuo, Wang, Hu, and Chou (2005), Kiang, Hu, and Fisher (2006), Kim et al. (2006), Kuo, An, Wang, and Chung (2006), Ghaseminezhad and Karami (2011), Hanafizadeh and Mirzazadeh (2011), Ordóñez, Dafonte, Arcay, and Manteiga (2012), Sahoo, Zuo, and Tiwari (2012), Seret, Verbraken, Versailles, and Baesens (2012), Wei, Lin, Weng, and Wu (2012), Chattopadhyay, Dan, and Mazumdar (2012), Chien-Wen (2012), Hong and Kim (2012). As can be seen, the trend of using SOM in segmentation has increased last year.
In this paper, a segmentation model with a customer value base, integrating different approaches from marketing and quantitative analysis is proposed. First, three criteria were selected from different alternatives proposed by researchers. As a result, customer lifetime value (CLV), the current value and the client loyalty were decided as segmentation criteria. After considering the details for the calculation of every criterion in the company, the neural network for the analysis was developed. The segmentation of the database was performed by the Neural Network Clustering Tool (nctool), the way as Matlab solves clustering problems. As part of the simulation process, running the training with different number of segments is considered in order to find out the best way of clustering. Last step of this method is the calculation of the real value of every segment identified by SOM in order to know how important every one for financial results in the company is.
This paper is built in two sections: first, the detail about the segmentation model is presented, and second, the effectiveness of the proposed method is demonstrated with an empirical study of one of the largest producers of sugar cane in Colombia. In this company, one of its commercial lines which spend about USD 2million per year in generic marketing campaigns segmented its national and international client database. The experimental results demonstrate that the proposed method can more effectively target valuable customers than actual method. This supports the idea that investing big amount of money in marketing campaigns with no reference about the weight or importance of the clients is not sustainable in these days.
2Customer segmentation modelThe proposed segmentation method is based on LTV calculation proposed by Kim et al. (2006) and Hwang et al. (2004) that considered three factors: current value, potential value, and customer loyalty. In addition, self-organizing maps are used as a tool for clustering the customer database and identifying the most valuable customers. The model considers the following steps.
2.1Step 1: customer specificationFirst, it is necessary to define the scope of the analysis that will be done by defining business unit, geographical coverage, kind of product, customer aggregation level, the active or inactive status client, as well as the time that will be covered by the analysis. Making clear these parameters, the organization could perform better analysis and even plan the analysis in different levels.
2.2Step 2: sales identification and payments done by customersTo continue with the process, some information about financial transactions has to be calculated for every customer. For revenues, the following has to be calculated:
- -
Compilation of customers’ historical purchase: information about transactions done by customer in the period of analysis should be recollected.
- -
Compilation of customer arrears in payment: information about payment date of customer obligation in the period of analysis should be recollected, with the goal of identifying payments which was done after payment date. This information will be used in the next chapter for doing the calculation of customer earned value.
- -
Assignation cost: variable costs and customer acquisition costs should be identified.
Identifying costs, which have been incurred in customer relationship, is really important. It should include direct and indirect acquisition, production, marketing and distribution costs.
2.4Step 4: calculation of customer lifetime valueWith revenues and costs per client, the customer life time value can be calculated, understanding it as the performance generated by each customer in time analyzed. It is calculated using incomes and costs by following Eq. (1) of structural basic model.
where Ri, Gross Income, is the value of amount bought per price paid, Ci is the relationship cost with customer that corresponds to the sum of all costs associated with the customer, and d, the discount rate, is the money discount rate established for reflecting cash flow risk.2.5Step 5: calculation of customer earned value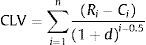
Before deciding to hold a customer, the expected effect on profit and portfolio risk should be determined. Glazer and Dhar (2003) affirmed that if there is better customer portfolio behavior, there will be more contribution in the enterprise. In the model, customer earned value is the criteria which allowed comparing incomes and arrears in payment. This value corresponds to gross sales done by a customer minus arrears in time of the commercial relationship that is proposed by Kim et al. (2006).
2.6Step 6: calculation of customer purchase rotation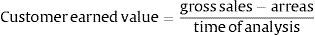
In this model, purchase rotation is considered like brand customer preference, and it is a measure of customer loyalty. A high rotation means a high customer loyalty level. It is equivalent to sum of purchases number done by a customer in a period of specific time.
where Cij corresponds to the customer i in the period of time j, and n is the last month of the period of analysis.2.7Step 7: design of self-organizing map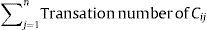
It is necessary to do the data normalization to prevent that bigger magnitudes in one criteria void lesser magnitudes from other criteria. It is done using Eq. (4) proposed by Caicedo and López (2009).
where Xn indicates the normalized value and X represents the original value. By the same way, Xmax and Xmin indicate the maximum value and the minimum value of the variables, respectively.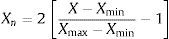
After having identified and normalized the data, some parameters have to be defined in order to run self-organizing maps. Those parameters are: network architecture, initialization procedure, and training algorithm. Final simulation was run using Matlab 7.12.0 (R2011a) which solves clustering problems by SOM with its Neural Network Clustering Tool (nctool).
First, the normalized data can be considered as the input matrix to be organized. The neurons in the entrance layer belong to the customer number and the neurons in the exit layer will be the segments number obtained. This entrance vector has dimension three X=[X1, X2, X3], because the three segmentation criteria are considered for the model; X1 represents customer lifetime value, X2 represents customer earned value and X3 represents customer purchase rotation.
On the other hand, the network architecture has to be defined. This network has one layer, with neurons organized in a grid which is defined by the number of rows and columns in the grid. In addition, initial values are given to the prototype vectors. Among random sample and linear initialization procedures, random method was chosen. Finally, training the network following to the minimum distance rule for finding the winner neuron of data matrix and an entrance vector is selected randomly for checking the red.
3Case of study for an agro industrial companyThe company, which was selected for applying the model, is an enterprise that belongs to agro industrial sector, one of the largest producers of sugar cane in Colombia, which is dedicated in the elaboration of sugar, alcohol, organic fertilizers, and other industrial inputs.
Company's customers were divided in seven canals: wholesalers and distributors, supermarkets, industrial, organic products and chemical products. For the case of study, analyze just the industrial canal constituted by 71 customers, was decided. Additionally, doing the analysis with the five products which are being marketed in the industrial canal as well as doing it just in the national field. The analysis is done with the sales dates for twelve months.
In addition the marketing department of industrial channel provided the database with information about the transactions done by costumers from January 2010 to December 2010. The arrears were recollected with the accounting department, which provided a database with information about the payments of each customer. The enterprise has established 30 days as the maximum time for customer bill payment. To calculate the arrears of the customers, days (among customer had to pay and payment day) were calculated; if number of days is more than 30 days, it is considered as an arrear. Otherwise, if number of days is less than 30 days, it is not being considered as an arrear.
The different costs were calculated as percentage of sales for calculating the customer cost multiplied simply per amount bought monthly. The acquisition costs were not taken in this analysis; due to target market does not use any kind of publicity, discounts or contacts. Production costs include direct and indirect costs. Marketing costs correspond directly to sale force management. Distribution costs considered transport, packing, stock maintenance, storage, product returned or rejected and order processing. Transport was not taken because customers pick the product up in the enterprise facilities.
With client information, customer lifetime value, earned value and purchase rotation indicators were calculated. In accordance to the equation presented, CLV for customer was calculated utilizing the discount rate used for the company that is equivalent to WACC. The Weighted Average Cost of Capital (WACC) is the capital cost of the business (Black, Wright, & Bachman, 1998) and it was supplied by the company. As a curiosity, calculating the earned value, it was found that there were customers whose purchases were less than overdue payment. Finally, a dynamic table was generated to calculate the purchase rotation, from the database of customer transactions, which was filtered because of having a transactions number of each customer for every month.
In order to design the self-organizing map (SOM), the necessary normalization was done for including the data of different variables in the model. For simulation, the network has 71 neurons in the entrance layer which corresponds to the table of normalized data. Inputs ‘data’ is a 71×3 matrix, representing: 71 samples (customers) of 3 elements (segmentation criteria). In addition, training the network following to the minimum distance rule for finding the winner neuron of data matrix and an entrance vector is selected randomly for checking the red, in batch mode running 200 epochs.
For the exit layer, it was decided to try different structure in order to find best way to cluster the client database, so the training was done with 4, 9 and 16 neurons. The neurons of output layer are the number of groups which the company could segment the customer base, so more than 16 neurons were not considered. As output layer, Matlab create two-dimensional matrix N×N where N represents the number of neurons, so the training results in 2×2 matrix, 3×3 matrix and 4×4 matrix. Training was performed until results were the same or very similar; thus the last simulation was decided as the optimal result for the segmentation.
For the first map, the 2×2 matrix, training was done three times and same results were obtained. Fig. 1 shows the neurons location in the topology and indicates the training data amount which is associated for each neuron. The number which is expressed in each neuron is equivalent to access numbers of entrance vectors that are associated to every neuron. The maximum of access associate to a neuron was 61 customers and the minimum was 1 customer. In this case, the data concentrated a little more on the upper-right neurons suggesting the company to consider a segment as big as 61 clients while other segments with 5, 4 and even 1 client.

The inconvenience for a company trying to develop marketing strategies for segments 61 clients and for segments with 1 client can be noticed. It is understood that it is necessary to continue with the process in order to obtain results with less concentration.
In case of the second map, the 3×3 matrix, training was done three times obtaining the same result every case. Fig. 2 shows the neurons location in the topology. It can be noticed that training looks for a better distribution of data across the neurons, than the 2×2 matrix; however a concentration pattern still remains. The maximum of access associate to a neuron was 27 customers and the minimum was 1 customer.

In the last case for the third map, the 4×4 matrix, training was done five times until the best result was found. Figs. 3–7 show the neurons location in the topology for every time and the similarity of the data associated for each neuron.


In this case, the maximum of access associate to a neuron was 14 customers and the minimum was 0 customers. Training process starts with a neuron with 24 customers but looking for a better distribution of data across the neurons, finishes with 14. However due to the large number of neurons decided, neurons with 3, 2, 1 and even no clients can be found.
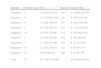
Considering the second map, the 3×3 matrix, as the best way to segment the database, and having identified the number of customers who belong to each segment; the next step was, to identify which customer belongs to every segment, information provided by Matlab. Finally with information of every customer per segment, the value of criteria for the segments could be calculated. Table 1 shows the number of customer assigned to every segment and the value of every segmentation criteria.
Factors per segment.
| Segment | Customer base | CLV | Rotation | Earned value |
| Segment 1 | 4 | $ 29,199,837,857 | 1057 | $ 14,488,124,570 |
| Segment 4 | 4 | $ 12,710,525,452 | 785 | $ 7,562,193,132 |
| Segment 8 | 4 | $ 3,924,198,016 | 241 | $ 1,841,649,260 |
| Segment 7 | 1 | $ 3,376,330,427 | 552 | $ 1,134,218,209 |
| Segment 5 | 10 | $ 2,593,330,907 | 513 | $ 1,070,883,005 |
| Segment 2 | 1 | $ 2,196,528,003 | 164 | $ 755,260,470 |
| Segment 9 | 7 | $ 1,423,014,506 | 139 | $ 722,015,289 |
| Segment 6 | 27 | $ 1,191,150,513 | 155 | $ 483,972,173 |
| Segment 3 | 13 | $ 672,098,214 | 280 | $ 21,505,778 |
| Total | 71 | $ 57,287,013,895 | $ 28,036,810,330 | |
Source: prepared by the authors.
According to CLV, rotation and earned value criteria, segments could be ranked in order to the value for the company. It can be seen that segment 1, with only four clients, represents the most valuable segment which means 51% of total CLV and 52% of total earned value. If aggregated, segments 1 and 4, with eight clients, represent 73% of total CLV and 79% of earned value.
As a result, segments 1 and 4, which have higher CLV, are the highest loyalty level and their arrears value is less than their incomes, generating a high value for the company. In the opposite site, segment 3 is not profitable, it has a low rotation and its income is less than its arrear value.
4ConclusionsCorporate strategies focusing on the real value of the customer can support the development of competitive advantages thanks to a better distribution of resources. In view of this, organizations realize a better differentiation between their customers, also, it represents a valuable source of information for making investment decisions and definition of their strategic to maximize profit and company value in the future.
Knowing the real value of customer segments represented for the company, the opportunity of redistributing its marketing annual budget for this business line, is about USD 2million for year. Company could design specific marketing objectives and assign to a budget according with them. Marketing objectives could vary from improving relationship with some segments to close it with others.
Including new criteria to know customer behavior such as customer lifetime value, current value and the client loyalty are more representative for decision making that just revenues or volume of clients. These are useful measurement which companies could support their analysis for making decisions when it works focusing on customers. Therefore, if entrance information measure is accurate, the result will be accurate.
The application of proposed methodology is a case of study evidenced that a customer grouping is a good way to characterize and identify it. If the company gets a new customer, it could be located. In the same way, all the customers will be identified easily and enterprises could know how to offer a comfortable treatment for keeping them. In the proposed methodology a ranking of customer earned value was found out, and it is taken as a base for marketing strategies formulation.
Self-organizing maps represent a good way of analysing quantitatively the company's customer database no matter how big it is. In addition, the possibility of performing trials with different number of neurons in the output layer, and the repetitive training process, supports reliable results in which the decision maker can take part.
A disadvantage discovered in this study is represented by the barrier to decide the number segment to obtain. In the output layer Matlab allowed the creation of matrix N×N where N represents the number of neurons, so the training that could be done were 2×2 matrix, 3×3 matrix and 4×4 matrix. Future research could look for different ways to build the two-dimensional matrix N×M where N and M represent different numbers of neurons for the output layer.
Other disadvantage is the lack of statistical information about the results that facilitate the interpretation. Information that Matlab produces is mainly in the form of diagrams and the only information presented in detail is the assignation of samples in the neurons. Future jobs can look for this information and even establish comparatives with other segmentation methods.
Conflict of interestThe authors declare not to have any conflict of interest.

