


Drawing blood samples through a central venous catheter (CVC) is a customary practice in Intensive Care Units (ICUs). It is indicated to discard a volume of waste blood to avoid interference in the results.
AimTo determine whether a lower discard volume for obtaining blood samples from temporary CVCs placed into the internal jugular, femoral or subclavian vein offers valid results.
MethodA quasi-experimental prospective cross-sectional study for which sixty-five patients of over 18 years of age in ICUs, who had been fitted with a triple lumen central venous catheter, were recruited over a period of eight months. Two consecutive blood samples were extracted with tubes for biochemistry, coagulation and hemogram from each patient from the distal lumen. The first sample was obtained with a discarded waste of 1.5 ml from a total extracted volume of 10.2 ml, similar to the usual waste in our ambit (10 ml). Subsequently the second sample was obtained. The paired t-test was used to analyse the data. The Bland-Altman plot and intraclass correlation coefficient (ICC) were used to measure the agreement between methods. The reference change value (RCV) was established as the admissible limit of variation between the pairs of samples.
ResultsA total of 65 sample pairs were drawn (intervention-control). The paired t-test found statistically significant differences with a significance level of α = .05 for chlorine (−.536; .012); prothrombin time (−.092; .019) and prothrombin activity (.284; 1.375).The ICC was greater than .9 in all the variables and the limit determined for the RCV was not surpassed by any value.
ConclusionsThe results show the reliability of the blood samples drawn with a discard volume of 1.5 ml.
La extracción de muestras sanguíneas a través de un catéter venoso central (CVC) es una práctica habitual en las Unidades de Cuidados Intensivos (UCI). Está indicado desechar un volumen de sangre, denominado volumen de descarte, con la finalidad de evitar que los resultados puedan verse alterados.
ObjetivosDeterminar si un menor volumen de descarte para la obtención de analíticas procedentes de CVC temporales alojados en la vena yugular interna, femoral o subclavia ofrece resultados válidos.
MétodoEstudio cuasiexperimental, prospectivo, transversal donde se reclutaron 65 pacientes críticos mayores de 18 años portadores de CVC temporal de tres luces durante un período de ocho meses. Se extrajeron dos analíticas consecutivas en cada paciente de la luz distal con los valores de hemograma, bioquímica y coagulación comúnmente analizados en paciente crítico. Se obtuvieron dos muestras consecutivas; la primera con un descarte de 1,5 ml y un volumen extraído total de 10,2 ml y seguidamente se obtuvo la segunda muestra. Para el análisis de datos se utilizó la pruebat pareada; para medir la concordancia entre métodos, la representación de Bland-Altman y el Coeficiente de Correlación Intraclase (CCI). Se estableció el Valor de Referencia del Cambio (VRC) como límite admisible de variación entre los pares de muestras.
ResultadosSe extrajeron un total de 65 pares de muestras (intervención-control). El contraste de medias encontró diferencias estadísticamente significativas con α = 0,05 para cloro (−0,536; 0,012); tiempo de protombina (−0,092; 0,019) y actividad de protombina (0,284; 1,375). El CCI resultó mayor a 0,9 en todas las variables y el VRC no fue superado por ningún valor.
ConclusionesLos resultados muestran la validez de los análisis de las muestras de sangre extraídas con un volumen de descarte de 1,5 ml.
When drawing blood samples through a central venous catheter, to avoid interference in results it is indicated to discard a volume of blood, called the discard volume. There is wide variability in discard volumes, which in most cases exceed the catheter flush volume.
What it contributesThe results show the reliability of blood sample testing drawn with a discard volume of 1.5 ml, which involves less blood loss.
The reference change value is introduced as an admissible limit of variation between pairs of samples and systematic screening of differences between consecutive results for the same patient and the same test.
Implications of the studyThe results provide a basis to develop protocols aimed at minimising iatrogenic anaemia and associated complications, a major problem in critical care units.
Hospital-acquired anaemia (HAA)1 is one of the main complications in the critically ill patient. It results in a longer stay in the critical care unit and in the hospital, and increased mortality. The aetiology of HAA is complex and may include blood loss and shortened lifespan, and decreased red blood cell production.2 Potentially modifiable strategies in HAA include minimising the volume of discarded blood in blood tests.2,3
Patient blood management (PBM) programmes give recommendations to minimise the direct and indirect risks associated with blood transfusion. A review of the literature confirms that it should not be the default option for managing anaemia or blood loss. Instead, accumulating evidence shows that a proactive, patient-centred approach to managing a patient’s own blood should be the new standard of care.4 The PBM programme in intensive care units (ICU) includes measures in addition to a restrictive transfusion policy, including reducing blood loss.5
This blood loss can be the result of the multitude of blood tests the patient must undergo, which are basic tools for diagnosis and treatment optimisation. These samples are usually drawn from a central venous catheter (CVC).
CVCs are placed in the central intravascular space to ensure safe venous access and, in addition to being useful for drawing blood samples, allow infusion of medication, enabling several simultaneous infusions, haemodynamic monitoring, plasmapheresis, and haemodialysis. In the ICU, the presence of multi-lumen central lines makes the blood collection procedure easier without the need for venous punctures,6 which enhances patient wellbeing.
The most commonly used procedure to draw a blood sample in adult ICUs is the discard method,7 which consists of first discarding a quantity of blood. The volume discarded is not negligible and is estimated at 28.5%–33.1% of the total volume drawn7; the mean amount of blood discarded in the critically ill patient in the first 24 h of admission is 31.61 ml.8 The mean volume of blood discarded per extraction is 10.3 ml, making a mean total of 41.1 ml per day.9 Specifically, in critically ill patients with a CVC, the mean discarded volume is 5.5 ml.3
The literature reports differences in discard volumes used in drawing a sample. There are studies that recommend or use larger volumes,10–12 however, new approaches in blood saving propose using lower volumes, and are achieving good results.13–18 However, it is also points out that in perfusion of sodium heparin, this discard volume should be larger, although no consensus has been reached on this.19 With regard to technique, there are studies where the line is flushed beforehand with .9% physiological saline,11,15,16 and others where it is not specified.13,20 In summary, there is great variability in the volume of blood discarded depending on the centre where the sample is taken and whether more conservative collection techniques are recommended.21
The overall objective of this work was to determine whether a smaller discard volumes when drawing blood for testing from temporary CVCs placed in the internal jugular, femoral, or subclavian vein provides valid results.
MethodologyDesignQuasi-experimental, prospective, cross-sectional study.
Scope and period of studyThe burns ICU and general ICU of the Hospital Universitario La Paz, from April to November 2019.
ParticipantsPatients admitted to these units with a temporary 3-lumen CVC in the internal jugular vein, subclavian vein, or femoral vein were selected. Patients who met at least one of the exclusion criteria: under 18 years of age, on treatment with continuous heparin perfusion, and/or patients with haemoglobin <7 g/dl were not part of the study.
SampleA convenience sampling was done in candidate patients admitted to the units where those responsible for sample collection perform their activity. It was done in 2 phases: an initial phase, in which a pilot study was conducted to adjust consumption of resources in case of disagreement between methods, and a continuation phase, in which the sample size was increased for the main study. To establish the number of participants in each phase, the minimum sample size to estimate the intraclass correlation coefficient (ICC) of the results obtained by 2 methods22 was calculated using the Power Analysis and Simple Size programme, where the significance and minimum power required were defined as .05 and higher than .8, respectively. The aim was to determine a high level of agreement between the 2 methods, and therefore ρ0 = .75 and ρ1 = .9 were set for the pilot study and ρ0 = .9 and ρ1 = .95 for the main study, with calculated minimum sample sizes of 25 and 50 patients, respectively. It was necessary to increase the required size by 10% and 30%, respectively, to ensure that the necessary minimum was reached for all variables included in the study, because they were not always included in the analytical order.
VariablesBlood parameters commonly analysed daily in patients admitted to the units where the study was conducted were used, within the categories of hemogram: red blood cells, haemoglobin, haematocrit, platelets, and leukocytes; general biochemistry: glucose, creatinine, urea, sodium, potassium, and chloride; coagulation: prothrombin time, prothrombin activity, international normalised ratio, partial thromboplastin time, and partial thromboplastin time ratio.
MethodSamples were drawn by 5 nurses: 2 from the burns ICU and 3 from the general ICU. Two consecutive samplings were performed with biochemistry, coagulation, and hemogram tubes of 3; 2.7, and 3 ml, respectively, which were filled in that order following the hospital's internal protocols. The first sample (intervention) was obtained using the method explained by Moureau15 for drawing samples using a CVC. The priming volume of the distal lumen of the 3-lumen CVC used was .44 ml and three times the dead space corresponded to 1.32 ml, which was defined as 1.5 ml to simplify the method. Handling was aseptic, following all the recommendations of the Bacteraemia Zero Project.23
First, ongoing perfusions of the distal lumen of the catheter were stopped without interrupting medial and proximal lumen perfusions. Next, 10 ml of .9% saline were administered with a 10 ml syringe through the distal lumen connection to remove any medication residues that could alter the measurements. The 2 samples were then drawn consecutively. The volume for the intervention sample was 1.5 ml of discarded sample plus 8.7 ml of the blood sample to be analysed, with a total discarded volume of 10.2 ml. This volume was similar to that usually discarded (10 ml), ensuring that a larger volume was not extracted for the study. Once a single intervention sample and a single control sample were obtained, the subject's participation ended. Samples were sent to the hospital emergency laboratory by the usual means and were processed immediately to avoid bias in the results due to time and temperature variables.
Data analysisThe paired t-test was used for data analysis, except for the variables prothrombin time, prothrombin activity, and international normalised ratio, for which the Wilcoxon signed-rank test was used, because the samples drawn did not follow a normal distribution. For the contrast of means it was necessary to define the variable differences (d = intervention-control), and its mean (x¯d) and standard deviation. The level of statistical significance used was α = .05. The Bland-Altman plot24 and the ICC25 were used as measures of agreement or reproducibility between the 2 methods. If the CCI is below .4, it is poor agreement; if it is above .75, it is excellent. If it is between the two, it is considered good (moderate). For the plot, the limits of agreement at 95% were defined as x¯d±1.96 standard deviations. The reference change value (RCV) marked the admissible limit of variation between sample pairs. This is a statistical tool that combines analytical error (coefficient of analytical variation [CVA]) and intra-individual biological variation (coefficient of individual biological variation [CVI]).26 If the differences of the control sample with the intervention sample exceed the change explainable by the CVI and the CVA, it can be attributed to a change in the patient's health status27 and the 2 samples could not be considered equal. The values of 1.96 or 2.58 (z) for a significance level of 95% (RCV95%) or 99% (RCV99%), respectively; the CVI26 and CVA provided by the laboratory for each parameter were used for calculation. The formula for their calculation was as follows:
RCV = 2z(CVI2+CVA2)1/228,29.
We used R version 3.6.1 (last update 5-07-2017).
Ethical aspectsThe study was approved by the ethics and drug research committee of the Instituto de Investigación Hospital Universitario La Paz. Informed consent was not necessary given the characteristics and pragmatic objective of the study in accordance with the evaluation report issued by the aforementioned committee (PI-3596). The data were treated confidentially in accordance with Organic Law 15/1999 on Data Protection.
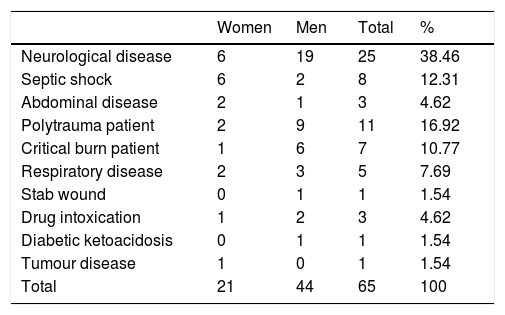
ResultsThe final sample was 65 patients, 66.5% were men and 33.85% women, with an average age of 56.92 years in the range from 18 to 82 years, with multiple clinical conditions requiring care in a critical patient unit and predominantly neurological disease (Table 1).
Socio-demographic characteristics of the sample.
| Women | Men | Total | % | |
|---|---|---|---|---|
| Neurological disease | 6 | 19 | 25 | 38.46 |
| Septic shock | 6 | 2 | 8 | 12.31 |
| Abdominal disease | 2 | 1 | 3 | 4.62 |
| Polytrauma patient | 2 | 9 | 11 | 16.92 |
| Critical burn patient | 1 | 6 | 7 | 10.77 |
| Respiratory disease | 2 | 3 | 5 | 7.69 |
| Stab wound | 0 | 1 | 1 | 1.54 |
| Drug intoxication | 1 | 2 | 3 | 4.62 |
| Diabetic ketoacidosis | 0 | 1 | 1 | 1.54 |
| Tumour disease | 1 | 0 | 1 | 1.54 |
| Total | 21 | 44 | 65 | 100 |
Contrast of means (Table 2) found no differences between the two methods except for the variables chloride (p = .041), prothrombin time (p = .004), and prothrombin activity (p = .003). The mean differences for these parameters were small and close to zero, with narrow confidence intervals: chloride (−.536, .012); prothrombin time (−.092, .019), and prothrombin activity (.284, 1.375) (Table 2), and therefore the differences found had no clinical implications.
Results of the comparison of means of both samples.
| Variable | n | x¯d | 95% CI | p |
|---|---|---|---|---|
| Red blood cells | 64 | .018 | −.001; .036 | .061 |
| Haemoglobin | 64 | .028 | −.026; .082 | .302 |
| Haematocrit | 64 | .091 | −.080; .261 | .293 |
| Platelets | 64 | −2.062 | −6.981; 2.856 | .405 |
| Leukocytes | 64 | −.160 | −.414; .094 | .214 |
| Glucose | 57 | −.158 | −1.571; 1.255 | .825 |
| Urea | 65 | .051 | −.309; .411 | .779 |
| Creatinine | 59 | .002 | −.003; .007 | .456 |
| Sodium | 61 | .049 | −.237; .335 | .778 |
| Potassium | 62 | −.022 | −.047; .003 | .081 |
| Chlorine | 58 | −.274 | −.536; .012 | .041 |
| Prothrombin time | 65 | −.055 | −.092; .019 | .004a |
| Prothrombin activity | 65 | .829 | .284; 1.375 | .003a |
| INR | 65 | −.001 | −.010; .008 | .782a |
| Partial thromboplastin time | 65 | .014 | −.206; .233 | .900 |
| Partial thromboplastin time ratio | 65 | −.001 | −.009; .008 | .911 |
95% CI: 95% confidence interval for the for the mean of the differences; INR: International Normalized Ratio; x¯d: mean of the differences of the values obtained by each method.
In the concordance measures, the calculated ICC (Table 3) was always greater than .9, indicating excellent reliability between the 2 methods. The ranges defined by the upper and lower limits in the Bland-Altman plots and the differences in values obtained by the 1.5 ml discard method versus the standard was not clinically significant (Fig. 1).
Intraclass correlation coefficient and reference change value.
| Variable | n | CCI | 95% CI | RCV 95% | RCV 99% | Maximum variation, % |
|---|---|---|---|---|---|---|
| Red blood cells | 64 | .994 | .989−.996 | 9.96 | 13.11 | 9.22 |
| Haemoglobin | 64 | .994 | .990−.996 | 7.50 | 9.87 | 6.73 |
| Haematocrit | 64 | .994 | .990−.996 | 9.59 | 12.62 | 9.51 |
| Platelets | 64 | .989 | .982−.993 | 31.54 | 41.51 | 22.22 |
| Leukocytes | 64 | .985 | .975−.991 | 38.32 | 50.44 | 15.90 |
| Glucose | 57 | .988 | .981−.993 | 18.10 | 23.83 | 10.34 |
| Urea | 65 | .998 | .997−.990 | 46.02 | 60.58 | 22.22 |
| Creatinine | 59 | .999 | .999–1,000 | 17.64 | 23.22 | 7.14 |
| Sodium | 61 | .960 | .934−.976 | 1.86 | 2.45 | 2.16 |
| Potassium | 62 | .980 | .967−.988 | 13.03 | 17.15 | 8.06 |
| Chlorine | 58 | .973 | .955−.983 | 3.94 | 5.19 | 2.51 |
| Prothrombin time | 65 | .997 | .995−.998 | 13.86 | 18.24 | 3.48 |
| Prothrombin activity | 65 | .991 | .984−.995 | n/a | n/a | 6.89 |
| INR | 65 | .987 | .978−.992 | 6.66 | ||
| Partial thromboplastin time | 65 | .987 | .979−.992 | 9.36 | 12.33 | 10.71 |
| Partial thromboplastin time ratio | 65 | .987 | .979−.992 | n/a | n/a | 10.28 |
95% CI: 95% Confidence Interval; ICC: intraclass correlation coefficient; INR: International Normalized Ratio; n/a: values of intra-individual biological variation for the calculation of RCV not available in European Federation of Clinical Chemistry and Laboratory Medicine26; RCV 95%: reference change value with 95% significance; RCV 99%: reference change value with 99% significance.
.")
Bland-Altman plots: the plot allows for assessment of the magnitude of disagreement between both methods and the identification of outliers or peripheral values. The upper and lower lines represent statistical agreement for the differences between the control and intervention samples with a 95% confidence interval (x¯d±1.96 standard deviations).
There were no results with a variation greater than the limit set by RCV95% except for sodium (RCV95% = 1.86% versus the value with the highest variation in the sample of 2.16%) and partial thromboplastin time (RCV95% = 9.36% versus 10.71%). Both parameters were within acceptance range with RCV99% (2.45% and 12.33%, respectively) (Table 3).
DiscussionThe main finding of this work was the possibility of obtaining blood samples from the temporary CVCs used in our units valid for routine use with a discard volume of 1.5 ml. This result is, in absolute terms, an improvement in terms of blood saving per collection compared to the volume proposed by other authors (5 ml,20 3 ml,11,30 2 ml16). However, although there is a reduction in discard volume, it would be more useful to establish this comparison in relative terms by defining the ratio between the discard volume and the purge volume of the lumen used for extraction, and thus ascertain whether the volume discarded is greater or smaller due to the differences in the size of the CVC used. Specifically, for the present work we used the 3:1 ratio (three times the dead space volume) that Moureau15 defines as the minimum amount that should be used for drawing a sample, and as with the comparison in absolute terms, we found divergences in how many times the dead space should be discarded: 6:1,11 or 5:1,16 the latter with a total discard of 2 ml for a priming volume of .39 ml. However, the flush volume is not always mentioned,18,20,30 and therefore this ratio cannot be used systematically to check for disparity between different studies. As for the 10 ml10 discard, used as a control, it should be noted that this is widespread practice among professionals, with little support in the literature and that it is approximately a 23:1 ratio for our catheter (.44 ml priming volume versus 10ml of discard), much higher than any value previously indicated, and therefore it is justifiable to work towards reducing the volume discarded in line with the objectives proposed in PBM programmes.4
Extraction methods based on discard volume are compared to determine whether the results change when using one or other extraction technique. To find the answer, statistical analysis tools should be accompanied by some measure of clinical significance. Dalton et al.19 point out that the dichotomy between statistical significance and clinical significance had already been introduced by Mayo et al.31 in 1996 when they found statistically significant differences for different coagulation samples that were within a normal range. For the contrast of means, the results vary in both directions, either finding significant differences (p < .05) in all the variables studied16 or, in contrast, no statistically relevant differences in any parameter30 (p > .05). In this study, the 2 scenarios described coexist, with statistically significant differences for the parameters of prothrombin time, prothrombin activity, and chloride. This duality could be because of the small sample sizes.19,20 The measurement of concordance or reproducibility of both methods gives a more homogeneous picture with values that indicate excellent reliability (ICC > .75),16,30 which supports the results of this study with figures for the ICC above .9 for all variables (Table 3).
Finally, if we look at the Bland-Altman plot (Fig. 1), the peripheral or atypical results, that is, those greater or less than the 95% limits of agreement, lacked medical relevance.16,30 However, it became essential to define this concept a priori to set clinically accepted intervals (CAIs) and thus be able to use the proposed volume of discard unequivocally. The approach to this problem was rather empirical and generally by consensus of the expert staff16,30,32 involved in the patient's care. Another proposed solution, used by Wyant and Crickman,12 is to assess whether the treatment to be used would have been different if the values from the control or intervention sample were used, by estimating the amount of insulin units administered according to the glucose value obtained by one or the other method. With all of the above, both solutions have the potential disadvantage of the complexity of generalising CAIs, as consensus on the values to be set may vary between different experts; see, for example, the CAIs set by Villalta García and López-Herranz16 for potassium (−1.01 to 1.03) and sodium (−4.12 to 6.5), compared to those set by Lalthanthuami et al.30: ±.4 and ±4, respectively. Similarly, the protocols established for the administration of different drugs may differ between centres.
The RCV was introduced to bring objectivity to the limits defining the medical relevance of the differences, which, being a statistical tool, lacks subjective implications in the interpretation of changes.32 An added advantage of the RCV, expressed as a percentage, is that the accepted ranges are individualised for each value and, therefore, it is capable of detecting changes in small values of the intervention sample that would be in the accepted range if they were defined statically.16,30 In particular, and to compare the studies by Villalta García and López-Herranz16 and Lalthanthuami et al.,30 in the present work, differences were accepted for the highest sodium value in the sample (150 mEq/l) of ±2.85 and ±3.75 depending on whether RCV95% or RCV99% was applied. Similarly, for the lowest sodium value (131 mEq/l) the CAIs were defined as ±2.49 (RCV95%) and ±3.28 (RCV99%). For potassium, the limits ranged between ±.62 and ±.33 for RCV95%, and between ±.82 and ±.44 for RCV99%. The importance of the CAIs lies in the need to quantify and limit the statement whether or not the results obtained are clinically significant; however, they are not always explicitly mentioned,11,13 or only for some of the variables under study,16,30 which is why, although it is stated that the results have no clinical relevance, it is difficult to establish relationships between the accepted limits of variation between the different studies.
Given the relevance of HAA and its major impact on the critically ill patient, the practical application of reducing discard volume in sample collection could help minimise iatrogenic anaemia by promoting blood saving and thus reducing the need for transfusions and subsequent complications.
The study limitations are that this is a single-centre study and limited to a single type of catheter whose characteristics (brand, material, size, flush volume, etc.) may vary from one institution to another, as may processing of the samples and the machines required for their analysis. Furthermore, work was done on specific hemogram, biochemistry, and coagulation variables which, although basic in any routine study, exclude the wide range of laboratory tests. It is also unknown to what extent the infusion of heparin through the catheter would affect discard volumes, because this is an exclusion criterion. The use of non-probability sampling techniques (convenience sampling) could introduce biases that do not allow the results to be generalised, because the sample may not be representative of the study population.
The results obtained raise new questions for future research, such as the applicability of the method to other types of catheters (arterial, PICC, tunnelled and/or central implanted subcutaneous reservoir catheters) and extension to other analytical parameters.
ConclusionThe results show that it is feasible that valid values can be obtained from blood samples collected with a discard volume of 1.5ml for clinical use and is practice to be included in PBM programmes, because it allows us to reduce blood loss in our patients.
FundingThis research did not receive any specific grant from funding agencies in the public, commercial, or not-for-profit sector.
Conflict of interestsThe authors have no conflict of interests to declare.
We would like to thank Esther Presa Vázquez, Elena Fernández Saiz, and Manuel Prieto Zurera, nurses from the Intensive Care Unit, for their involvement and collaboration in sample collection.
And we would like to thank the staff of the Emergency Laboratory of the Hospital Universitario La Paz.
We would like to thank all the patients who took part in the study.