


Hypertriglyceridemia is an independent risk factor for cardiovascular diseases. This study aimed to determine the prevalence and association of triglyceride level and lifestyle factors among Malay obese class I and II adults.
MethodThis is a cross-sectional study of 65 Malay obese class I and class II adults aged 20-62 years (21 male, 44 female) from sub-urban areas of Malaysia. Overnight fasting venous blood samples were obtained to determine the triglyceride level (mmol/L). Subjects were classified into either normal or elevated triglyceride level groups based on the triglyceride level (normal < 1.6 mmol/L, elevated > 1.7 mmol/L). Unhealthy lifestyle behaviors, defined as smoking status, hours per day spent on sitting passively and sitting with active motion, and the amount of saturated fat, mono-unsaturated and polyunsaturated fat from dietary intake, were measured from 24-h dietary intake and physical activity recall. We compare the variables of unhealthy lifestyle behaviors between subjects with normal and elevated triglyceride level using independent samples t-test.
ResultsAmong 65 obese class I and II adults, 16 subjects (24.6%) were found to have elevated triglyceride levels (mean ± standard deviation of body mass index 31.89 ± 3.29 kg/m2). There are significant differences between subjects having normal and elevated triglyceride level with gender, marital status, the number of children, smoking status, weight and monounsaturated fat intake (all P-values < .05).
ConclusionsThe findings of this study highlighted elevated triglyceride level in obese adults might be influenced by unhealthy lifestyle behaviors. We suggest that lifestyle modification intervention is appropriate to prevent cardiovascular disease among Malay obese class I and II adults.
Triglyceride (TG) is important lipid particles that are stored in adipose tissue subcutaneously where it insulates against heat loss, and internally where it protects viscera against physical damage, and it carries a role as a major source of energy1. There are two sources of TG in the blood stream, in which small amount of TG is from the liver and majority of the TG is from small intestines, absorbed from the dietary intake2,3. The TG metabolism in the blood stream is regulated by the adipocytes4. Adipocytes (also known as fat cells or lipocytes) are the primary content of adipose tissue5.
Obesity is a condition in which there is an excessive accumulation of adipose tissue in the body6. There are several methods to define obesity, but the most common measure-malets are by body mass index (BMI) and waist circumference. In Malaysia, a BMI of more than or equal to 27.5 kg/m2 is considered as obese. On the other hand, a female adult with 80 cm and above, and male with 90 cm and above of waist circumference are categorized as abdominally obese6. According to Jahansouz4, at the cellular level, obesity promote TG storage by decreasing the rate of lipid turnover. Besides that, in obese adults, the excessive adipocytes increased the release of free fatty acids (FFAs)7. The FFAs will be combined with the glycerol (converted from glucose) to form triglycerides and increased the TG level in the blood circulation4.
A normal TG level for Malaysian population is less than 1.7 mmol/L8. In some circumstances, an individual may be having an abnormal TG level in the body, called hypertri-glyceridemia3. Based on the classification provided by the Malaysian clinical practice guideline (CPG) of dyslipidaemia, an adults with a serum TG level of 1.7 to 2.2 mmol/L is diagnosed as borderline high TG, 2.3-5.7 mmol/L as high TG and > 5.7 mmol/L as very high TG8. Different stages of hy-pertriglyceridemia need different managemalet3. However, in all stages of hypertriglyceridemia, lifestyle changes are highlighted3,8. The lifestyle changes include weight reduction, low fat and low carbohydrate diet, exercise and smoking cessation.
However, in Malaysia, there is still a lack of published article on the prevalence of hypertriglyceridemia and its association with lifestyle factors, this is mainly because of the debated issue about the role of TG as a biomarker of cardiovascular disease (CVD). According to Miller9, the debated issues including lack of dose-response relationship between TG and CVD risk, minimal incremaletal CVD risk posed by elevated TG, and lack of clinical data demonstrating that reducing TG level would favorably influence CVD event rates. Besides that, there is increasing the prevalence of obesity, as reported in the Malaysian National Health and Morbidity Survey (NHMS) report. Based on the most recent NHMS 2015, it was stated that the prevalence of obese adults was 30.6%, indicating an increase of 3.4% since the last report in 201110. With the growing number of obese adults, growing incidence of individual with hypertriglyc-eridemia is projected.
Thus, this study proposed to determine the prevalence of hypertriglyceridemia among Malay obese adults. Documentation of the prevalence of hypertriglyceridemia in Malay obese adults might provide significant clinical importance in healthcare practices. Also, this study aimed to determine the dietary fat intake and hours spent for sitting per day among Malay obese adults and to determine the association between dietary fat intake and sitting time with triglyceride level among Malay obese class I and II adults.
MethodParticipantsThe current study recruited sixty-five obese class I and II adults from suburban areas of Kuantan. The sample size was calculated using Epi-Info software version 7, based on the prevalence of obese class I and II adults in Pahang as stated before. Data was collected from all participants by one same researcher. The data collection period was between December 2015 and July 2016. The recruitment strategy, consent forms, and data collection protocols for the was approved by the University Research Ethic Committee and Medical Research and Ethics Committee (MREC), Ministry of Health.
All participants underwent anthropometric assessment including weight and height measurement, and weight calculated BMI in kilograms divided by the square of height in meters6. Also, blood samples for serum TG level were drawn from antecubital fossa of all participants after approximately nine to 12 h of fasting. The blood samples were labeled and packed according to the standard protocol and sent to a laboratory for analysis within 2 h. All adults with self-reported of any chronic diseases and endocrine disorders, pregnant and lactating female, taking any medications for chronic and endocrine diseases wer excluded from this study. Importantly, all participants were consented to participate in the study.
Instruments and procedureIn this study, the BMI cutoff points from Malaysian CPG of obesity were used to define obesity. Obesity class I was defined as having a BMI between 27.5 kg/m2 and 34.9 kg/m2, and obese class II was defined as having a BMI between 35 kg/m2 and 39.9 kg/m26. These cut-off points were used, instead of the cut-off points from the World Health Organization (WHO) is because it was more sensitive to Malaysian adults population. For the serum TG level, the cut-off points were adopted from the CPG of dyslipidemia. An obese adult with TG level of > 1.7 mmol/L is regarded as having elevated TG level.
For the dietary fat intake and hours spent on sitting per day, the data are obtained from the 24-h dietary intake and physical activity recall method. All participants were asked to recall the details of food and beverages that they consumed in a day before the interview session with the researcher. The 24-h dietary recall was obtained to reveal the distribution dietary fat intake consumed per day. All data obtained from 24-h dietary recall was entered in Nutritionist Pro software for analysis. The outcomes are the value of saturated fat (SF), monounsaturated fat (MUFA) and polyunsaturated fat (PUFA) in grams. On the other hand, 24-h physical activity recall was obtained to reveal the distribution of mean minutes spent on sitting. All data obtained from 24-h physical activity recall was manually calculated to determine the minutes spent for seating passively and seating with active motion.
Data analysisData were analyzed using the Statistical Package for Social Sciences (SPSS, version 21). Means ± standard deviation (SD) were used to describe continuous variables while frequencies and percentages were used to describe the categorical data. No missing values were observed. The difference on variables between obese adults with normal or elevated TG level was analyzed using independent samples t-test. A P value < .05 was considered as statistical significance. Additionally, the Pearson correlation test was conducted to determine the strength of the relationship between TG level with dietary fat intake and sitting time. A Pearson correlation coefficient (r) value of 0.31 to 0.50 indicates a weak, 0.51 to 0.70 indicates a moderate and 0.71 to 0.90 indicates a strong strength of correlation between the dependent and independent variables. A P value < .05 was considered as statistical significance.
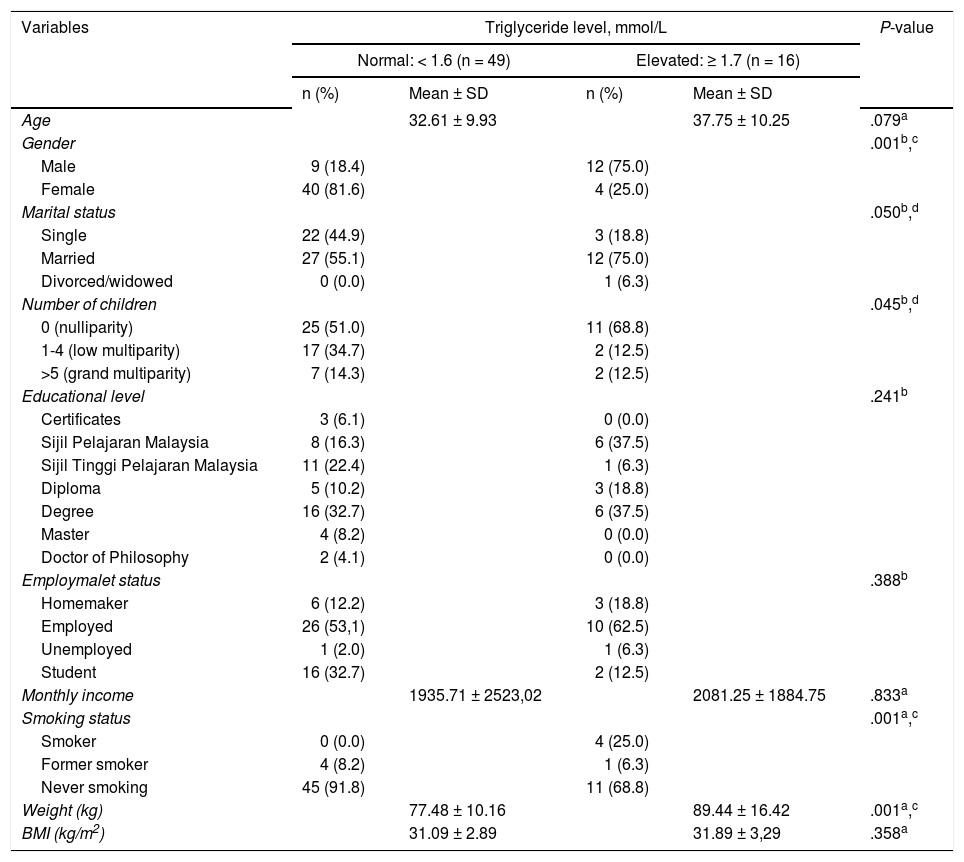
Results and discussionThe sociodemographic background and physical measures of the study participants are described in Table 1. The prevalence of hypertriglyceridemia in obese adults is presented in Table 2. The mean age ± SD of all participants was 33.88 ± 10.17 years and ranged between 20 to 62 years. There are no differences in the age of obese adults with normal or elevated TG level, but it is noteworthy to state that obese adults with elevated TG level were older (37.75 ± 10.25 years) compared to those with normal TG level (32.61 ± 9.93 years). The findings of this study showed that majority of the study participants were female (n = 44), married (n = 39), low multi-parity or having 1 to 4 children to date (n = 28), have diploma as the highest education achievemalet (n = 22), employed (n= 36) and was never smoking in life (n = 56). In all WHO regions, female were more likely to be obese than male11. Similarly, in Malaysia, NHMS 2015 reported that the prevalence of obesity (BMI > 27.5 kg/m2) was higher in female (33.6%) than male (27.8%)10. Other studies also reported the same findings12,13. A possible explanation for this phenomanon might be due to female traditionally prepares the food for the family that increases their access to food more than male14. Other than that, the increasing prevalence of obesity in female might be influenced by the employment as the working female were reported to consume more fast food13.
Comparison of the sociodemographic background and anthropometric measures between obese adults with normal and elevated triglyceride level (n = 65)
| Variables | Triglyceride level, mmol/L | P-value | |||
|---|---|---|---|---|---|
| Normal: < 1.6 (n = 49) | Elevated: ≥ 1.7 (n = 16) | ||||
| n (%) | Mean ± SD | n (%) | Mean ± SD | ||
| Age | 32.61 ± 9.93 | 37.75 ± 10.25 | .079a | ||
| Gender | .001b,c | ||||
| Male | 9 (18.4) | 12 (75.0) | |||
| Female | 40 (81.6) | 4 (25.0) | |||
| Marital status | .050b,d | ||||
| Single | 22 (44.9) | 3 (18.8) | |||
| Married | 27 (55.1) | 12 (75.0) | |||
| Divorced/widowed | 0 (0.0) | 1 (6.3) | |||
| Number of children | .045b,d | ||||
| 0 (nulliparity) | 25 (51.0) | 11 (68.8) | |||
| 1-4 (low multiparity) | 17 (34.7) | 2 (12.5) | |||
| >5 (grand multiparity) | 7 (14.3) | 2 (12.5) | |||
| Educational level | .241b | ||||
| Certificates | 3 (6.1) | 0 (0.0) | |||
| Sijil Pelajaran Malaysia | 8 (16.3) | 6 (37.5) | |||
| Sijil Tinggi Pelajaran Malaysia | 11 (22.4) | 1 (6.3) | |||
| Diploma | 5 (10.2) | 3 (18.8) | |||
| Degree | 16 (32.7) | 6 (37.5) | |||
| Master | 4 (8.2) | 0 (0.0) | |||
| Doctor of Philosophy | 2 (4.1) | 0 (0.0) | |||
| Employmalet status | .388b | ||||
| Homemaker | 6 (12.2) | 3 (18.8) | |||
| Employed | 26 (53,1) | 10 (62.5) | |||
| Unemployed | 1 (2.0) | 1 (6.3) | |||
| Student | 16 (32.7) | 2 (12.5) | |||
| Monthly income | 1935.71 ± 2523,02 | 2081.25 ± 1884.75 | .833a | ||
| Smoking status | .001a,c | ||||
| Smoker | 0 (0.0) | 4 (25.0) | |||
| Former smoker | 4 (8.2) | 1 (6.3) | |||
| Never smoking | 45 (91.8) | 11 (68.8) | |||
| Weight (kg) | 77.48 ± 10.16 | 89.44 ± 16.42 | .001a,c | ||
| BMI (kg/m2) | 31.09 ± 2.89 | 31.89 ± 3,29 | .358a | ||
Financially, the average monthly income of the study participants was RM 1971.54. According to Amran (2015) in the report of the Household Income and Basic Amenities Survey 201415, the mean monthly household income for Malaysian was RM 6141. The monthly income of obese adults in this study is lower even if the amount is doubled (RM 3943.08). This finding is similar in several studies that found that obesity is more prevalent in low-income population16,17. Besides that, some studies claimed that obesity reduces the employ-ability rates18,19. Thus, obese adults might have limited job offers and less demand towards higher economic status.
Table 1 also showed the comparison of the sociodemograph-ic background between obese adults with normal and elevated TG level. The results showed that the prevalence of elevated TG was significantly differed in gender (P = .001), marital status (P = .050), some children (P = .045) and smoking status (P = .001). There is a higher prevalence of elevated TG level in male gender, married, having 1-4 children and is a current smoker. The findings on male are more prevalent to have elevated TG level support the previous cross-sectional study conducted by Chu and Moy20 to determine the TG level among Malay adults in a developing country, Malaysia. The findings showed that male have significantly higher serum TG level (1.8 ± 1.0 mmol/L) compared to female (1.2 ± 0.6mmol/L)20. With regards to the anthropometric measures, the mean ± SD of weight, height, and BMI of the study participants are 80.43 ± 19.95 kg, 160.07 ± 8.54 cm and 31.29 ± 2.99 kg/m2, respectively. The average weight of obese adults with elevated TG level was higher as compared to those with normal TG level (P = .00) (Table 1). The findings support the current evidence that showed an increase in weight contributes to increasing in adipose tissue promote TG storage and reduce TG removal, thus increase the circulating TG in the blood4.
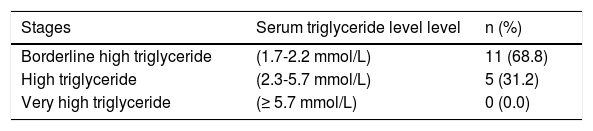
In Table 2, the prevalence of hypertriglyceridemia is presented. The prevalence of overall hypertriglyceridemia (serum TG level> 1.7 mmol/L) was 24.9% (n = 16). Among those with elevated TG level, 68.8% of them have borderline high TG (serum TG range between 1.7 to 2.2 mmol/L) and 31.2% of them have high TG (serum TG range between 2.3 to 5.6 mmol/L) was 7.7%. There is no obese adult with very high TG level found in this study. In Korea, the prevalence of hypertriglyceridemia among adults was 26.7%, and there is linear-positive association between increasing BMI and hypertriglyceridemia21. Besides, among 1200 Northern Mexican adult population, more than half of the subjects had elevated TG levels22. Also, in a study among 122 obese employees in Kentucky, the result showed that 40% of the participants had borderline and high TG values23. These findings provide an insight that there is a high prevalence of elevated TG level in adults, even higher in obese adults.
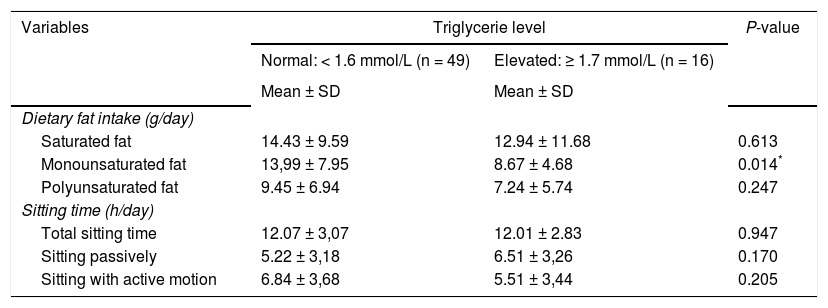
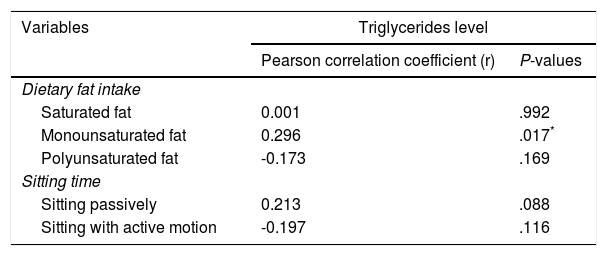
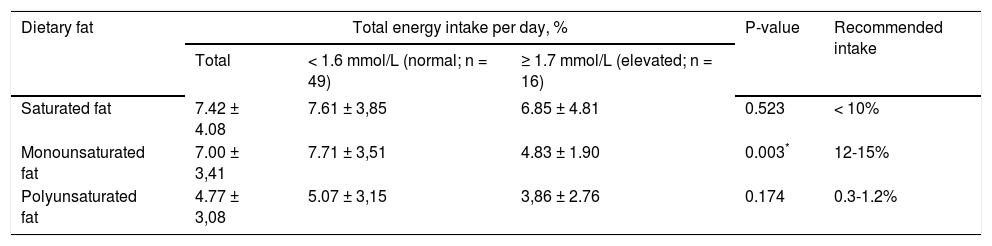
Furthermore, this study measures the dietary fat intake and hours spent for sitting per day, to determine its correlation with TG level. The mean ± SD of dietary fat intake and sitting time are displayed in Table 3. There are three components of dietary fat intake measured in this study, which are SF, MUFA and PUFA. The mean ± SD of SF, MUFA and PUFA intake among obese adults are 14.06 ± 10.07 g/day, 12.68 ± 7.61 g/day and 8.93g/day, respectively. There are significantly different on MUFA intake among obese adults with normal and elevated TG level (P = .014). Obese adults with elevated TG level consumed less MUFA than those with normal TG level. Pearson correlation also revealed that there is significant positive correlation between the MUFA intake and TG level (r = 0.296; P = .017). No significant correlation was found between SF and PUFA with TG level (Table 4). Based on the Malaysian recommended nutrient intake (RNI) guideline, the recommended intake of SF, MUFA and PUFA are < 10%, 12-15% and 0.3-1.2% of total energy intake, respectively24. Table 5 showed the percentage of SF, MUFA and PUFA from total energy intake. Based on the recommended intake values, obese adults in the current study have a normal intake of SF, but less intake of MUFA and more than recommended intake of PUFA. Independent sample T-test showed that there are significantly different in the percentage of MUFA of total energy intake between obese adults with normal and elevated TG level (P = .003). Obese adults with elevated TG level consumed lower amount of MUFA compared to those with normal TG level. According to Ron-danelli et al25 and Gonzalez-Campoy et al26, MUFA is beneficial to reduce the risk of CVD. Thus, the healthcare provider should provide more information regarding the MUFA intake to educate the obese adults so that the prevalence of hypertriglyceridemia can be reduced.
Comparison of the dietary fat intake and hours spent for sitting between obese adults with normal and elevated triglyceride level level (n = 65)
| Variables | Triglycerie level | P-value | |
|---|---|---|---|
| Normal: < 1.6 mmol/L (n = 49) | Elevated: ≥ 1.7 mmol/L (n = 16) | ||
| Mean ± SD | Mean ± SD | ||
| Dietary fat intake (g/day) | |||
| Saturated fat | 14.43 ± 9.59 | 12.94 ± 11.68 | 0.613 |
| Monounsaturated fat | 13,99 ± 7.95 | 8.67 ± 4.68 | 0.014* |
| Polyunsaturated fat | 9.45 ± 6.94 | 7.24 ± 5.74 | 0.247 |
| Sitting time (h/day) | |||
| Total sitting time | 12.07 ± 3,07 | 12.01 ± 2.83 | 0.947 |
| Sitting passively | 5.22 ± 3,18 | 6.51 ± 3,26 | 0.170 |
| Sitting with active motion | 6.84 ± 3,68 | 5.51 ± 3,44 | 0.205 |
The correlation between dietary fat intake and sitting time with triglyceride levels among obese class I and II adults (n= 65)
| Variables | Triglycerides level | |
|---|---|---|
| Pearson correlation coefficient (r) | P-values | |
| Dietary fat intake | ||
| Saturated fat | 0.001 | .992 |
| Monounsaturated fat | 0.296 | .017* |
| Polyunsaturated fat | -0.173 | .169 |
| Sitting time | ||
| Sitting passively | 0.213 | .088 |
| Sitting with active motion | -0.197 | .116 |
The distribution of saturated fat, monounsaturated fat and polyunsaturated fat intake among obese adults (n = 65)
| Dietary fat | Total energy intake per day, % | P-value | Recommended intake | ||
|---|---|---|---|---|---|
| Total | < 1.6 mmol/L (normal; n = 49) | ≥ 1.7 mmol/L (elevated; n = 16) | |||
| Saturated fat | 7.42 ± 4.08 | 7.61 ± 3,85 | 6.85 ± 4.81 | 0.523 | < 10% |
| Monounsaturated fat | 7.00 ± 3,41 | 7.71 ± 3,51 | 4.83 ± 1.90 | 0.003* | 12-15% |
| Polyunsaturated fat | 4.77 ± 3,08 | 5.07 ± 3,15 | 3,86 ± 2.76 | 0.174 | 0.3-1.2% |
On the other hand, Table 4 shows the average total sitting time of all obese adults was 12.05 ± 2.99 h. In detail, on average, obese adults spent 5.54 ± 3.22 h for seating passively and 6.51 ± 3.65 h for sitting with active motions. There are no significant different in the amount of time spent for sitting between obese adults with normal or elevated TG level. However, notably, obese adults with elevated TG level spend an average extra 1281 ± 0.92 h for seating passively than obese adults with normal TG level. The findings indicated that reducing the hours spent on sitting passively might be beneficial to reduce the risk of hypertriglyceridemia27.
ConclusionsThe findings of this survey highlighted that there is a high prevalence of obese adults with elevated TG level. Elevated TG level in obese adults might be determined by low MUFA intake. Therefore, we suggest that lifestyle modification intervention by offering the necessary training and monitoring towards promoting the higher MUFA intake might reduce the prevalence of TG level among obese adults.
