

The introduction of pneumococcal conjugate vaccine (PCV) into childhood vaccination programmes has reduced the prevalence of vaccine serotypes (VTs) that cause invasive pneumococcal disease (IPD) in children. In the elderly population, an impact has also been seen through indirect protection (herd effect). The aim of this study was to estimate the changes in serotype distribution and antimicrobial susceptibility of Streptococcus pneumoniae isolates recovered from adult IPD and to evaluate the indirect effect of immunization with PCV10 based on laboratory records by analyzing the period from 2005 to 2019 for six years before and eight years after the universal PCV10 administration to Colombian children.
MethodsA total of 2204 S. pneumoniae isolates from adults (≥50 years) with IPD were analyzed. The analysis examined the percentage changes in proportions (prevalence) and percentage variations in population rates (annual reported rates – ARR) of VTs between the pre-PCV10 (2005–2009) and post-PCV10 (2015–2019) periods.
ResultsThe findings were (1) evidence of a significant percentage decrease of pneumococcal VT10 causing IPD in adults (50% pre-PCV10 and 16% post-PCV10); (2) significant increase of serotype 19A (from 1.6% to 14.8%) and less important increase of serotype 3 (from 10.5% to 14.5%) and non-vaccine serotypes (NVT) (from 21.4% to 38.4%) non-significant; and (3) meningitis and non-meningitis multidrug resistant isolates associated with serotype 19A. An improvement in the surveillance system is associated with the immunization of children, as noted by the increased ARRs across the analysis period.
ConclusionsOur results show the indirect impact of PCV10 vaccination in children on the VT10 distribution and antimicrobial resistance of S. pneumoniae causing IPD in Colombian adults over 50 when comparing the pre-PCV10 (2005–2009) and post-PCV10 (2015–2019) periods.
La introducción de las vacunas neumocócicas conjugadas (pneumococcal conjugate vaccines [PCV]) en los programas de vacunación infantil ha reducido la prevalencia de los serotipos vacunales (vaccine serotypes [VT]) que causan la enfermedad neumocócica invasiva (ENI) en los niños. En la población adulta también se ha visto un impacto a través de la protección indirecta (efecto rebaño). El objetivo de este estudio fue estimar los cambios en la distribución de serotipos y la susceptibilidad antimicrobiana de aislamientos de Streptococcus pneumoniae recuperados de ENI de adultos y evaluar el efecto indirecto de la inmunización con PCV10 con base en registros de laboratorio mediante el análisis del período de 2005 a 2019, seis años antes y ocho años después de la administración universal de PCV10 a niños colombianos.
MétodosSe analizaron un total de 2.204 aislamientos de S. pneumoniae de adultos (≥50años) con ENI. Se examinaron los cambios porcentuales en las proporciones (prevalencia) y las variaciones porcentuales en las tasas poblacionales (tasas anuales informadas [annual reported rates, ARR]) de VT entre los períodos anterior (2005-2009) y posterior a PCV10 (2015-2019).
ResultadosLos hallazgos fueron: 1) evidencia de una disminución porcentual significativa de los serotipos incluidos en la VT10 neumocócica que causa ENI en adultos (50% pre-PCV10 y 16% post-PCV10); 2) aumento significativo del serotipo 19A (del 1,6% al 14,8%) y aumento menos importante del serotipo 3 (del 10,5% al 14,5%) y de aislados no tipables (NVT) (del 21,4% al 38,4%) no significativo, y 3) aislamientos multirresistentes de meningitis y no-meningitis asociados con el serotipo 19A. Se asoció una mejora en el sistema de vigilancia junto con la inmunización de los niños, como se observa en el aumento de las ARR durante el periodo de análisis.
ConclusionesEstos resultados demuestran el impacto indirecto de la vacunación con PCV10 en niños en la distribución de serotipos VT10 y en la resistencia a antimicrobianos de S. pneumoniae causante de ENI en adultos colombianos mayores de 50 años, cuando se compara el periodo pre-PCV10 (2005-2009) con el post-PCV10 (2015-2019).
The introduction of pneumococcal conjugate vaccines (PCV) has changed the epidemiology of invasive pneumococcal disease (IPD) and has significantly reduced the number of cases caused by the serotypes that are included in the vaccine serotypes (VT) both in children by direct impact and in adults due to indirect protection. However, an increase in IPD caused by Streptococcus pneumoniae non-vaccine serotypes (NVT) has been reported.1–3
The pneumococcal 7-valent conjugate vaccine (PCV7) was introduced in Bogotá (Colombia) in 2009 and since January 2012, it was replaced by the pneumococcal 10-valent conjugate vaccine (PCV10) which was introduced universally in Colombia to populations born on or after November 1, 2011, in a 2+1 schedule at 2, 4, and 12 months of age. This vaccine is currently administered with a 94.5% coverage rate.4 Since 2008, the pneumococcal polysaccharide vaccine (PPV23) has been recommended in Colombia for disease prevention in adults older than 60 years. However, only partial data are known on the impact of this vaccine on IPD in adults in the city of Bogotá.5 The aim of this study was to estimate the changes in serotype distribution and antimicrobial susceptibility of S. pneumoniae isolates recovered from adult IPD and to evaluate the indirect effect of immunization with PCV10 based on laboratory records by analyzing the period from 2005 to 2019 including six years before and eight years after the universal PCV10 administration to Colombian children.
MethodsPneumococcal isolatesA total of 2204 S. pneumoniae isolates from normally sterile body sites of adults (≥50 years old) with IPD from 2005 to 2019 were recovered from hospital laboratories and confirmed by the National Reference Laboratory (NRL) in Colombia, as part of the passive laboratory-based surveillance SIREVA II6 network that was established in 1993 in the Latin American and Caribbean countries, which was encouraged by the Pan American Health Organization (PAHO).
Microbiological confirmation, serotyping and antibiotic susceptibility testingThe serotypes were determined by the Quellung reaction (Statens Serum Institut-Copenhagen, Denmark).7 Antimicrobial susceptibility tests were performed by the broth microdilution method to penicillin (PEN), ceftriaxone (CRO), trimethoprim–sulfamethoxazole (SXT), chloramphenicol (CHL), tetracycline (TET), erythromycin (ERY), and vancomycin (VAN). The results were interpreted using CLSI guidelines.8 Multi-drug resistance (MDR) was defined as resistance to three or more antibiotic families.
Statistical analysisThe serotypes were also categorized in accordance with those included in PCV10: VT10 (1, 4, 5, 6B, 7F, 9V, 14, 18C, 19F, and 23F); thirteen additional included in PPV23: AddVT23 (2, 3, 8, 9N, 10A, 11A, 12F, 5B, 17F, 19A, 20, 22F, 33F), NVT (non-PCV10 and non-PP23), and non-typable isolates (NT); AddVT23, serotypes 3 and 19A were analyzed separately. The annual reported rates (ARRs) were expressed as the number of isolates serotyped per 100,000 population using population denominator projections from the National Statistics Institute (DANE acronym in Spanish) for those years included in the analysis as proxy of IPD occurrence.9 The World Health Organization (WHO) 2000 standard population was used as the reference population for age and sex standardization.10 The annual average ARRs were estimated to compare the two epidemiological periods, pre- and post-PCV10. Data statistical analyses and visualization were carried out in R software, version 4.0.2 (R Foundation Statistical Computing, Austria. URL: https://www.R-project.org/). The annual serotype percentages were compared using the χ2 test for percentage trends with a 95% CI or Fisher's exact test when small samples (category of analysis with n<5) were excluded using the χ2 test. The serotype temporal trend p values were interpreted as trend variations of the percentages and absolute numbers during the 2005–2019 study period.11
Percentage changes in the proportions and variations of population ratesTwo impact analyses were performed. First, the percentage of change was determined using the proportion (prevalence) of each individual serotype or groups divided by the annual total isolates in a national aggregation, a trend analysis (p-value of trend) was performed to identify whether the proportion variations in the observed period were statistically significant. Second, the variations in the ARRs of IPD were estimated with confidence intervals. For both analyses, a confidence level of 95% (alpha=0.05) was defined for the interpretations.12
ResultsPneumococcal isolate distributions and annual reported rates (ARRs)The analysis was performed with 2155 isolates from 16/32 departments (50%), 49 isolates from 9 departments were excluded because there were fewer than 10 isolates over the period of the study (2005–2019). The distributions by department, period and year of surveillance are shown in Tables 1S and 2S. The data show an increase in the surveillance in recent years, with an increase from 314 isolates from 2005 to 2009 (pre-PCV10) to 1190 from 2015 to 2019 (post-PCV10). Fig. 1S shows the departments where S. pneumoniae isolates were recovered, the most populated regions of the country, being Bogotá, Antioquia and Valle also the greatest contributors.
The number of isolates and the ARRs per 100,000 adults ≥50 years by department showed increases when comparing the pre-PCV10 and post-PCV10 periods: mainly in Bogotá with 136 (43.3%) isolates to 358 (30.1%) and ARRs from 1636 to 4540 isolates per 100,000; Antioquia with 89 (28.3%) to 329 (27.6%) isolates and ARRs from 1625 to 4227 isolates; and Valle with 46 (14.6%) to 222 (18.7%) and ARRs from 2077 to 5848 isolates (Tables 1S–3S and Fig. 2S).
Among 2155 isolates, 1165 (54.1%) were from male patients, 946 (43.9%) were from patients ≥70 years old, and 420 (19.5%) were from patients ≥80 years old. Table 4S shows the distribution of isolates by age group and period. The isolates were recovered from 1810 blood samples (84.0%), 269 cerebrospinal fluid samples (12.5%), 53 pleural fluid samples (2.5%), and 23 from other samples (1.1%). Sepsis was the most frequent clinical diagnosis for 1204 (55.9%) of the isolates and was followed by pneumonia 603 (28.0%), meningitis 323 (15.0%), and other IPDs 25 (1.2%) (Tables 5S and 6S). The pneumococcal vaccination status in adults was unknown.
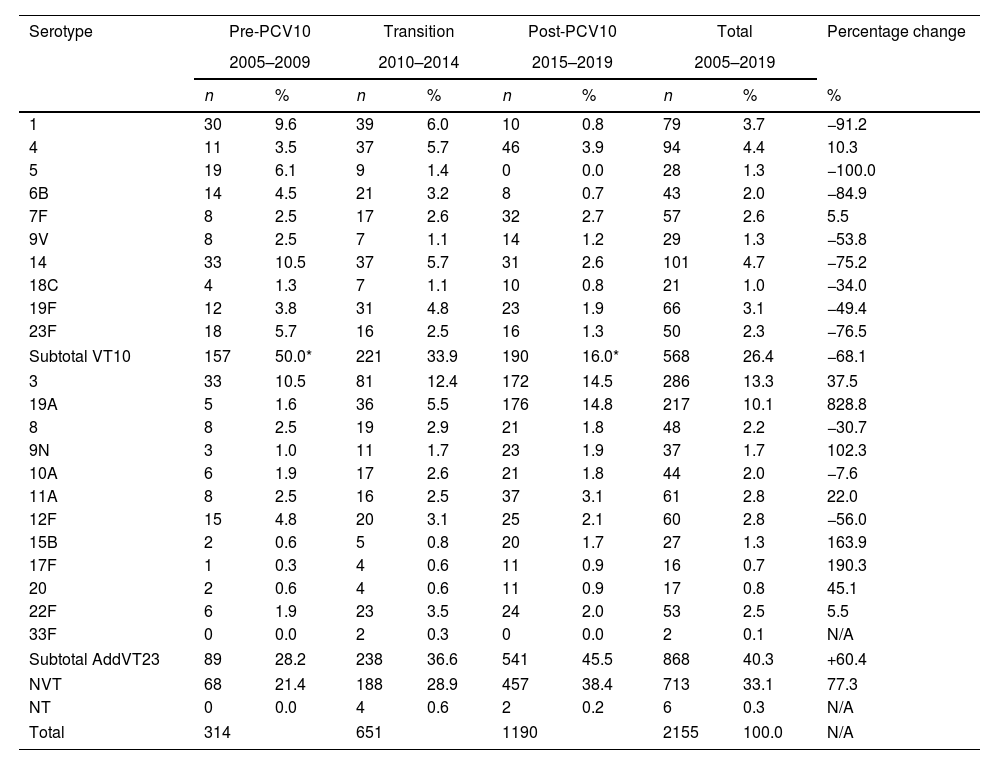
Serotype distributionA total of sixty-three serotypes were identified. The proportion of VT10 isolates was 26.3% (568); the proportion of AddVT23 was 40.3% (868), which consisted mainly of serotypes 3 (286; 13.3%) and 19A (217; 10.1%); the proportion of NVT with 41 different serotypes corresponded to 33.1% (713) of total isolates; while only 0.3% (6 isolates) were NT. Serotype 2 included in VT23 was not recovered.
The differences in the serotype proportions in the three periods are shown in Fig. 1, and in Table 7S. We observed that the trend for VT10 isolates significantly decreased from 50% in 2005–2009 (pre-PCV10) (p<0.0001) to 16% in 2015–2019 (post-PCV10) (p<0.0001), especially for serotypes 1 (9.9–0.8%), 14 (10.5–2.6%), 6B (4.5–0.7%), and 23F (5.7–1.3%). The increasing trend of AddVT23 was not statistically significant (p=0.71), but serotype 19A increased significantly from 1.6% in the pre-PCV10 period to 14.8% in the post-PCV10 period (p<0.0001). The NVT trend (from 21.4% to 38.4%) was mainly due to serotypes 6C (1.3–6.3%), 15A (2.2–4.2%), 23A (1–5%), 23B (0.6–3%), and 35B (0.6–2.6%), which represented 54.3% of all isolates (248/457) in the post-PCV10 period.
, transition (2010–2014) and post-PCV10 (2015–2019) periods. VT10: serotypes included in PCV10 (1, 4, 5, 6B, 7F, 9V, 14, 18C, 19F, 23F), AddVT23: the 13 additional PPV23 (2, 3, 8, 9N, 10A, 11A, 12F, 5B, 17F, 19A, 20, 22F, 33F), NVT: non-vaccine type, NT: non-typable, NA: not apply. Black line represents the number of Streptococcus pneumoniae isolates recovered per year of surveillance.")
Percentages of Streptococcus pneumoniae isolates by VT10, AddVT23, NVT, VT, and the pre-PCV10 (2005–2009), transition (2010–2014) and post-PCV10 (2015–2019) periods. VT10: serotypes included in PCV10 (1, 4, 5, 6B, 7F, 9V, 14, 18C, 19F, 23F), AddVT23: the 13 additional PPV23 (2, 3, 8, 9N, 10A, 11A, 12F, 5B, 17F, 19A, 20, 22F, 33F), NVT: non-vaccine type, NT: non-typable, NA: not apply. Black line represents the number of Streptococcus pneumoniae isolates recovered per year of surveillance.
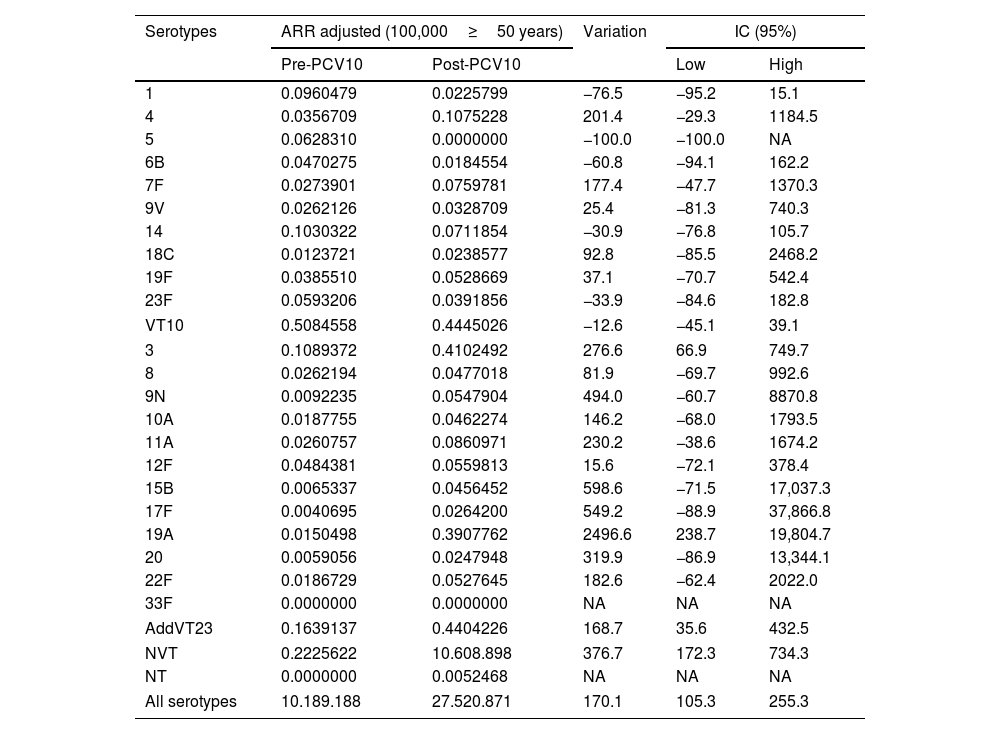
Changes in percentages between the pre- and post-PCV10 periods were −68.1% for VT10 and +60.4% for AddVT23. We highlight the changes in percentages of serotypes 14 (−75.2%), 19A (+828.8%), 3 (+37.5%) and NVT (+77.3%). Due to the low number of isolates, the percentage changes were only calculated for the categories mentioned in Table 1. The ARR variations were significant for serotypes 3 (276.6, 95% CI: 66.9–749.7); 19A (2496, 95% CI: 238.7–19804.7) and NVT (376.7, 95% CI: 172.3–734.3) and for the total of isolates received during the surveillance period (170.1, 95% CI: 105.3–255.3). The average adjusted ARRs of the S. pneumoniae serotypes are shown in Table 2. Eighty-five percent (1832/2155) of the isolates were recovered from patients with a clinical diagnosis of non-meningitis, and the most frequent serotypes were 3, 19A, 14 and 6C. For meningitis the most frequent serotypes were 19A, 19F and 3. Table 8S shows the serotype distributions by diagnosis and type of vaccine.
Distributions of Streptococcus pneumoniae serotypes by VT10, AddVT23, NVT, VT, and periods.
| Serotype | Pre-PCV10 | Transition | Post-PCV10 | Total | Percentage change | ||||
|---|---|---|---|---|---|---|---|---|---|
| 2005–2009 | 2010–2014 | 2015–2019 | 2005–2019 | ||||||
| n | % | n | % | n | % | n | % | % | |
| 1 | 30 | 9.6 | 39 | 6.0 | 10 | 0.8 | 79 | 3.7 | −91.2 |
| 4 | 11 | 3.5 | 37 | 5.7 | 46 | 3.9 | 94 | 4.4 | 10.3 |
| 5 | 19 | 6.1 | 9 | 1.4 | 0 | 0.0 | 28 | 1.3 | −100.0 |
| 6B | 14 | 4.5 | 21 | 3.2 | 8 | 0.7 | 43 | 2.0 | −84.9 |
| 7F | 8 | 2.5 | 17 | 2.6 | 32 | 2.7 | 57 | 2.6 | 5.5 |
| 9V | 8 | 2.5 | 7 | 1.1 | 14 | 1.2 | 29 | 1.3 | −53.8 |
| 14 | 33 | 10.5 | 37 | 5.7 | 31 | 2.6 | 101 | 4.7 | −75.2 |
| 18C | 4 | 1.3 | 7 | 1.1 | 10 | 0.8 | 21 | 1.0 | −34.0 |
| 19F | 12 | 3.8 | 31 | 4.8 | 23 | 1.9 | 66 | 3.1 | −49.4 |
| 23F | 18 | 5.7 | 16 | 2.5 | 16 | 1.3 | 50 | 2.3 | −76.5 |
| Subtotal VT10 | 157 | 50.0* | 221 | 33.9 | 190 | 16.0* | 568 | 26.4 | −68.1 |
| 3 | 33 | 10.5 | 81 | 12.4 | 172 | 14.5 | 286 | 13.3 | 37.5 |
| 19A | 5 | 1.6 | 36 | 5.5 | 176 | 14.8 | 217 | 10.1 | 828.8 |
| 8 | 8 | 2.5 | 19 | 2.9 | 21 | 1.8 | 48 | 2.2 | −30.7 |
| 9N | 3 | 1.0 | 11 | 1.7 | 23 | 1.9 | 37 | 1.7 | 102.3 |
| 10A | 6 | 1.9 | 17 | 2.6 | 21 | 1.8 | 44 | 2.0 | −7.6 |
| 11A | 8 | 2.5 | 16 | 2.5 | 37 | 3.1 | 61 | 2.8 | 22.0 |
| 12F | 15 | 4.8 | 20 | 3.1 | 25 | 2.1 | 60 | 2.8 | −56.0 |
| 15B | 2 | 0.6 | 5 | 0.8 | 20 | 1.7 | 27 | 1.3 | 163.9 |
| 17F | 1 | 0.3 | 4 | 0.6 | 11 | 0.9 | 16 | 0.7 | 190.3 |
| 20 | 2 | 0.6 | 4 | 0.6 | 11 | 0.9 | 17 | 0.8 | 45.1 |
| 22F | 6 | 1.9 | 23 | 3.5 | 24 | 2.0 | 53 | 2.5 | 5.5 |
| 33F | 0 | 0.0 | 2 | 0.3 | 0 | 0.0 | 2 | 0.1 | N/A |
| Subtotal AddVT23 | 89 | 28.2 | 238 | 36.6 | 541 | 45.5 | 868 | 40.3 | +60.4 |
| NVT | 68 | 21.4 | 188 | 28.9 | 457 | 38.4 | 713 | 33.1 | 77.3 |
| NT | 0 | 0.0 | 4 | 0.6 | 2 | 0.2 | 6 | 0.3 | N/A |
| Total | 314 | 651 | 1190 | 2155 | 100.0 | N/A | |||
VT10: serotypes included in PCV10 (1, 4, 5, 6B, 7F, 9V, 14, 18C, 19F, 23F), AddVT23: the 13 additional PPV23 (2, 3, 8, 9N, 10A, 11A, 12F, 5B, 17F, 19A, 20, 22F, 33F), NVT: non-vaccine type, NT: non-typable, NA: not apply.
* Significant at p<0.05.
Variation in ARRs by 100,000 adults≥50 years of Streptococcus pneumoniae serotypes between the pre-PCV10 (2005–2009) and post-PCV10 (2015–2019) periods.
| Serotypes | ARR adjusted (100,000≥50 years) | Variation | IC (95%) | ||
|---|---|---|---|---|---|
| Pre-PCV10 | Post-PCV10 | Low | High | ||
| 1 | 0.0960479 | 0.0225799 | −76.5 | −95.2 | 15.1 |
| 4 | 0.0356709 | 0.1075228 | 201.4 | −29.3 | 1184.5 |
| 5 | 0.0628310 | 0.0000000 | −100.0 | −100.0 | NA |
| 6B | 0.0470275 | 0.0184554 | −60.8 | −94.1 | 162.2 |
| 7F | 0.0273901 | 0.0759781 | 177.4 | −47.7 | 1370.3 |
| 9V | 0.0262126 | 0.0328709 | 25.4 | −81.3 | 740.3 |
| 14 | 0.1030322 | 0.0711854 | −30.9 | −76.8 | 105.7 |
| 18C | 0.0123721 | 0.0238577 | 92.8 | −85.5 | 2468.2 |
| 19F | 0.0385510 | 0.0528669 | 37.1 | −70.7 | 542.4 |
| 23F | 0.0593206 | 0.0391856 | −33.9 | −84.6 | 182.8 |
| VT10 | 0.5084558 | 0.4445026 | −12.6 | −45.1 | 39.1 |
| 3 | 0.1089372 | 0.4102492 | 276.6 | 66.9 | 749.7 |
| 8 | 0.0262194 | 0.0477018 | 81.9 | −69.7 | 992.6 |
| 9N | 0.0092235 | 0.0547904 | 494.0 | −60.7 | 8870.8 |
| 10A | 0.0187755 | 0.0462274 | 146.2 | −68.0 | 1793.5 |
| 11A | 0.0260757 | 0.0860971 | 230.2 | −38.6 | 1674.2 |
| 12F | 0.0484381 | 0.0559813 | 15.6 | −72.1 | 378.4 |
| 15B | 0.0065337 | 0.0456452 | 598.6 | −71.5 | 17,037.3 |
| 17F | 0.0040695 | 0.0264200 | 549.2 | −88.9 | 37,866.8 |
| 19A | 0.0150498 | 0.3907762 | 2496.6 | 238.7 | 19,804.7 |
| 20 | 0.0059056 | 0.0247948 | 319.9 | −86.9 | 13,344.1 |
| 22F | 0.0186729 | 0.0527645 | 182.6 | −62.4 | 2022.0 |
| 33F | 0.0000000 | 0.0000000 | NA | NA | NA |
| AddVT23 | 0.1639137 | 0.4404226 | 168.7 | 35.6 | 432.5 |
| NVT | 0.2225622 | 10.608.898 | 376.7 | 172.3 | 734.3 |
| NT | 0.0000000 | 0.0052468 | NA | NA | NA |
| All serotypes | 10.189.188 | 27.520.871 | 170.1 | 105.3 | 255.3 |
VT10: serotypes included in PCV10 (1, 4, 5, 6B, 7F, 9V, 14, 18C, 19F, 23F), AddVT23: the 13 additional PPV23 (2, 3, 8, 9N, 10A, 11A, 12F, 5B, 17F, 19A, 20, 22F, 33F), NVT: non-vaccine type, NT: non-typable, NA: not apply.
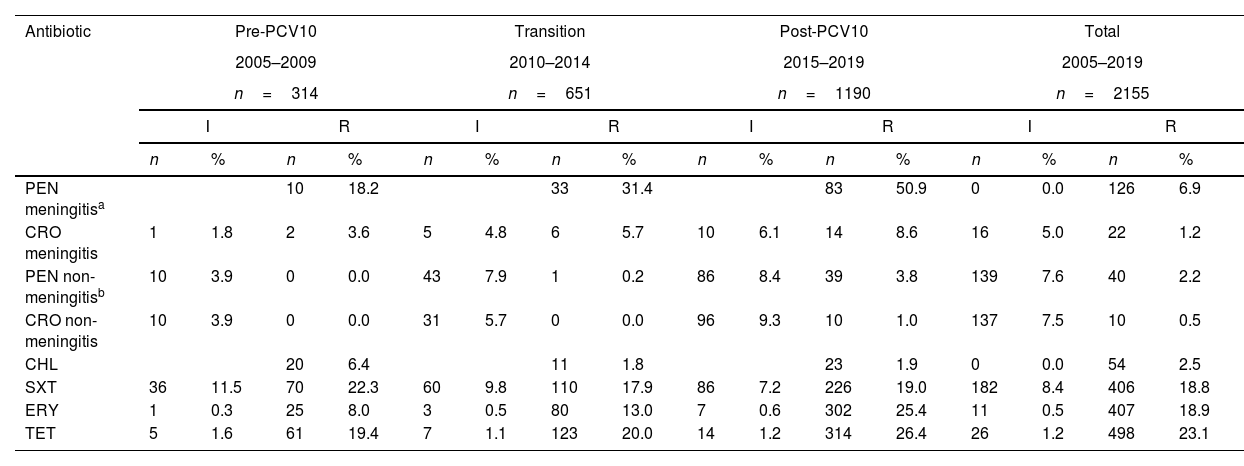
Interestingly, a total of 1216/2155 (56.4%) isolates were susceptible to all antibiotics. The proportions of VT10 susceptible isolates were 44.6% (41/92) and 47.1% (224/476) in meningitis and non-meningitis, respectively. All isolates were susceptible to vancomycin. In general, the isolates showed resistance to cotrimoxazole (SXT) (27.2%), tetracycline (TET) (24.3%), erythromycin (ERY) (19.4%) and chloramphenicol (CHL) (2.5%) (Table 3). The number of isolates that were non-susceptible to penicillin (PEN) plus ERY were 20.7% (n=323) for meningitis and 6.6% (n=1832) for non-meningitis. The main serotypes resistant for meningitis were 19A (82.1%; 23/28), 6C (66.7%; 6/15), and 23A (38.9%; 7/18) and for non-meningitis were 19A (56.1%; 106/189) and 19F (12.2%; 5/41) (Table 9S). The overall MDR rate for meningitis was 18.6% (60/323) and for non-meningitis 6.7% (122/1832). The most common serotype with MDR and resistance patterns to PEN, SXT, ERY, and TET in meningitis and non-meningitis was 19A (Table 10S).
Antimicrobial resistance of Streptococcus pneumoniae isolates by periods, diagnoses and antibiotics.
| Antibiotic | Pre-PCV10 | Transition | Post-PCV10 | Total | ||||||||||||
|---|---|---|---|---|---|---|---|---|---|---|---|---|---|---|---|---|
| 2005–2009 | 2010–2014 | 2015–2019 | 2005–2019 | |||||||||||||
| n=314 | n=651 | n=1190 | n=2155 | |||||||||||||
| I | R | I | R | I | R | I | R | |||||||||
| n | % | n | % | n | % | n | % | n | % | n | % | n | % | n | % | |
| PEN meningitisa | 10 | 18.2 | 33 | 31.4 | 83 | 50.9 | 0 | 0.0 | 126 | 6.9 | ||||||
| CRO meningitis | 1 | 1.8 | 2 | 3.6 | 5 | 4.8 | 6 | 5.7 | 10 | 6.1 | 14 | 8.6 | 16 | 5.0 | 22 | 1.2 |
| PEN non-meningitisb | 10 | 3.9 | 0 | 0.0 | 43 | 7.9 | 1 | 0.2 | 86 | 8.4 | 39 | 3.8 | 139 | 7.6 | 40 | 2.2 |
| CRO non-meningitis | 10 | 3.9 | 0 | 0.0 | 31 | 5.7 | 0 | 0.0 | 96 | 9.3 | 10 | 1.0 | 137 | 7.5 | 10 | 0.5 |
| CHL | 20 | 6.4 | 11 | 1.8 | 23 | 1.9 | 0 | 0.0 | 54 | 2.5 | ||||||
| SXT | 36 | 11.5 | 70 | 22.3 | 60 | 9.8 | 110 | 17.9 | 86 | 7.2 | 226 | 19.0 | 182 | 8.4 | 406 | 18.8 |
| ERY | 1 | 0.3 | 25 | 8.0 | 3 | 0.5 | 80 | 13.0 | 7 | 0.6 | 302 | 25.4 | 11 | 0.5 | 407 | 18.9 |
| TET | 5 | 1.6 | 61 | 19.4 | 7 | 1.1 | 123 | 20.0 | 14 | 1.2 | 314 | 26.4 | 26 | 1.2 | 498 | 23.1 |
PEN R meningitis (MIC≥0.125μg/mL), PEN R non-meningitis (MIC≥8μg/mL), PEN I non-meningitis (MIC=4μg/mL), CRO R meningitis (MIC≥2μg/mL), CRO I meningitis (MIC=1μg/mL), CRO R non-meningitis (MIC≥4μg/mL), CRO I non-meningitis (MIC=2μg/mL), CHL R (MIC≥8μg/mL), ERY R (MIC≥1μg/mL), ERY I (MIC=0.5μg/mL), SXT R (MIC≥4μg/mL), SXT I (MIC=1–2μg/mL), TET R (MIC≥4μg/mL), TET I (MIC=2μg/mL).
This study describes the indirect impact of the vaccination with PCV10 in children on Colombian adult IPD by measuring the changes in S. pneumoniae VT10 distributions and antimicrobial susceptibility of isolates recovered between the pre- and post-PCV10 periods. It is important to mention that SIREVA II6 surveillance was extended to adults and improved over the last years mainly due to the introduction of PCV10 in children. The strengthening of surveillance in adults may be interpreted as a bias, as it is an unexpected result, and the awareness and understanding of the importance of pneumococcal surveillance may have increased among the reporting institutions.
We presented evidence of a herd effect due to PCV10 introduction in children over the non-targeted age groups, particularly for older adults, which was evaluated through aetiological confirmation and identification of S. pneumoniae serotypes. The percentage change between the pre- and post-PCV10 periods in the elderly (≥50 years old) for VT10 was −68.1%, and we highlight the percentage change of serotype 14 (−75.2%) however, the improvements in the surveillance system potentially include information bias in the analysis of annual population rate comparisons. Similar studies using methods that were included in this analysis to approximate the herd effect are also available: (1) the variations in VT proportions (prevalence) and (2) comparisons of population rate before and after the introduction of PCV. These studies also reported limitations suggesting the herd effect and changes in the surveillance system. Many studies have also evaluated the impact of pneumococcal 13-valent conjugate vaccine (PCV13) implementation; for example, in Ireland, an analysis of incidence rate ratios in populations over 65 years old that was based on mandatory notification systems also showed a change in the distribution of VT serotypes but indicated no changes in population rates.13 In Germany, after PCV13 introduction, a study using similar methods to ours (proportions by serotypes and population rates) reported that the herd effect on IPD in adults had reached its limit, with VT serotypes 4, 19F, and 19A persisting after the initial reductions and serotype 3 not showing any herd protection effect at all. This study also reported changes in the surveillance system with potential reporting bias.14
In Iceland for PCV1015 and France for PCV13,3,16 there were herd effects, since the number of IPDs in adults was reduced by half. In addition, the USA and England and Wales showed that the IPD incidences among adults declined after PCV13 introduction in children.17,18 For Japan, which was the only prospective study, the proportions of vaccine-covered serotypes causing pneumococcal pneumonia in adults significantly decreased following PCV13 introduction.19 A multicentre European study that estimated the indirect effects of the childhood PCV10/13 vaccine programme in adults aged>65 years determined that IPD caused by VT7 (serotypes included in PCV7) and VT10 declined by more than 70% after five years compared with the pre-vaccine period.20
Analysis of population data (ARRs) did not demonstrate a statistically significant impact on VT10 incidence (variation in ARR −12.6%, IC95% −45.1 to 39.1%), which was likely due to the improvement in the surveillance system (a significant increase in the overall pneumococcal ARR variations: 170.1%, IC95% 105.3–255.3%). As a consequence of this information bias, an increase in ARRs was found for an additional 12 serotypes that were included in PPV23 (168.7%, IC95% 35.6–432.5%) and NVT (376.7%, IC95% 172.3–734.3%); although this was confirmed by the proportion analysis, it could be overestimated. However, when we considered the variations in the distribution of IPD-causing serotypes, a statistically significant decreasing trend was present for VT10, and an increasing trend was detected for AddVT23 and NVT.
In this study, the most important reduction was observed for serotype 14. In Colombia, between 1994 and 2004, it was the predominant serotype causing IPD, with 29.7% of cases occurring among children<6 years old and 13.6% in adults>50 years old and was associated with a wide distribution of penicillin-resistant Spain9V-ST156 clone.21 In Bogotá, after PCV7 introduction, a reduction in this serotype from 48% (2005–2009) to 16.7% (2010–2011) was observed in children ≤2 years.5
A Latin American study that was conducted in four countries that used PCV10, including Colombia, estimated the direct impact of PCV in children, and showed an increase in serotypes 3, 19A, and NTV and a decrease in VT101; however, ours, is the first study evaluating the indirect impact of PCV10 vaccination in children on the serotype distribution of S. pneumoniae causing IPD in Colombian adults. Severiche-Bueno D.F. et al. analyzed the results of S. pneumoniae-serotypes surveillance from the SIREVA II project in Bogotá (2007–2017; all serotype data from Bogotá were included in our study) and the IPD (clinical data) in all age groups. The study determined that no herd effect was observed in adults due to an increased incidence of IPD in people over 50 years of age, however they did not study the changes in serotype prevalence in that age group. Conversely, in the general population a significant decrease in VT10 was observed especially for serotypes 1, 14 and 6B.22
In 2010, PCV10 was introduced in Brazil, and a study that was conducted between 2013 and 2015 showed a predominance of NVT serotypes among IPD in the elderly population.23 In Mexico, in adult patients with community-acquired pneumonia or IPD from three tertiary care hospitals over a 15-year period (2000–2015), after the introduction of PCV7, the prevalence of the included serotypes declined significantly; no such changes were found after introduction of the PCV13 vaccine, including the prevalence of serotype 19A.24 In Uruguay, the incidence rates of PCV7 showed a non-significant increase in the total number of isolates among adults>60 years of age after PCV7 introduction due to changes in diagnostic criteria or compliance with surveillance, which showed an increase in the number of isolates between the pre- and post-vaccine periods for older patients (from 94 to 290),25 similar to the results found in our study.
In addition, our results revealed a significant increase in the prevalence and variation of the ARRs of serotypes 3 and 19A in the post-PCV10 period; this is concordant with the findings of other studies that have documented serotype 3 prevalence in older adults, even in countries that have introduced PCV13.15,26
In Colombia, the increase in serotype 19A was not only a result of universal immunization but was also due to other factors that may have contributed to the reported increases in 19A, including antibiotic pressure or the spread of multi-resistant 19A clones (ST320, ST276, and ST1118), among others.27 A remarkable finding concerns the relatively high MDR rates of serotype 19A, and similar findings were reported in Latin America, Mexico and Argentina, where PCV13 was implemented in 2011 and 2012.24,28
The Pneumococcal Serotype Replacement and Distribution Estimation (PSERENADE) project found that the main serotypes that caused meningitis in children>5 years in the countries using PCV13, after 5–7 years postvaccination were 3, 8, 12F, 23B and 23A, and in Brazil were 3, 19A, 6C, 23A and 23B following the introduction of PCV10.29
The diversity of emerging non-vaccine serotypes may be due to differences in the genetic background within the same serotype that could induce variations in disease potential or the existence of different serotypes of a single clonal lineage, which could explain why the frequencies of some NVTs is increasing in some countries but not in others.30 Continued surveillance of serotype distributions and genetic lineages will provide knowledge for predicting future serotype trends and the development of new vaccines.
This study evaluated the indirect effect of immunization with PCV10 based on laboratory records, but our principal limitations are associated with the unknown pneumococcal vaccination status and mortality in adults; these data should be included in future studies. The lack of comparison of IPD incidence rates over the same years of the study and a sub-registration of information (i.e., using ARR as proxy of incidence rates) was due to the fact that laboratory surveillance is only mandatory for meningitis and passive (voluntary) for other IPD, however, an improvement in the surveillance system is associated with the immunization of children, as noted by the increased ARRs over the period of analysis. Despite the limitations, retrospective analysis of serotype distributions in IPD cases plays an important role in informing future vaccination strategies.
In our study, the indirect effect of PCV10 in adults was evidenced, and the increased prevalence of NVT and variations in ARRs in the post-PCV10 period were significant, which may indicate replacement of serotypes. A decrease in IPD caused by PCV10 serotypes was observed in adults>50 years, but an increase in NVT did not allow us to observe an overall decrease in IPD cases in this population.
To determine if changes in the distribution of IPD-causing serotypes and antimicrobial resistance in both children and adults is due to vaccination, it is necessary to maintain and improve S.pneumoniae surveillance, including other antibiotics as quinolones. Data collected by the SIREVA II surveillance can guide the introduction of new PCVs in the Latin America and Caribbean region, however the addition of new serotypes to conjugated vaccines should be carefully considered. With the information available to date, it is difficult to predict a group of common serotypes for the region, as there is clear country diversity.
Ethical issuesThe data was obtained from laboratory-based surveillance performed by Instituto Nacional de Salud – Colombia, for this reason, ethical approval was not required. Collection of the isolates and information was considered as surveillance activity and was obtained with the approval of each participating hospital. The data and isolates could not be traced back to the source.
Conflict of interestsAll authors declare no competing interests.
The national laboratory networks, and the clinicians and epidemiologists of the participating hospitals (Table 11S).
The following are the supplementary data to this article: