


Despite recent findings reported on the nutritional factors that induce epigenetic changes, little information is available at early ages. This study analyzed in an experimental model, over two generations, potential changes in body composition and potential expression of epigenetic changes as the result of the intake of isoenergetic diets with different fat levels.
Materials and methodsAt weaning, Wistar female rats were divided into two groups that were fed either a control diet (fat=7%, w/w) or a high-fat diet (15%, w/w). Rats were mated at 70 days (M1) and their pups (P1) were the first generation; P1 rats were mated at 70 days (M2) and their pups (P2) represented the second generation. At weaning, mothers and pups (M1, M2 and P1, P2) were measured body weight (W) and composition (% body fat, %BF), and total skeleton bone mineral content (BMC), expressed as %BMC, using chemical and DXA methods, respectively.
ResultsAt weaning, high-fat diet groups M2 and P2 showed significant increases in W and %BF (p<0.05); increased %BF values were already found in the M1 and P1 groups (p<0.001). By contrast, %BMC significantly decreased in M2 and P2 rats (p<0.001).
ConclusionThis study demonstrates the need to review certain eating habits to avoid perpetuation of unhealthy patterns generation after generation.
A pesar de los últimos avances acerca de los factores nutricionales que inducen modificaciones epigenéticas, la información en edades tempranas es escasa. El presente trabajo estudió en un modelo experimental a lo largo de dos generaciones las posibles modificaciones en la composición corporal, la posible expresión de cambios epigenéticos, y el resultado del consumo de dietas isocalóricas con niveles de grasa diferentes.
Materiales y métodosRatas Wistar hembras al destete se dividieron en dos grupos que recibieron una dieta con 7 y 15% de grasa (rica en grasa). A los 70 días se aparearon (M1) y sus crías (C1) constituyeron la primera generación; C1 a los 70 días fueron apareadas (M2) y sus crías (C2) constituyeron la segunda generación. Al destete, se evaluaron tanto las madres como las crías (M1, M2 y C1, C2), el peso (P) y composición corporales % de grasa (% Gra), por método químico y contenido mineral óseo de esqueleto total (CMO) por densitometría, expresado como %CMO.
ResultadosAl destete, en los grupos con dieta rica en grasa M2 y C2 (15% Gra) se observó un incremento significativo del P y % Gra (p<0,05), mientras que el aumento en el % Gra ya se observó en C1 y M1 (p<0,001). Por el contrario, el % CMO de M2 y C2 disminuyó significativamente (p<0,001).
ConclusiónEste estudio pone de manifiesto la potencial necesidad de modificar ciertos hábitos alimentarios que eviten repetir patrones distorsionados de generación en generación.
There is evidence to suggest that food choices by the mother during pregnancy may lay the foundations for food acceptance in postnatal life. The amniotic fluid surrounding the fetus, which maintains fetal temperature, is a rich source of sensory exposure to the fetus. Many flavors present in maternal diet are also present in amniotic fluid,1,2 and since taste and smell are already functional during fetal life, they represent the first experiences of contact before birth. Exposure to these “transmissible” flavors influences their postnatal acceptance.3,4 This early experience, by providing a “flavor bridge” and making the fetus familiar with flavors in maternal diet, plays a key role in food acquisition and preferences.4,5
After birth, parents participate in the early experiences of children with food. Breast milk, with its flavors, facilitates the transition to adult diet. As omnivorous young humans, they are willing to learn and eat an adult diet and, despite the wide range of food products available to them, they develop the capacity to repeat the dietary pattern of the family at an early age. These food preferences acquired by children reflect the available and accessible food products, and pave the way for the dietary cultural pattern of their own future offspring.
There is evidence that intrauterine metabolic disturbances may influence gene expression and modulate the phenotype during adult life. Exposure in early life to inadequate nutritional factors may be critical for body tissue growth and development, and is a potential risk factor for diseases due to inadequate dietary patterns by default6,7 or by excess.8 Despite recent advances in the understanding of nutritional factors inducing epigenetic changes, little information is available for early age.9
This study examined in an experimental model, over two generations, potential changes in body composition resulting from the use of isocaloric diets with different fat levels.
Materials and methodsAnimal populationNinety Wistar female rats with a mean initial weight of 44.7±0.7g (mean±standard error, SE), from the department of general and oral biochemistry of the stomatology school of Universidad de Buenos Aires, were studied from weaning (22±1 days of age). The protocol submitted met the internationally agreed specifications for the use and care of laboratory animals.10
The animals were placed in galvanized cages with mesh floors and suspended in order to maintain hygienic conditions and avoid coprophagia. A room temperature of 21±1°C was maintained using a thermostatized system, and relative humidity was 50–60%. A system for strictly maintaining light-dark periods of 12h/12h was also used, because changes in these periods may cause changes in animal behavior and feeding rhythm.11
At weaning, the animals were divided into three groups with no differences in baseline mean weights (p>0.05). A group of 10 animals (C0) were killed to measure baseline values. Two groups of 40 animals each were fed ad libitum one of two diets throughout the experimental period: a control diet containing 7g of fat/100g (7%) and an experimental diet containing 15g/100g (15%).
At 28, 35, and 49 days of age, 10 animals from each group were killed to measure body composition. At 70 days of age, 10 rats from both groups were mated, and the pups were weaned at 110 days. The mothers of this first generation (M1/7% and M1/15%) and a subgroup of pups (C1/7% and C1/15%) were killed. The remaining subgroup continued with the diet of the previous generation. They were mated at 70 days, and the pups were weaned at 110 days of age. The mothers (M2/7% and M2/15%) and pups (C2/7% and C2/15%) were then killed (Fig. 1).

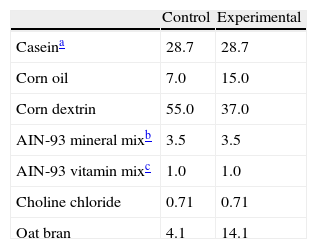
During the experimental period, the animals were fed ad libitum one of the following isocaloric diets (4kcal/g), the composition of which is detailed in Table 1. Drinking water was provided ad libitum, a continuous supply being ensured because of the close correlation between fluid intake and feeding behavior.12
Percent composition of diets.
| Control | Experimental | |
| Caseina | 28.7 | 28.7 |
| Corn oil | 7.0 | 15.0 |
| Corn dextrin | 55.0 | 37.0 |
| AIN-93 mineral mixb | 3.5 | 3.5 |
| AIN-93 vitamin mixc | 1.0 | 1.0 |
| Choline chloride | 0.71 | 0.71 |
| Oat bran | 4.1 | 14.1 |
Body weight: this was measured using a Mettler PC 4000 analytical scale with a precision of ±1mg. Measurements were made after fasting for at least 2h and up to 4h. Weight was recorded in grams.
Body composition: analysis of body composition included body fat content (% fat) and total skeleton bone mineral content (expressed as %BMC (g/100g body weight)). Body fat content was measured on the dry carcass using a chemical method consisting of intermittent extraction with petroleum ether (Soxhlet, AOAC).13 Results were expressed in g of fat/100g body weight. Total skeleton bone mineral content was assessed by ex vivo densitometry using Lunar DPX equipment (DPX Alpha 8034, Small Animal Software, Lunar Radiation Corp. Madison, USA). Equipment precision was assessed by five measurements in the same rat, with animal replacement during the same and on a different day. The coefficient of variation (CV) for bone mineral content (BMC) was 3%.
Results were expressed as mean±SE, and were analyzed statistically using ANOVA to compare the groups. When a statistically significant difference was found, a Student–Newman–Keuls was performed. Tests for normality (Wilk–Shapiro) and homoscedasticity (Bartlett) of variances were performed in all cases. Results were considered significant at the 5% level. The software used included GraphPad Prism version 3.0 (GraphPad Software Inc., San Diego, CA, USA) and SPSS version 9.0 (SPSS Inc., Chicago, USA).
ResultsAn analysis of body weight changes in the groups M1/15% (Fig. 2a) and M2/15% (Fig. 2b) over the experimental period showed no significant differences between them and their respective controls at 28, 35, 49, 70, and 90 days of age. At 110 days of age, a significant body weight increase was only seen in the M2/15% vs the M2/7% group (p<0.05).
 with age over two generations (1a: first generation; 1b: second generation) in animals fed diets containing 7% (control group) or 15% (experimental group) of fat. C0: baseline group; M1: first generation mothers; M2: second generation mothers. *p<0.05 between control and experimental groups.")
Change in body weight (mean±body weight) with age over two generations (1a: first generation; 1b: second generation) in animals fed diets containing 7% (control group) or 15% (experimental group) of fat. C0: baseline group; M1: first generation mothers; M2: second generation mothers. *p<0.05 between control and experimental groups.
Fig. 3 shows the body weight of pups from the first (C1/7%, C1/15%) and second (C2/7%, C2/15%) generations at weaning. A significant body weight increase was seen in the second pup generation (C2/15%) born to mothers (M2/15%) who received a diet containing 15% of fat. No significant body weight changes were seen in pups fed the control diet over the generations.
 or 15% (experimental group) of fat. C0: baseline group; C1: first generation pups; C2: second generation pups. Mean±standard error. ANOVA, overall significance level <0.001; a posteriori, a Student–Newman–Keuls test found the following differences between the groups (different letters indicate significant differences between the groups): C0 vs C1/7% vs C1/15%; p<0.05; C0 vs C2/7%; p<0.01; C0 vs C2/15%; p<0.001; C1/7% vs C2/7%; p>0.05; C0 vs C2/15%; p<0.001; C1/15% vs C2/7%; p<0.05; C1/15% vs C2/15%; p<0.001; C2/7% vs C2/15%; p<0.001.")
Body weight of pups from two generations of rats fed diets containing 7% (control group) or 15% (experimental group) of fat. C0: baseline group; C1: first generation pups; C2: second generation pups. Mean±standard error. ANOVA, overall significance level <0.001; a posteriori, a Student–Newman–Keuls test found the following differences between the groups (different letters indicate significant differences between the groups): C0 vs C1/7% vs C1/15%; p<0.05; C0 vs C2/7%; p<0.01; C0 vs C2/15%; p<0.001; C1/7% vs C2/7%; p>0.05; C0 vs C2/15%; p<0.001; C1/15% vs C2/7%; p<0.05; C1/15% vs C2/15%; p<0.001; C2/7% vs C2/15%; p<0.001.
Body fat content was significantly greater in M1/15% and M2/15% as compared to their respective controls at 110 days of age (p<0.001) (Fig. 4).
 as a function of age in animals fed diets containing 7% (control group) and 15% (experimental group) of fat. C0: baseline group; M1: first generation mothers; M2: second generation mothers. t test between groups for each experimental time. Differences between the indicated groups: *p<0.05; ***p<0.001.")
Body fat (mean±standard error) as a function of age in animals fed diets containing 7% (control group) and 15% (experimental group) of fat. C0: baseline group; M1: first generation mothers; M2: second generation mothers. t test between groups for each experimental time. Differences between the indicated groups: *p<0.05; ***p<0.001.
An analysis of body fat in pups from the first and second generations at weaning showed significantly higher values in C1/15% and C2/15% born to mothers (M1/15% and M2/15%) that received a diet containing 15% of fat. No significant body weight changes were seen in pups fed the control diet over the generations (p>0.05) as compared to C0 (7.66±1.42%) (Fig. 5).
 or 15% (experimental group) of fat. C0: baseline group; C1: first generation pups; C2: second generation pups. Mean±standard error. ANOVA, overall significance level <0.001; a posteriori, a Student–Newman–Keuls test found the following differences between the groups (different letters indicate significant differences between the groups): C0 vs C1/7% vs C2/7%; p>0.05; C0, C1/7%, C2/7% vs C1/15%; p<0.001; C0, C1/7%, C2/7% vs C2/15%; p<0.001; C1/15% vs C2/15%; p<0.001.")
Body weight of pups from two generations of rats fed diets containing 7% (control group) or 15% (experimental group) of fat. C0: baseline group; C1: first generation pups; C2: second generation pups. Mean±standard error. ANOVA, overall significance level <0.001; a posteriori, a Student–Newman–Keuls test found the following differences between the groups (different letters indicate significant differences between the groups): C0 vs C1/7% vs C2/7%; p>0.05; C0, C1/7%, C2/7% vs C1/15%; p<0.001; C0, C1/7%, C2/7% vs C2/15%; p<0.001; C1/15% vs C2/15%; p<0.001.
Figs. 6 and 7 show changes over time in total skeleton bone mineral content. While no significant changes were seen in M1/15% vs M1/7% and between their respective pups (C1/15% vs C1/7%), BMC significantly decreased in M2/15% vs M2/7% and C2/15% vs C2/7% (p<0.001).
 in total skeleton (mean±standard error) as a function of age in animals fed diets containing 7% (control group) and 15% (experimental group) of fat. C0: baseline group; M1: first generation mothers; M2: second generation mothers. t test between groups for each experimental time: *p<0.05; ***p<0.001.")
Bone mineral content (%) in total skeleton (mean±standard error) as a function of age in animals fed diets containing 7% (control group) and 15% (experimental group) of fat. C0: baseline group; M1: first generation mothers; M2: second generation mothers. t test between groups for each experimental time: *p<0.05; ***p<0.001.
 or 15% (experimental group) of fat. C0: baseline group; C1: first generation pups; C2: second generation pups. Mean±standard error. ANOVA, overall significance level <0.001; a posteriori, a Student–Newman–Keuls test found the following differences between the groups (different letters indicate significant differences between the groups): C0 vs C1/7% vs C1/15%; p>0.05; C0, C1/7%, C1/15% vs C2/7%; p<0.001; C0, C1/7%, C1/15% vs C2/15%; p<0.001; C2/7% vs C2/15%; p<0.01.")
Bone mineral content in total skeleton of pups from two generations of rats fed diets containing 7% (control group) or 15% (experimental group) of fat. C0: baseline group; C1: first generation pups; C2: second generation pups. Mean±standard error. ANOVA, overall significance level <0.001; a posteriori, a Student–Newman–Keuls test found the following differences between the groups (different letters indicate significant differences between the groups): C0 vs C1/7% vs C1/15%; p>0.05; C0, C1/7%, C1/15% vs C2/7%; p<0.001; C0, C1/7%, C1/15% vs C2/15%; p<0.001; C2/7% vs C2/15%; p<0.01.
In prior studies, our work group analyzed the effect of isocaloric diets with different fat and carbohydrate levels on the body composition of growing rats over one generation.14 However, the effect of such diets, rich in n-6 polyunsaturated fatty acids (n-6 PUFAs), and potential changes in body composition over two generations have not been assessed yet. There is evidence to show that maternal exposure to high cholesterol and fat diets causes epigenetic changes that modulate gene expression leading to the development of obesity in the offspring.15
When the body weights of each of the generations were compared, higher values were always found in groups fed diets with higher lipid contents, both in mothers and pups.16 Weight increase was associated with an increased body fat percentage. This may specifically be due to an imbalance in the n-6/n-3 ratio favoring n-6 PUFAs and their metabolites. These include arachidonic acid, which acts as a potent adipogenic agent precursor of prostacyclins, increasing the risk of excessive adipose tissue development.17 Other authors found increases in inguinal white adipose tissue and adipocyte size already in the first generation,18 in agreement with our results, which show an impact in the first generation, which is increased in the second generation.
An imbalance in the n-6/n-3 ratio and a decreased presence of PUFAs in corn oil may account for the increased body weight and fat in animals on an experimental diet. These results agree with those reported by other authors who found that an increased maternal intake of n-3 PUFA leads to an adipose tissue mass reduction in rats18 and mice.19 It is known that the presence of n-6 PUFAs in adequate amounts has benefits on bone activity20 and growth cartilage formation.21
In this study, the use of a diet rich in n-6 PUFAs was shown to decrease %BMC, which was inversely related to body fat in both mothers and second generation pups. This reduction in %BMC may have been due to an increased production of arachidonic acid, leading to increased prostaglandin E2 levels in bone and decreased serum levels of insulin-like growth factor-1,22,23 with a resultant reduction in the bone formation rate.24 By contrast, a diet rich in n-3 PUFAs promotes bone formation by maintaining adequate arachidonic acid levels in bone.23
Increased lipid dietary content, associated with increased body fat, was not reflected in the %BMC content in first generation mothers and pups; in the mothers, this may have been due to bone mass preservation at the expense of a decreased bone turnover rate.25
Studies in experimental animals have shown that exposure to fat-rich diets during pregnancy and lactation predisposes pups to develop a phenotype similar to metabolic syndrome and to endothelial and cardiovascular dysfunction, among other conditions.15 Body composition changes may induce the development of conditions24–27 such as stroke,28–30 cancer,31–33 inflammatory and autoimmune diseases,34,35 and bone diseases.36 Small changes in dietary habits such as the simple addition of α-linolenic acid would allow for fat mass reduction by the suppression of lipogenesis.37,38
Bearing in mind the significance of cultural patterns in the quality of life of individuals and of the fact that corn oil is a significant component of the Argentinian diet,39 this study shows the potential need for changing some dietary habits to avoid repeating distorted patterns generation after generation.
Conflicts of interestThe authors state that they have no conflicts of interest.
Authors thank Mr. Ricardo Orzuza, a technician from Bioterio, for animal care and for his technical support. This study was funded by UBACyT20020100100613 and C O02.
Please cite this article as: Suarez C, et al. Dietas ricas en grasa y composición corporal a lo largo de dos generaciones. Estudio experimental. Endocrinol Nutr. 2012;59:232–8.
