


Bioelectrical Impedance Analysis (BIA) is a tool used in clinical nutrition and pure electrical data such as phase angle (PA) has shown prognostic value. It relates resistance and reactance indicating cellular health.
ObjectiveTo determine differences in PA between patients with obesity and disease-related malnutrition (DRM) compared to the healthy population, and to establish associations between PA and other body composition (BC) parameters.
Materials and methodsRetrospective observational study with 1079 patients from the Obesity and Nutrition Department of the Complejo Asistencial Universitario de León between April/2014 and August/2022 as well as 86 healthy controls. Demographic and anthropometric variables were collected and BC was performed with BIA Tanita MC780®. Diagnosis of malnutrition according to GLIM criteria and obesity with body mass index (BMI).
ResultsPA50KHz in obesity group is 5.98º, DRM 4.79º and control group 6.08º. Statistically significant differences in PA between DRM and control groups, as well as DRM and obesity (p < 0.001). Weak positive correlation in total population (r = 0.452, p < 0.001) as well as control group (r = 0.463, p < 0.001) between BMI and PA. Weak negative correlation in the total population (r = −0.408, p < 0.001), DRM (r = −0.268, p < 0.001) and obesity (r = −0.342, p < 0.001) between age and PA.
ConclusionsIn this study, significantly lower PA was observed in the DRM group than in the control and obesity groups. No statistically significant differences between PA in the obesity and control groups and no correlation between BMI and PA in the obesity group. More studies are needed to standardize cut-off points in different contexts and populations.
La bioimpedanciometría es una herramienta utilizada en nutrición clínica y datos eléctricos puros como el ángulo de fase (AF) han demostrado valor pronóstico. Relaciona resistencia y reactancia que indican salud celular.
ObjetivoDeterminar diferencias del AF entre pacientes con obesidad y con desnutrición relacionada con la enfermedad (DRE) respecto a población sana, y establecer asociaciones entre el AF con otros parámetros de composición corporal (CC).
Materiales y métodosEstudio observacional retrospectivo con 1079 pacientes de consultas de Obesidad y Nutrición del Complejo Asistencial Universitario de León entre Abril/2014 y Agosto/2022 así como 86 controles sanos. Se recogen variables demográficas, antropométricas y se realiza CC con bioimpedanciómetro Tanita MC780®. Diagnóstico de desnutrición según criterios GLIM y obesidad con índice de masa corporal (IMC).
ResultadosAF50KHz en grupo obesidad es 5,98º, DRE 4,79º y grupo control 6,08º. Diferencias estadísticamente significativas del AF entre grupos DRE y control, así como DRE y obesidad (p < 0,001). Correlación positiva débil en población total (r = 0,452, p < 0,001) así como grupo control (r = 0,463, p < 0,001) entre IMC y AF. Correlación negativa débil en la población total (r=-0,408, p < 0,001), DRE (r=-0,268, p < 0,001) y obesidad (r=-0,342, p < 0,001) entre edad y AF.
ConclusionesEn este estudio se observa AF significativamente menor en grupo DRE que grupo control y obesidad. No diferencias estadísticamente significativas entre el AF en grupo obesidad y control ni correlación entre IMC y AF en grupo obesidad. Se necesitan más estudios para estandarizar puntos de corte en diferentes contextos y poblaciones.
In clinical nutrition, bioelectrical impedance analysis (BIA) has traditionally been used to evaluate body composition (BC). This test uses formulas based on regression equations for specific population groups, making it difficult to extrapolate its use to other types of patients. These measurements are compared with other imaging modalities such as computed tomography (CT) and dual-energy X-ray absorptiometry (DXA) to create regression equations. It is, however, subject to multiple biases depending on the formulas, devices, and measurement conditions used¹.
For this reason, pure electrical data has shown broad prognostic value with fewer interpretive interferences.1 In recent years, the bioelectrical impedance vector analysis (BIVA) technique has emerged, whose bioelectrical data do not depend on regression formulas. Electrical impedance (Z) is determined by the vector relationship between resistance (R), which represents hydration status, and reactance (Xc), which relates to cellular membrane integrity. The angle formed by these two vectors is the phase angle (PA), whose value reflects cellular health.2
PA has been used in multiple health and disease contexts. Recent research has explored its potential in assessing nutritional status and prognosis in various conditions such as cancer, critical illness,3 and chronic liver/kidney disease or, more recently, COVID-19.4 In all these situations, low PA values indicate higher morbidity and mortality.2
Many studies have used PA cut-off points to identify malnutrition, but these cut-offs in the literature may have been determined using reference standards unrelated to nutrition, thus their reliability for identifying malnutrition per se is unknown.5 Additionally, exploring other scenarios, few studies have evaluated PA in patients with obesity (PwO), and the limited published results are sometimes contradictory.6 More research is needed in various population groups for PA to become a useful parameter in diagnosing and predicting different diseases.
Based on the above, this study aims to identify differences in PA values and other raw BC parameters obtained in a standing position among PwO and those with disease-related malnutrition (DRM) vs a healthy population. Additionally, it seeks to establish relationships between PA values and other BC parameters.
Materials and methodsThis retrospective observational study includes adult patients aged 18 years and older at their initial evaluation in the High-Risk Obesity and Nutrition Clinics at Complejo Asistencial Universitario (León, Spain) from April 2014 through August 2022. Patients were categorized into 3 groups: those with a DRM diagnosis, obesity, and a third group of healthy volunteers (health care personnel invited to participate). Demographic and anthropometric variables (weight and height) were collected, and BC was measured in a standing position using a tetrapolar multifrequency bioimpedance analyzer Tanita MC780® (TANITA, Tokyo, Japan) to obtain resistance, reactance, and PA parameters. This technique was conducted in the morning, without a specific fasting or rest period. Room temperature was not considered during measurement. The DRM diagnosis was made using GLIM criteria (Global Leadership Initiative on Malnutrition),7 and obesity was diagnosed using body mass index (BMI). The study includes patients with a DRM diagnosis according to GLIM criteria, including those with moderate or severe malnutrition, or BMI ≥ 35 kg/m², or healthy volunteers. As this study is retrospective and collects variables from the routine clinical practice, specific informed consent will not be requested.
Data processing was conducted in full compliance with current legislation and the center ethics committee. In data collection from the patients’ health histories, dissociation and anonymization were applied, encoding them so that correlation between study results and patient data becomes impossible. This study was approved by the León Clinical Research Ethics Committee (CEIm) on September 27th, 2022, with study No. 22111.
Statistical analysis was performed using IBM SPSS Statistics 21® (IBM Corporate Headquarters, Armonk, NY, USA), available at the hospital Research Unit. Numerical variables are expressed as means and standard deviation (SD) or median and interquartile range (IQR). Categorical variables are expressed as absolute or relative frequencies. Inter-group statistical significance was assessed using an analysis of variance (ANOVA) to determine if there were differences among the 3 groups (DRM, obesity, and control) in the resistance, reactance, and PA variables. A homogeneity of variances test was subsequently performed to select the best test for a post hoc analysis to determine whether statistically significant differences existed in resistance, reactance, and PA among the 3 groups.
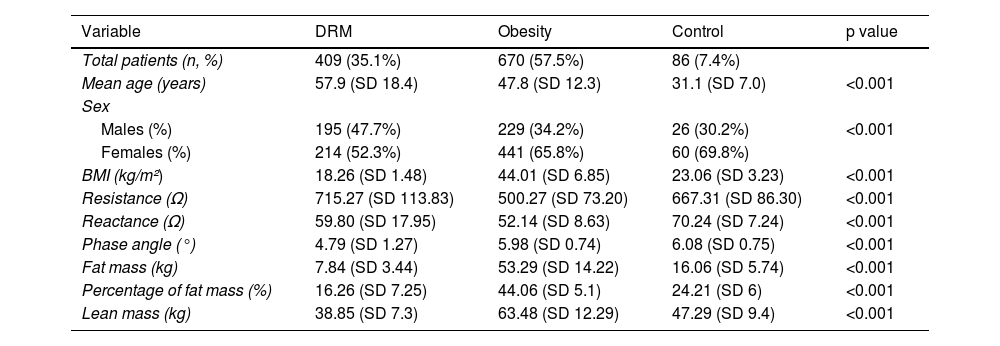
ResultsA total of 1165 individuals were included, 61.4% of whom were women: 409 in the DRM group, 670 in the obesity group, and 86 in the control group. The mean age of the study population was 50.1 years (95% confidence interval [CI], 49.2–51.1 years).
Each group results are shown in Table 1.
Results of means by subgroups.
| Variable | DRM | Obesity | Control | p value |
|---|---|---|---|---|
| Total patients (n, %) | 409 (35.1%) | 670 (57.5%) | 86 (7.4%) | |
| Mean age (years) | 57.9 (SD 18.4) | 47.8 (SD 12.3) | 31.1 (SD 7.0) | <0.001 |
| Sex | ||||
| Males (%) | 195 (47.7%) | 229 (34.2%) | 26 (30.2%) | <0.001 |
| Females (%) | 214 (52.3%) | 441 (65.8%) | 60 (69.8%) | |
| BMI (kg/m²) | 18.26 (SD 1.48) | 44.01 (SD 6.85) | 23.06 (SD 3.23) | <0.001 |
| Resistance (Ω) | 715.27 (SD 113.83) | 500.27 (SD 73.20) | 667.31 (SD 86.30) | <0.001 |
| Reactance (Ω) | 59.80 (SD 17.95) | 52.14 (SD 8.63) | 70.24 (SD 7.24) | <0.001 |
| Phase angle (°) | 4.79 (SD 1.27) | 5.98 (SD 0.74) | 6.08 (SD 0.75) | <0.001 |
| Fat mass (kg) | 7.84 (SD 3.44) | 53.29 (SD 14.22) | 16.06 (SD 5.74) | <0.001 |
| Percentage of fat mass (%) | 16.26 (SD 7.25) | 44.06 (SD 5.1) | 24.21 (SD 6) | <0.001 |
| Lean mass (kg) | 38.85 (SD 7.3) | 63.48 (SD 12.29) | 47.29 (SD 9.4) | <0.001 |
SD: standard deviation; DRE: disease-related malnutrition; BMI: body mass index.
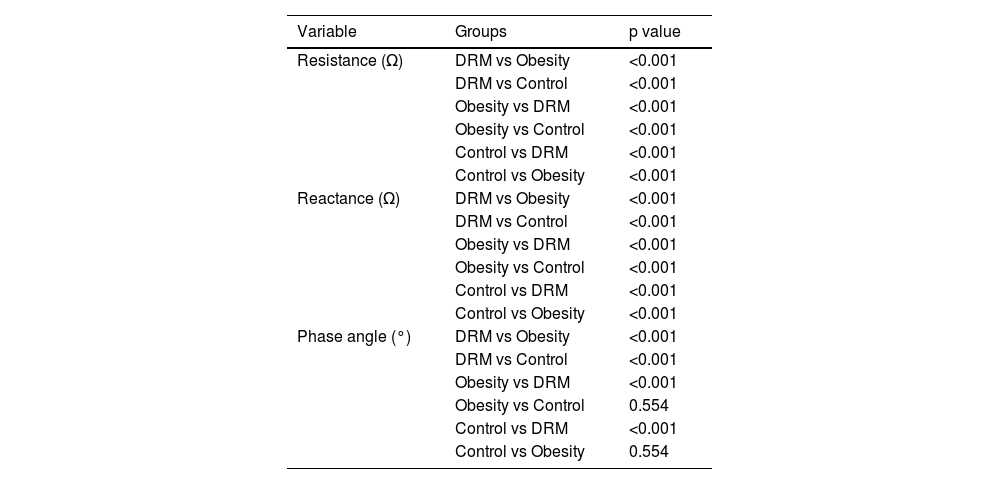
ANOVA results are presented in Table 1, and after performing a homogeneity of variances test, it was found that variances were not equal among the three groups for resistance (p < 0.001), reactance (p < 0.001), and PA (p < 0.001). Consequently, a post hoc analysis with Tamhane's T2 test was performed, yielding statistically significant differences in resistance and reactance among the 3 groups, and in PA between the DRM and control groups (p < 0.001). However, no statistically significant differences in PA were found between obesity and control groups (p = 0.554) (Table 2).
Intergroup Comparisons Using Tamhane's T2 Test.
| Variable | Groups | p value |
|---|---|---|
| Resistance (Ω) | DRM vs Obesity | <0.001 |
| DRM vs Control | <0.001 | |
| Obesity vs DRM | <0.001 | |
| Obesity vs Control | <0.001 | |
| Control vs DRM | <0.001 | |
| Control vs Obesity | <0.001 | |
| Reactance (Ω) | DRM vs Obesity | <0.001 |
| DRM vs Control | <0.001 | |
| Obesity vs DRM | <0.001 | |
| Obesity vs Control | <0.001 | |
| Control vs DRM | <0.001 | |
| Control vs Obesity | <0.001 | |
| Phase angle (°) | DRM vs Obesity | <0.001 |
| DRM vs Control | <0.001 | |
| Obesity vs DRM | <0.001 | |
| Obesity vs Control | 0.554 | |
| Control vs DRM | <0.001 | |
| Control vs Obesity | 0.554 |
DRM: disease-related malnutrition.
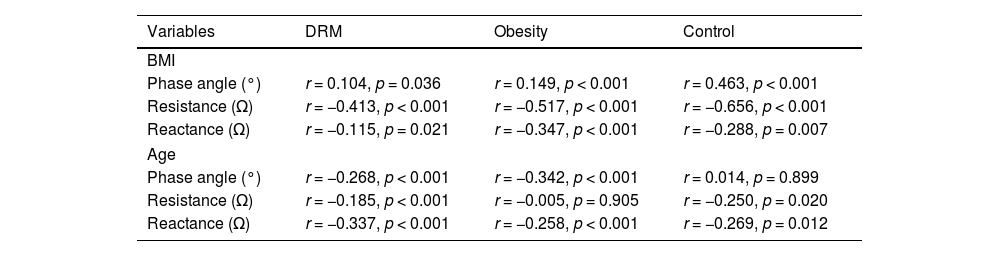
To assess the association between BMI and PA, Pearson’s correlation coefficient was used, revealing a weak positive correlation between these variables in the total population and in the control group, but not in the obesity or malnutrition groups (Table 3). The association between BMI and resistance and reactance was also analyzed. Regarding resistance, a moderate negative correlation was found in the control and obesity groups, while a weak negative correlation was found in the DRM group. Regarding reactance, a weak negative correlation was observed in the PwO group, but not in the DRM and control groups (Table 3).
Correlation of Variables by Group Using Pearson’s Correlation Coefficient.
| Variables | DRM | Obesity | Control |
|---|---|---|---|
| BMI | |||
| Phase angle (°) | r = 0.104, p = 0.036 | r = 0.149, p < 0.001 | r = 0.463, p < 0.001 |
| Resistance (Ω) | r = −0.413, p < 0.001 | r = −0.517, p < 0.001 | r = −0.656, p < 0.001 |
| Reactance (Ω) | r = −0.115, p = 0.021 | r = −0.347, p < 0.001 | r = −0.288, p = 0.007 |
| Age | |||
| Phase angle (°) | r = −0.268, p < 0.001 | r = −0.342, p < 0.001 | r = 0.014, p = 0.899 |
| Resistance (Ω) | r = −0.185, p < 0.001 | r = −0.005, p = 0.905 | r = −0.250, p = 0.020 |
| Reactance (Ω) | r = −0.337, p < 0.001 | r = −0.258, p < 0.001 | r = −0.269, p = 0.012 |
PA: phase angle at 50 kHz; DRM: disease-related malnutrition; BMI: body mass index; r: Pearson’s correlation coefficient; R: resistance at 50 kHz; Xc: reactance at 50 kHz.
In addition, the association between age and PA was analyzed, revealing a weak negative correlation in the DRM and obesity groups but not in the control group. Associations between age and resistance and reactance were also analyzed, but no correlations were found, even in subgroup analyses (Table 3).
DiscussionThis study aimed to determine PA value differences between PwO and DRM vs a healthy population. A literature review of previous DRM studies found consistently lower PA values than in healthy populations, although no clear conclusions were drawn for studies involving PwO.
A low PA has been associated with lower lean mass, worse nutritional status, and prognosis, especially in DRM-associated diseases.
In literature, studies across various disease contexts have been conducted. Da Silva et al. reported a PA of 4.91° (95%CI, 3.55–6.27) in critically ill patients and concluded that it could be a prognostic marker in non-septic patients.3 Cornejo-Pareja et al. concluded in their study that a PA < 3.95° was associated with higher mortality in patients with acute COVID.4 In oncology, Pereira et al. concluded in a meta-analysis that a PA < 5.6° was significantly associated with shorter survival time.8 Fernández-Jimenez et al. found in their study in ICU patients for various reasons that PA was lower in those with DRM vs those without it (4.5 [SD, 1.1] vs 6.1 [1.2]), also associating it with longer hospital stays and mortality.9
PA has been recognized as a sensitive indicator of nutritional status in DRM and has been used in clinical practice to assess malnutrition. Osuna-Padilla et al. found in a study of HIV patients that PA was significantly lower in malnourished patients (5.64° ± 0.59 vs 4.64° ± 0.84) and observed a positive correlation between PA and BMI (r = 0.461; p < 0.001), concluding that higher standing PA indicated lower DRM probability.10 In nephrology, Muñoz-Redondo et al. found that a PA ≤ 4.85° identified malnutrition in patients with advanced chronic kidney disease eligible for transplantation (p = 0.003),11 while Karavetian et al. concluded that a PA < 5.7° (p = 0.029) served as a malnutrition indicator in hemodialysis patients.12 Hirose et al. concluded that PA could be a malnutrition marker in cardiovascular patients, finding a negative correlation between PA and the nutritional control (CONUT) score.13 Norman et al. established that PA is a prognostic marker that should be considered as a screening tool for identifying at-risk patients with impaired nutritional and functional status.14
However, in obesity, there is insufficient evidence to elucidate the role of PA in this condition. PA has shown potential for detecting changes in body mass distribution, inflammation, and metabolic function, which may be useful for metabolic risk stratification and personalized therapeutic interventions.6,15 In a systematic review, Di Vincenzo et al. concluded that PA could be helpful in assessing muscle quality in PwO, but more studies are needed.6 Curvello-Silva et al. found no correlation between PA and BC components in PwO but did find a link between low PA and hyperuricemia in this population (p = 0.018).15
The lower correlation between BMI and PA in the DRM and PwO groups vs controls could be attributed to BMI’s limitations, as it does not differentiate between lean and fat mass, making it an inadequate indicator of cellular health. Additionally, fluid distribution may be altered in both conditions, leading to a higher tendency for dehydration or edema in DRM patients. Regarding inflammation—which could explain differences in PwO—a high PA is often associated with low inflammation and good BC.
The higher correlation between PA and age in the DRM group and obesity vs controls may be due to factors related to changes in BC that occur with aging in contexts of malnutrition and obesity. Chronic malnutrition and inflammation observed in these groups, respectively, may lead to a progressive deterioration in the integrity of cell membranes that worsens with age. Likewise, with age, alterations in distribution tend to be more pronounced in these groups, with a greater loss of lean mass in patients with DRm and greater fat mass gain in obese patients (PwO).
This study aligns with the current evidence in the literature. Statistically significant differences are observed, with PA in DRM patients lower than in the general population. Conversely, in PwO, we did not obtain data that would allow us to draw conclusions from a statistical perspective. Although the sample size used is substantial, the main limitation of the study is its retrospective nature, which has prevented us from assessing prognostic implications.
Similarly, it is important to note that the BC assessment in our study was conducted with participants in an upright position. Currently, raw data obtained via bioimpedance is well standardized for patients in a supine position, while there is less evidence and population norms for those in an upright position, in whom the variability of results is greater. Most previous studies were conducted in hospital settings with inpatients, where bioimpedance is usually performed in the supine position, measuring the current that passes through the bodies of bedridden patients. Additionally, this study did not consider a specific fasting or rest period, nor was the room temperature at the time of measurement taken into consideration, which may influence the interpretation of results.
ConclusionsAlthough bioimpedance is one of the most widely used tools in clinical nutrition, we still do not fully understand the role of PA in obesity. In this study, we did not find statistically significant differences between PA values in PwO and healthy individuals, nor a correlation between BMI and PA in PwO. Further studies are required to establish its clinical utility in different subtypes of obese patients (adiposity, sarcopenic obesity, and osteosarcopenic obesity) and to standardize its applicability at a clinical level.
However, PA appears to be a promising tool in evaluating DRM, as our sample shows that PA is significantly lower in the group of DRM patients than in the control group. Integrating PA measurement into clinical evaluation may improve early detection and timely intervention, which in turn could contribute to better health outcomes and quality of life in this vulnerable population. Nonetheless, further studies are needed to standardize cut-off points across different contexts and populations.
Due to the differences found in PA in these groups vs the healthy population, it would be valuable to investigate how nutritional and physical activity interventions impact PA progression in these groups. In addition, longitudinal studies could help understand how changes in PA relate to the progression of diseases and associated comorbidities, providing early indicators of health deterioration or improvement. It would also be interesting to explore the interaction between PA and other biochemical markers of inflammation and oxidative stress to identify new integrated management strategies that could optimize cellular health. Given the lower standardization and greater variability in using BIA in an upright position, it would be worthwhile to investigate how the upright position affects the precision and clinical relevance of PA vs the supine position.
FundingNone declared.
Conflicts of interestNone declared.
