


We aimed to determine the dietary patterns associated with mild cognitive impairment (MCI) in type 2 diabetes (T2DM) and the correlation of dietary inflammatory index (DII) with MCI.
MethodsThe Montreal Cognitive Assessment (MoCA) was used to assess cognitive function. A semi-quantitative food frequency questionnaire was used to collect dietary data and calculate DII. Dietary patterns were determined by reduced-rank regression (RRR), grouping dietary pattern scores and DII into quartiles, with logistic regression for correlation analysis. Dose–response relationships between dietary pattern scores, DII and diabetic MCI were explored using restricted cubic splines (RCS). A mediation analysis was performed to investigate whether DII mediates the association between dietary patterns and MCI.
ResultsIn the “Mediterranean-style dietary pattern”, the multivariable-adjusted odds ratio of having MCI was 0.37 (95% CI: 0.20–0.68; p for trend=0.002) in the highest versus lowest quartiles of the dietary score. In the “high-meat and low-vegetable pattern”, the multivariable-adjusted odds ratio of having MCI was 6.84 (95% CI: 3.58–13.10; p for trend<0.001) in the highest versus lowest quartiles of the dietary score. In the “Western-style dietary pattern”, the multivariable-adjusted odds ratio of having MCI was 2.48 (95% CI: 1.38–4.46; p for trend=0.001). The multivariable-adjusted odds ratio of having MCI was 3.99 (95% CI: 2.14–7.42; p for trend<0.001) in the highest versus lowest quartiles of DII.
There is a non-linear dose–response relationship between the “high-meat and low-vegetable pattern” score and the prevalence of MCI, as well as the DII and the prevalence of MCI. The DII partially mediated the impact of the “Mediterranean-style dietary pattern” and the “high-meat and low-vegetable pattern” on MCI.
ConclusionIn T2DM patients, greater adherence to the “Mediterranean-style dietary pattern” is associated with a lower probability of having MCI. However, excessive consumption of meat, especially red meat and processed meat, combined with a lack of vegetable intake, is associated with a higher probability of having MCI. Greater adherence to the “Western-style dietary pattern” is associated with a higher probability of having MCI. In addition, a pro-inflammatory diet is associated with a higher probability of having MCI, and DII partially mediates the impact of dietary patterns on MCI.
Pretendemos determinar los patrones alimenticios asociados al deterioro cognitivo leve (DCL) en la diabetes mellitus tipo 2 (DMT2) y la correlación del índice inflamatorio alimenticio (IIA) con el DCL.
MétodosPara evaluar la función cognitiva se utilizó la Escala de Evaluación Cognitiva de Montreal (MoCA). Se utilizó un cuestionario semicuantitativo de frecuencia alimenticia para recopilar datos sobre la alimentación y calcular el IIA. Los patrones alimenticios se determinaron mediante regresión de rango reducido (RRR). Agrupación de las puntuaciones de los patrones alimenticios y el IIA en cuartiles. Regresión logística para el análisis de correlación. Se exploraron las relaciones dosis-respuesta entre las puntuaciones de los patrones alimenticios, el IIA y el DCL diabético mediante rayas cúbicas restringidas (RCR). Se realizó un análisis de mediación para investigar si el IIA media en la asociación entre los patrones alimenticios y el DCL.
ResultadosEn el «patrón similar a la dieta mediterránea», la razón de posibilidades ajustada multivariable de padecer DCL fue de 0,37 (IC 95%: 0,20-0,68; p de tendencia=0,002) en los cuartiles más altos frente a los más bajos de la puntuación alimenticia. En el «patrón alto en carne y bajo en verduras», la razón de posibilidades ajustada multivariable de padecer DCL fue de 6,84 (IC 95%: 3,58-13,10; p de tendencia=<0,001) en los cuartiles más altos frente a los más bajos de la puntuación alimenticia. En el «patrón de la dieta occidental», la razón de posibilidades ajustada multivariable de padecer DCL fue de 2,48 (IC 95%=1,38-4,46; p de tendencia=0,001). La razón de posibilidades ajustada multivariable de padecer DCL fue de 3,99 (IC 95%, 2,14-7,42; p de tendencia=<0,001) en los cuartiles más altos frente a los más bajos de IIA.
Existe una relación dosis-respuesta no lineal entre la puntuación del «patrón alto en carne y bajo en verduras» y la prevalencia del DCL, así como entre el IIA y la prevalencia del DCL. El IIA medió parcialmente el impacto del patrón alimenticio «similar a la dieta mediterránea» y del «patrón alto en carne y bajo en verduras» en el DCL.
ConclusiónEn pacientes con DMT2 se asocia la mayor adherencia al «patrón similar a la dieta mediterránea» a una menor probabilidad de padecer DCL. Sin embargo, el consumo excesivo de carne, especialmente de carne roja y carne procesada, combinado con la falta de ingesta de verduras, se asocia a una mayor probabilidad de padecer DCL. La mayor adherencia al «patrón alimenticio occidental» se asocia a una mayor probabilidad de padecer DCL. Además, una dieta proinflamatoria se asocia a una mayor probabilidad de padecer DCL y el IIA media parcialmente las consecuencias de los patrones alimenticios en el DCL.
Dementia has become a serious social burden. Mild cognitive impairment (MCI) is the transitional stage between normal ageing and early dementia. A new longitudinal study shows that global cognition, memory, orientation and executive function decline in patients after the onset of diabetes.1 This suggests that diabetes is a major risk factor for the onset and progression of cognitive impairment. In addition, studies have shown that the combined prevalence of dementia and cognitive impairment in people with diabetes is 13.1% for those aged 65–74 years and 24.2% for those aged 75 and over.2 Based on the current high co-prevalence of diabetes and cognitive impairment, it is crucial to explore the prevention or delay of cognitive impairment in patients with diabetes. Epidemiological evidence suggests that nutrients such as folic acid and vitamins are beneficial to cognitive function.3 However, exploring only single nutrients has limitations. This is because the synergistic and interactive effects of the intake of different nutrients and food groups determined by dietary habits are very complex. In contrast, dietary pattern analysis allows for a more comprehensive assessment. A 12-week diet intervention trial proved that the Mediterranean dietary pattern can reduce the level of oxidative stress markers in type 2 diabetes by increasing the level of citrus bioflavonoids.4 This indicates that dietary patterns are related to oxidative stress, which can promote the occurrence and development of cognitive impairment in diabetes by regulating insulin resistance, neuroinflammation and lipid metabolism disorders.5 Cerebrovascular function and dysfunction and damage of the blood–brain barrier (BBB) are also important factors for cognitive impairment in diabetes.6 A diet rich in saturated fat and cholesterol has been shown to cause damage to the integrity of the blood–brain barrier (BBB) in the hippocampus, a core component of learning and memory behaviour.7
Therefore, it is important to explore the correlation between dietary patterns and MCI in patients with diabetes for reference purposes. In addition, the Dietary Index is an important tool to assess the quality of diet. The Dietary Inflammatory Index (DII) is a literature-derived dietary tool developed in 2009 to assess the effect of food components on specific inflammatory markers and to score whether the food has a pro-inflammatory or anti-inflammatory effect; the developers searched and screened 927 articles which examine the relationship between inflammation and food components.8 In 2014, it was updated by Nitin Shivappa et al., who assessed the relationship between six inflammatory factors and 45 food parameters; mainly dietary nutrients.9 Alterations in peripheral cytokine gradients affect pro-inflammatory responses in the brain, causing or accelerating cognitive dysfunction.10 DII is associated with dementia and cognitive impairment in the older adult population, but studies in the context of patients with diabetes are lacking. Therefore, in this study, we also focused on the correlation between DII and MCI in patients with diabetes.
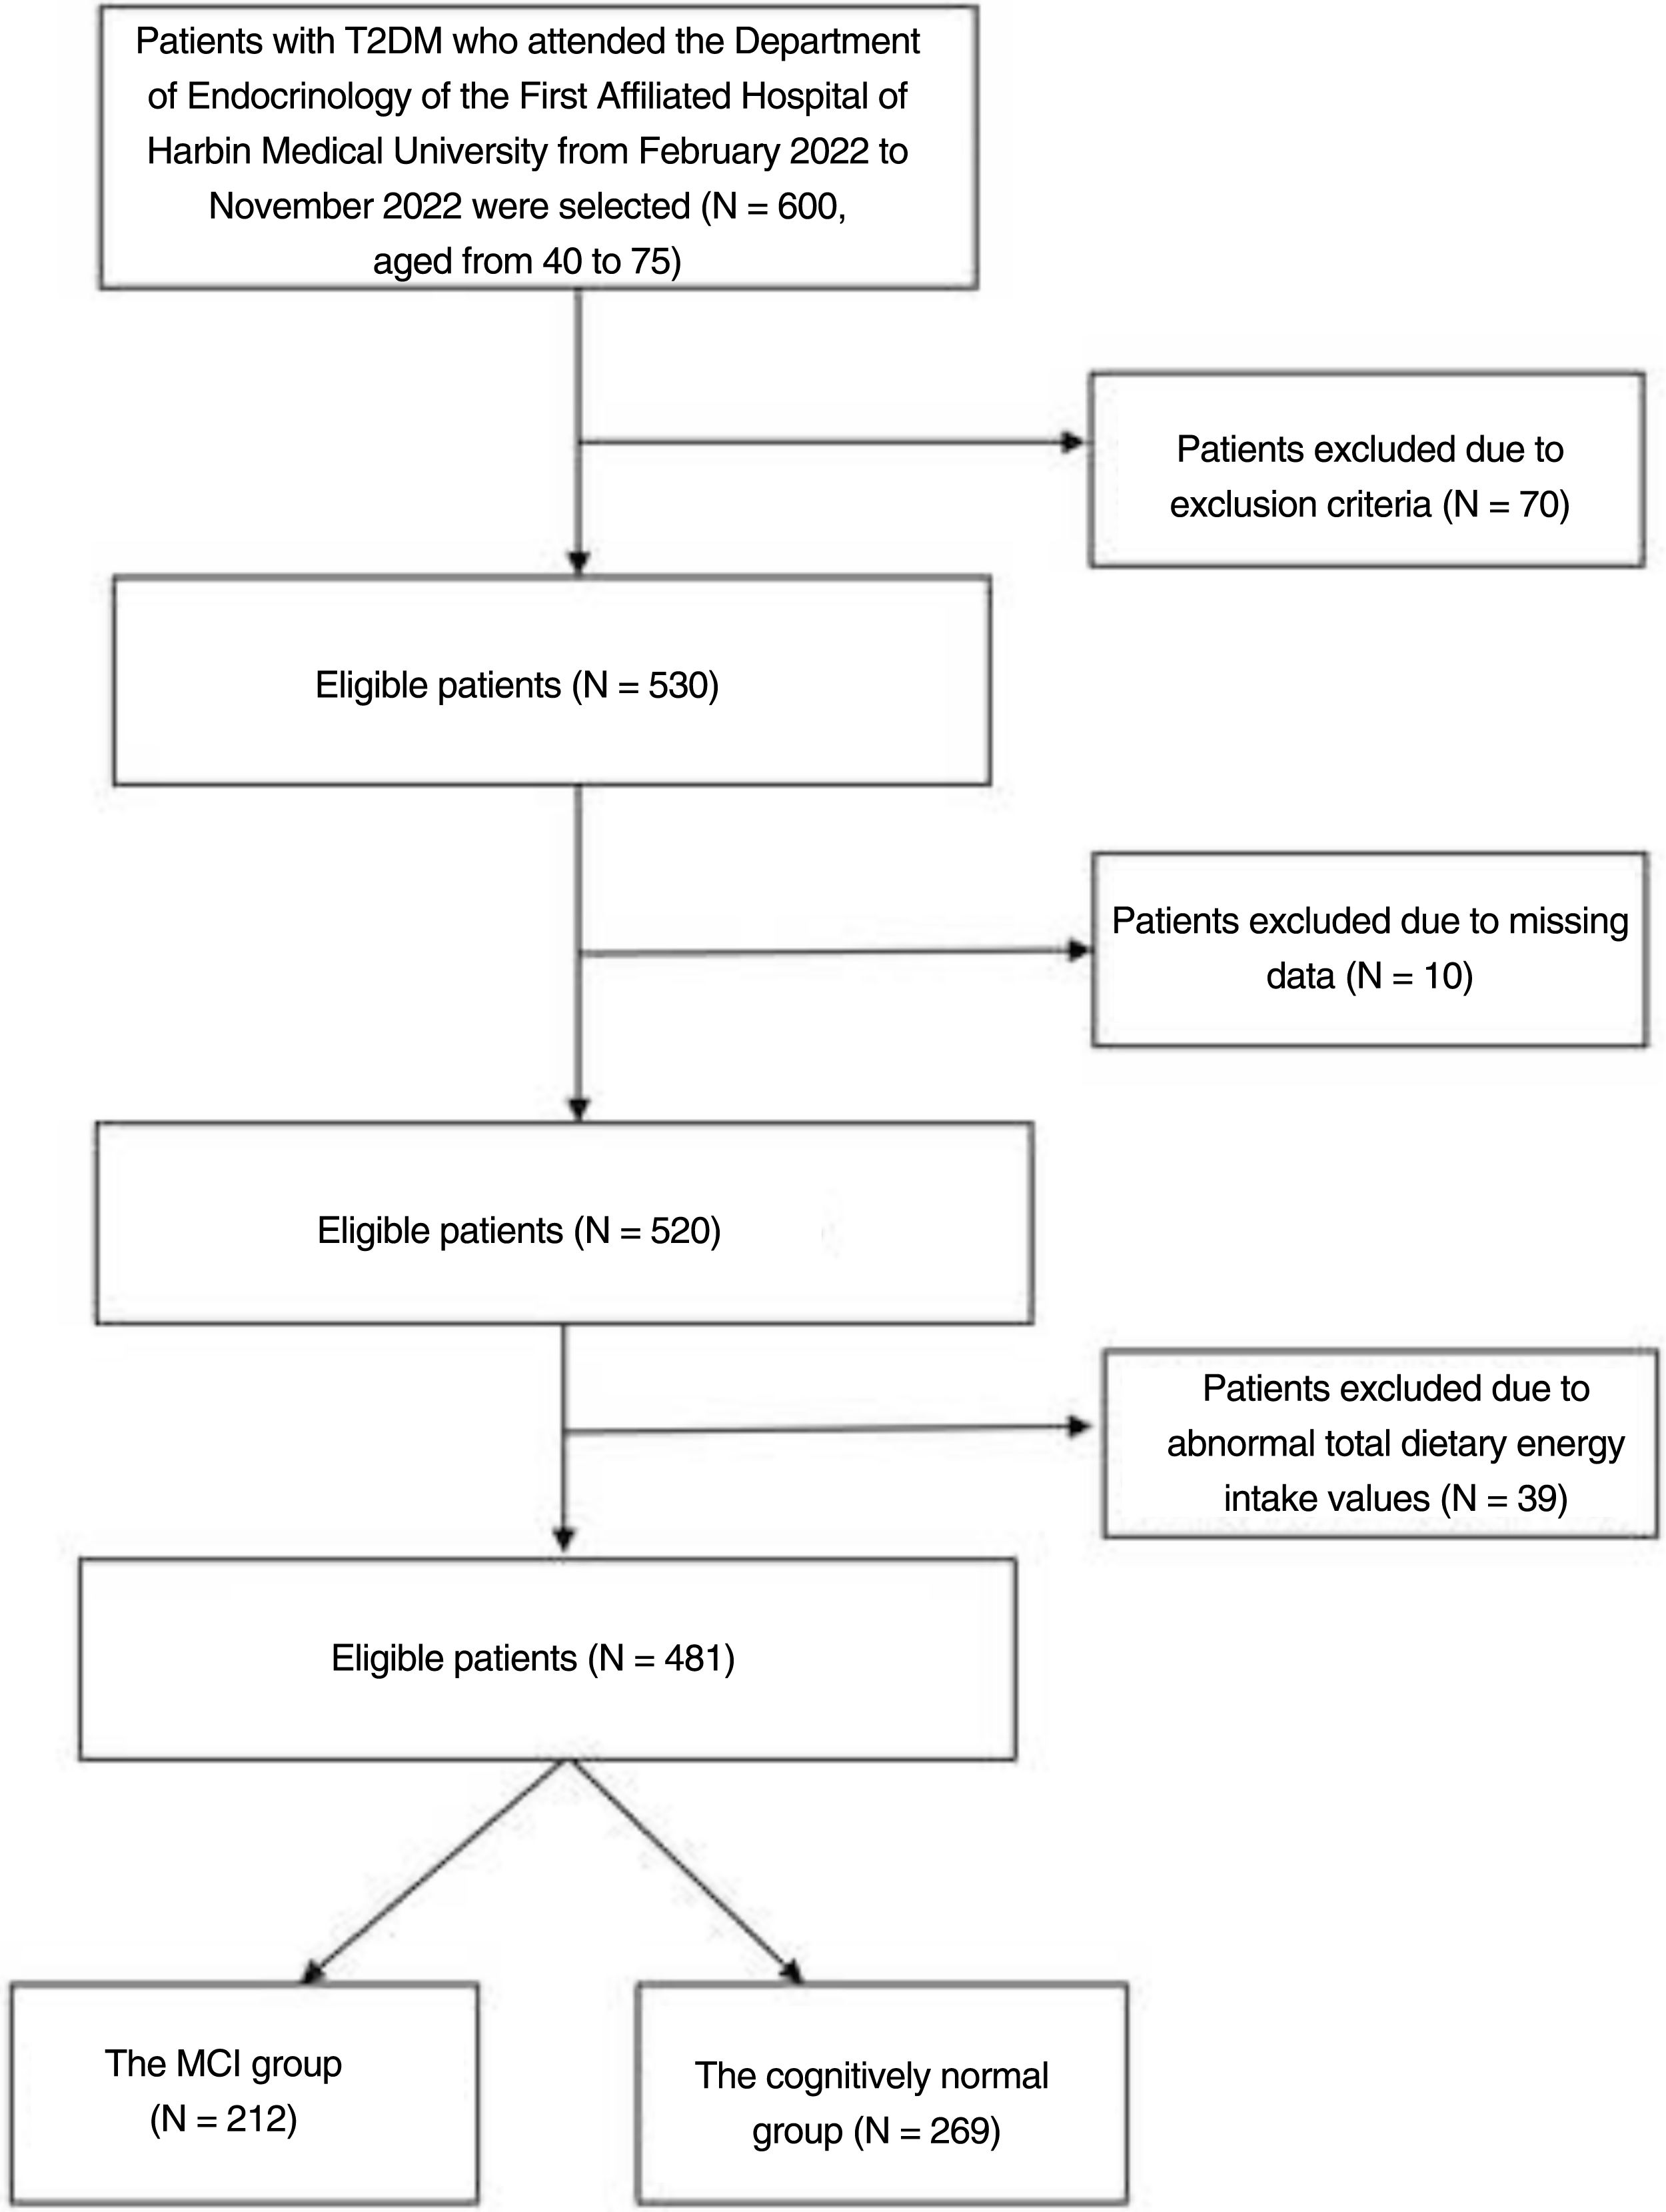
MethodsSubjectsThe researchers recruited 600 patients with type 2 diabetes by convenience sampling from February 2022 to November 2022 at the Department of Endocrinology, the First Hospital of Harbin Medical University. Their ages ranged from 40 to 75. The diagnostic criteria for diabetes are according to the American Diabetes Association.11 The following patients were excluded from the study: (a) history of acute diabetic complications, history of severe hypoglycaemia; (b) comorbid autoimmune diseases, hepatitis, renal disease, cardiovascular disease, acute and chronic infections; (c) comorbid neurological diseases affecting cognitive function; (d) comorbid visual and auditory disorders, psychiatric diseases or psychological illnesses (depression, bipolar disorder, drug or alcohol addiction, personality disorder, autism, anorexia nervosa, bulimia nervosa); (e) patients with dementia; (f) subjects who refused to participate in the study and subjects with incomplete information. Those with a total dietary energy intake of less than 800kcal, more than 4000kcal, and other abnormal dietary nutrient intake values were also eventually excluded (Fig. 1).
Cognitive assessment
The diagnosis of MCI is based on the criteria developed by the National Institute on Aging-Alzheimer's Association Task Force in 2011.12 Criteria included: (a) attention to cognitive changes from self/informant/clinician reports; (b) objective evidence of disease in one or more cognitive areas (in this study, we assessed cognition using the Montreal Cognitive Assessment (MoCA), which was administered by Xuewei Tong, who has received the required MoCA training and certification); (c) independence in the ability to maintain daily functioning; and (d) absence of dementia. The MoCA is a highly sensitive cognitive screening tool that rapidly detects MCI and distinguishes individuals with MCI from normal individuals.13,14 In this study, MCI was defined as a score greater than or equal to 19 and less than 26. Cognitive normality is defined as a score greater than or equal to 26 points. If the patient's formal education is less than or equal to 12 years, one point is added.15,16
DII calculation and dietary pattern assessmentWe used the semi-quantitative Food Frequency Questionnaire (FFQ) to calculate the DII. The FFQ was used to assess the frequency and amount of 115 food items eaten by patients in the past year. Frequency of intake was recorded in terms of times/day, times/week, times/month and times/year. The amount of food consumed was recorded in grams. Although a total of 25 nutrients were included in this study, it has been shown that DII calculations for fewer than 30 dietary nutrients do not affect predictability.17 We included dietary nutrients such as caffeine, alcohol, beta carotene, carbohydrates, cholesterol, protein, energy, total fat, dietary fibre, folic acid, selenium, iron, magnesium, zinc, monounsaturated fatty acids, polyunsaturated fatty acids, niacin, riboflavin, isoflavones, vitamin B1, vitamin A, vitamin C, vitamin E, onion and garlic. Daily intakes of each nutrient were calculated by consulting the Chinese Food Composition Table (6th edition). Z-values were obtained by standardising nutrient intakes by global per capita daily intakes and standard deviations for each nutrient (from a dietary database containing 11 countries and regions). To allow for data centring, Z values were converted to percentiles and doubled and subtracted by 1. These central percentiles were then multiplied by the corresponding total inflammatory effect scores and summed to obtain an overall DII score for each.
Dietary patterns were determined using reduced-rank regression (RRR). We excluded tea, juice, cola and beverages due to the small sample size of their intake. The foods were divided into 16 food groups as predictor variables. Log-transformed intakes of folic acid, vitamin C, monounsaturated fatty acids and polyunsaturated fatty acids were selected as response variables, because these nutrients are thought to be correlated with cognitive impairment.18–20 The Z-transformed food intake of each group was weighted by the factor loadings and then summed to calculate the dietary pattern score.
Other variablesDemographic characteristics, education level, smoking, sleep and duration of diabetes were collected from patients admitted to the hospital. Venous blood was drawn from all patients with 8-hour fasting before testing. Glycated haemoglobin (HbA1c) was measured by high-performance liquid chromatography using a glycated haemoglobin analyser, and fasting blood glucose (FBG), total cholesterol (TC), triglycerides (TG), high-density lipoprotein cholesterol (HDL-c), creatinine (Cr) and, uric acid (UA) were measured by enzymatic method using a fully automated biochemical analysis instrument. A fully automated haematology analyser was used to determine white blood cell, neutrophil, lymphocyte and platelet counts and make the calculations to obtain systemic immune-inflammatory index (SII)=platelet count×neutrophil count/lymphocyte count, neutrophil-to-lymphocyte ratio (NLR) and platelet-to-lymphocyte ratio (PLR).
Statistical analysisDescriptive statistical analysis, differential analysis, and regression analysis were performed using SPSS 23.0. Continuous variables were expressed as mean±standard deviation or median (quartiles) and categorical variables were expressed as percentages. The t-test was used for normally distributed variables, the Mann–Whitney U-test for skewed distribution, and the Chi-square test for categorical variables.
RRR was performed using SAS 9.4. Food groups with absolute values of factor loadings >0.2 were considered to be the main contributors to dietary patterns, grouping dietary pattern scores and DII into quartiles, represented by Q1, Q2, Q3 and Q4, where Q1 was the lowest quartile array and was considered the reference group. The associations between dietary pattern scores, DII and MCI were analysed using logistic regression, testing for trend based on the variable containing a median value for each quartile. We explored the dose–response relationship between DP score, DII and diabetic MCI using restricted cubic splines (RCS) by R version 4.1.3.
Finally, we performed a mediation analysis to investigate whether DII had a mediating effect in the association between the four dietary patterns and MCI using the mediation package for mediation analysis. We constructed a simple mediation model with dietary pattern score as the independent variable, MCI as the dependent variable and DII as the mediator variable. Linear regression was used to test the path from the independent variable to the mediator variable. Probit regression was used to test and examine the path from independent and mediating variables to dependent variables. The bootstrap method was used to examine the mediating effect (bootstrap samples=1000). In all analyses, p<0.05 was considered statistically significant.
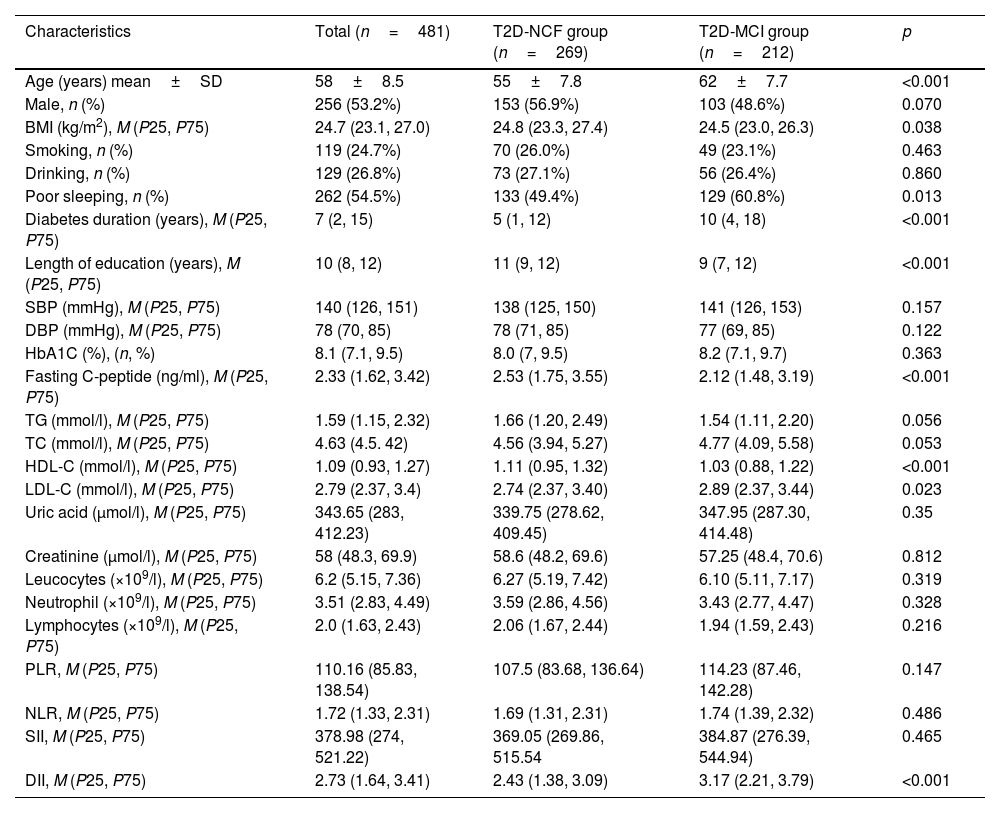
ResultsCharacteristics of the study populationsThe baseline characteristics of the 481 participants included in this study are shown in Table 1. We included 256 men and 225 women in this study with a mean age of 58. The MCI group was significantly older and duration of diabetes was longer than in the cognitively normal group (p<0.01) (Fig. 1). LDL-c levels were higher in the MCI group (p<0.05). In addition, length of time in education was significantly shorter and fasting C-peptide and HDL-c significantly lower in the MCI group than in the cognitively normal group (p<0.01). The incidence of poor sleep was higher in the MCI group (p<0.05). The DII was significantly higher in the MCI group than in the cognitively normal group (p<0.01). There were no statistically significant differences between the two groups in the remaining inflammatory indices (for example, SII, PLR and NLR).
Baseline characteristics of the MCI group versus the normal cognitive function (NCF) group.
| Characteristics | Total (n=481) | T2D-NCF group (n=269) | T2D-MCI group (n=212) | p |
|---|---|---|---|---|
| Age (years) mean±SD | 58±8.5 | 55±7.8 | 62±7.7 | <0.001 |
| Male, n (%) | 256 (53.2%) | 153 (56.9%) | 103 (48.6%) | 0.070 |
| BMI (kg/m2), M (P25, P75) | 24.7 (23.1, 27.0) | 24.8 (23.3, 27.4) | 24.5 (23.0, 26.3) | 0.038 |
| Smoking, n (%) | 119 (24.7%) | 70 (26.0%) | 49 (23.1%) | 0.463 |
| Drinking, n (%) | 129 (26.8%) | 73 (27.1%) | 56 (26.4%) | 0.860 |
| Poor sleeping, n (%) | 262 (54.5%) | 133 (49.4%) | 129 (60.8%) | 0.013 |
| Diabetes duration (years), M (P25, P75) | 7 (2, 15) | 5 (1, 12) | 10 (4, 18) | <0.001 |
| Length of education (years), M (P25, P75) | 10 (8, 12) | 11 (9, 12) | 9 (7, 12) | <0.001 |
| SBP (mmHg), M (P25, P75) | 140 (126, 151) | 138 (125, 150) | 141 (126, 153) | 0.157 |
| DBP (mmHg), M (P25, P75) | 78 (70, 85) | 78 (71, 85) | 77 (69, 85) | 0.122 |
| HbA1C (%), (n, %) | 8.1 (7.1, 9.5) | 8.0 (7, 9.5) | 8.2 (7.1, 9.7) | 0.363 |
| Fasting C-peptide (ng/ml), M (P25, P75) | 2.33 (1.62, 3.42) | 2.53 (1.75, 3.55) | 2.12 (1.48, 3.19) | <0.001 |
| TG (mmol/l), M (P25, P75) | 1.59 (1.15, 2.32) | 1.66 (1.20, 2.49) | 1.54 (1.11, 2.20) | 0.056 |
| TC (mmol/l), M (P25, P75) | 4.63 (4.5. 42) | 4.56 (3.94, 5.27) | 4.77 (4.09, 5.58) | 0.053 |
| HDL-C (mmol/l), M (P25, P75) | 1.09 (0.93, 1.27) | 1.11 (0.95, 1.32) | 1.03 (0.88, 1.22) | <0.001 |
| LDL-C (mmol/l), M (P25, P75) | 2.79 (2.37, 3.4) | 2.74 (2.37, 3.40) | 2.89 (2.37, 3.44) | 0.023 |
| Uric acid (μmol/l), M (P25, P75) | 343.65 (283, 412.23) | 339.75 (278.62, 409.45) | 347.95 (287.30, 414.48) | 0.35 |
| Creatinine (μmol/l), M (P25, P75) | 58 (48.3, 69.9) | 58.6 (48.2, 69.6) | 57.25 (48.4, 70.6) | 0.812 |
| Leucocytes (×109/l), M (P25, P75) | 6.2 (5.15, 7.36) | 6.27 (5.19, 7.42) | 6.10 (5.11, 7.17) | 0.319 |
| Neutrophil (×109/l), M (P25, P75) | 3.51 (2.83, 4.49) | 3.59 (2.86, 4.56) | 3.43 (2.77, 4.47) | 0.328 |
| Lymphocytes (×109/l), M (P25, P75) | 2.0 (1.63, 2.43) | 2.06 (1.67, 2.44) | 1.94 (1.59, 2.43) | 0.216 |
| PLR, M (P25, P75) | 110.16 (85.83, 138.54) | 107.5 (83.68, 136.64) | 114.23 (87.46, 142.28) | 0.147 |
| NLR, M (P25, P75) | 1.72 (1.33, 2.31) | 1.69 (1.31, 2.31) | 1.74 (1.39, 2.32) | 0.486 |
| SII, M (P25, P75) | 378.98 (274, 521.22) | 369.05 (269.86, 515.54 | 384.87 (276.39, 544.94) | 0.465 |
| DII, M (P25, P75) | 2.73 (1.64, 3.41) | 2.43 (1.38, 3.09) | 3.17 (2.21, 3.79) | <0.001 |
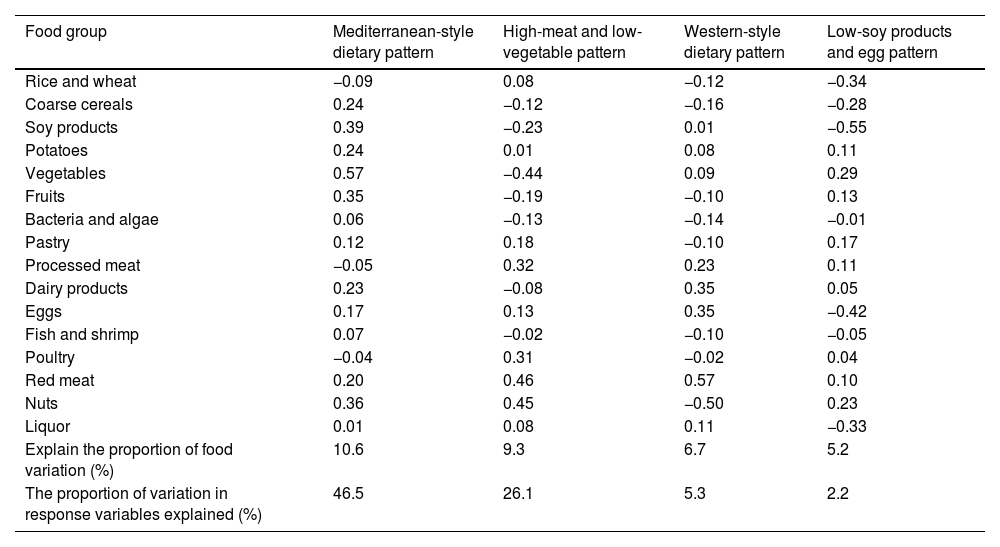
Table 2 shows the four dietary patterns identified by the RRR and the factor loadings for each food group. These four dietary patterns explained 46.5%, 26.1%, 5.3% and 2.2% of the variance in the response variable respectively. The first dietary pattern, marked as the “Mediterranean-style dietary pattern”, was characterised by high consumption of vegetables, soy products, nuts, fruits, coarse cereals, potatoes, dairy products and red meat. The second dietary pattern, the “High-meat and low-vegetable pattern”, was characterised by high consumption of red meat, poultry, processed meat and nuts, and low consumption of vegetables and soy products. The third dietary pattern is marked as the “Western-style dietary pattern”, and was characterised by high consumption of red meat, processed meat, eggs and dairy products, and low consumption of nuts. The fourth dietary pattern, marked as the “Low-soy products and egg pattern”, was characterised by low consumption of soy products, eggs, rice and wheat, liquor and coarse cereals, and high consumption of vegetables and nuts.
Factor loading matrix for dietary patterns.
| Food group | Mediterranean-style dietary pattern | High-meat and low-vegetable pattern | Western-style dietary pattern | Low-soy products and egg pattern |
|---|---|---|---|---|
| Rice and wheat | −0.09 | 0.08 | −0.12 | −0.34 |
| Coarse cereals | 0.24 | −0.12 | −0.16 | −0.28 |
| Soy products | 0.39 | −0.23 | 0.01 | −0.55 |
| Potatoes | 0.24 | 0.01 | 0.08 | 0.11 |
| Vegetables | 0.57 | −0.44 | 0.09 | 0.29 |
| Fruits | 0.35 | −0.19 | −0.10 | 0.13 |
| Bacteria and algae | 0.06 | −0.13 | −0.14 | −0.01 |
| Pastry | 0.12 | 0.18 | −0.10 | 0.17 |
| Processed meat | −0.05 | 0.32 | 0.23 | 0.11 |
| Dairy products | 0.23 | −0.08 | 0.35 | 0.05 |
| Eggs | 0.17 | 0.13 | 0.35 | −0.42 |
| Fish and shrimp | 0.07 | −0.02 | −0.10 | −0.05 |
| Poultry | −0.04 | 0.31 | −0.02 | 0.04 |
| Red meat | 0.20 | 0.46 | 0.57 | 0.10 |
| Nuts | 0.36 | 0.45 | −0.50 | 0.23 |
| Liquor | 0.01 | 0.08 | 0.11 | −0.33 |
| Explain the proportion of food variation (%) | 10.6 | 9.3 | 6.7 | 5.2 |
| The proportion of variation in response variables explained (%) | 46.5 | 26.1 | 5.3 | 2.2 |
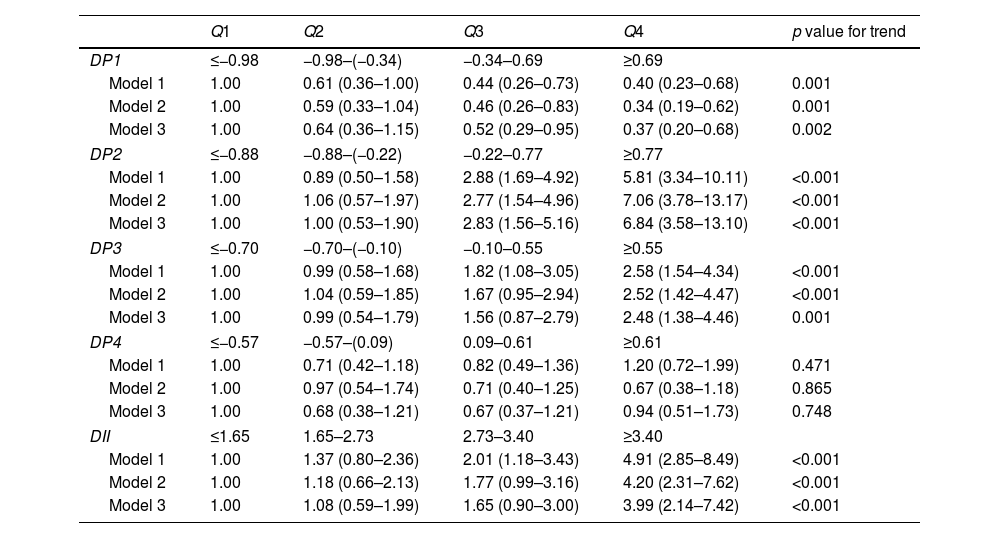
As shown in Table 3, in the “Mediterranean-style dietary pattern”, the Q3 and Q4 groups were associated with a decreased prevalence of MCI compared to the lowest quartile Q1 of the dietary pattern score (p<0.05). This association persisted even after adjusting for multiple covariates, with odds ratios of 0.52 (95% CI: 0.29–0.95) and 0.37 (95% CI: 0.20–0.68) respectively, and a trend test p=0.002. In the “High-meat and low-vegetable pattern”, compared with Q1, the Q3 and Q4 groups were associated with an increased prevalence of MCI (p<0.05). After adjusting for covariates, this association still existed, with odds ratios of 2.83 (95% CI: 1.56–5.16) and 6.84 (95% CI: 3.58–13.10) respectively, and trend tests p<0.001. In the “Western-style dietary pattern”, compared with Q1, the Q4 group was associated with an increased prevalence of MCI (p<0.05). After adjusting for covariates, the odds ratio was 2.48 (95% CI: 1.38–4.46) and the trend test p=0.001. The “Low-soy products and egg” pattern was not significantly associated with the prevalence of MCI.
Odds ratios and 95% confidence intervals for MCI according to quartiles of dietary pattern scores.
| Q1 | Q2 | Q3 | Q4 | p value for trend | |
|---|---|---|---|---|---|
| DP1 | ≤−0.98 | −0.98–(−0.34) | −0.34–0.69 | ≥0.69 | |
| Model 1 | 1.00 | 0.61 (0.36–1.00) | 0.44 (0.26–0.73) | 0.40 (0.23–0.68) | 0.001 |
| Model 2 | 1.00 | 0.59 (0.33–1.04) | 0.46 (0.26–0.83) | 0.34 (0.19–0.62) | 0.001 |
| Model 3 | 1.00 | 0.64 (0.36–1.15) | 0.52 (0.29–0.95) | 0.37 (0.20–0.68) | 0.002 |
| DP2 | ≤−0.88 | −0.88–(−0.22) | −0.22–0.77 | ≥0.77 | |
| Model 1 | 1.00 | 0.89 (0.50–1.58) | 2.88 (1.69–4.92) | 5.81 (3.34–10.11) | <0.001 |
| Model 2 | 1.00 | 1.06 (0.57–1.97) | 2.77 (1.54–4.96) | 7.06 (3.78–13.17) | <0.001 |
| Model 3 | 1.00 | 1.00 (0.53–1.90) | 2.83 (1.56–5.16) | 6.84 (3.58–13.10) | <0.001 |
| DP3 | ≤−0.70 | −0.70–(−0.10) | −0.10–0.55 | ≥0.55 | |
| Model 1 | 1.00 | 0.99 (0.58–1.68) | 1.82 (1.08–3.05) | 2.58 (1.54–4.34) | <0.001 |
| Model 2 | 1.00 | 1.04 (0.59–1.85) | 1.67 (0.95–2.94) | 2.52 (1.42–4.47) | <0.001 |
| Model 3 | 1.00 | 0.99 (0.54–1.79) | 1.56 (0.87–2.79) | 2.48 (1.38–4.46) | 0.001 |
| DP4 | ≤−0.57 | −0.57–(0.09) | 0.09–0.61 | ≥0.61 | |
| Model 1 | 1.00 | 0.71 (0.42–1.18) | 0.82 (0.49–1.36) | 1.20 (0.72–1.99) | 0.471 |
| Model 2 | 1.00 | 0.97 (0.54–1.74) | 0.71 (0.40–1.25) | 0.67 (0.38–1.18) | 0.865 |
| Model 3 | 1.00 | 0.68 (0.38–1.21) | 0.67 (0.37–1.21) | 0.94 (0.51–1.73) | 0.748 |
| DII | ≤1.65 | 1.65–2.73 | 2.73–3.40 | ≥3.40 | |
| Model 1 | 1.00 | 1.37 (0.80–2.36) | 2.01 (1.18–3.43) | 4.91 (2.85–8.49) | <0.001 |
| Model 2 | 1.00 | 1.18 (0.66–2.13) | 1.77 (0.99–3.16) | 4.20 (2.31–7.62) | <0.001 |
| Model 3 | 1.00 | 1.08 (0.59–1.99) | 1.65 (0.90–3.00) | 3.99 (2.14–7.42) | <0.001 |
Model 1: Crude model.
Model 2: Adjust for age and gender.
Model 3: Model 2+smoking, HbA1c, duration of diabetes, sleep, education level and BMI.
The odds ratios of MCI according to the DII quartile category are shown in Table 3. Compared with Q1, the Q4 groups were associated with an increased prevalence of MCI (p<0.05). The correlation remained after adjusting for age, gender smoking, HbA1c, duration of diabetes, sleep, education level and BMI (model 3). The odds ratio was 3.99 (95% CI: 2.14–7.42; p for trend<0.001).
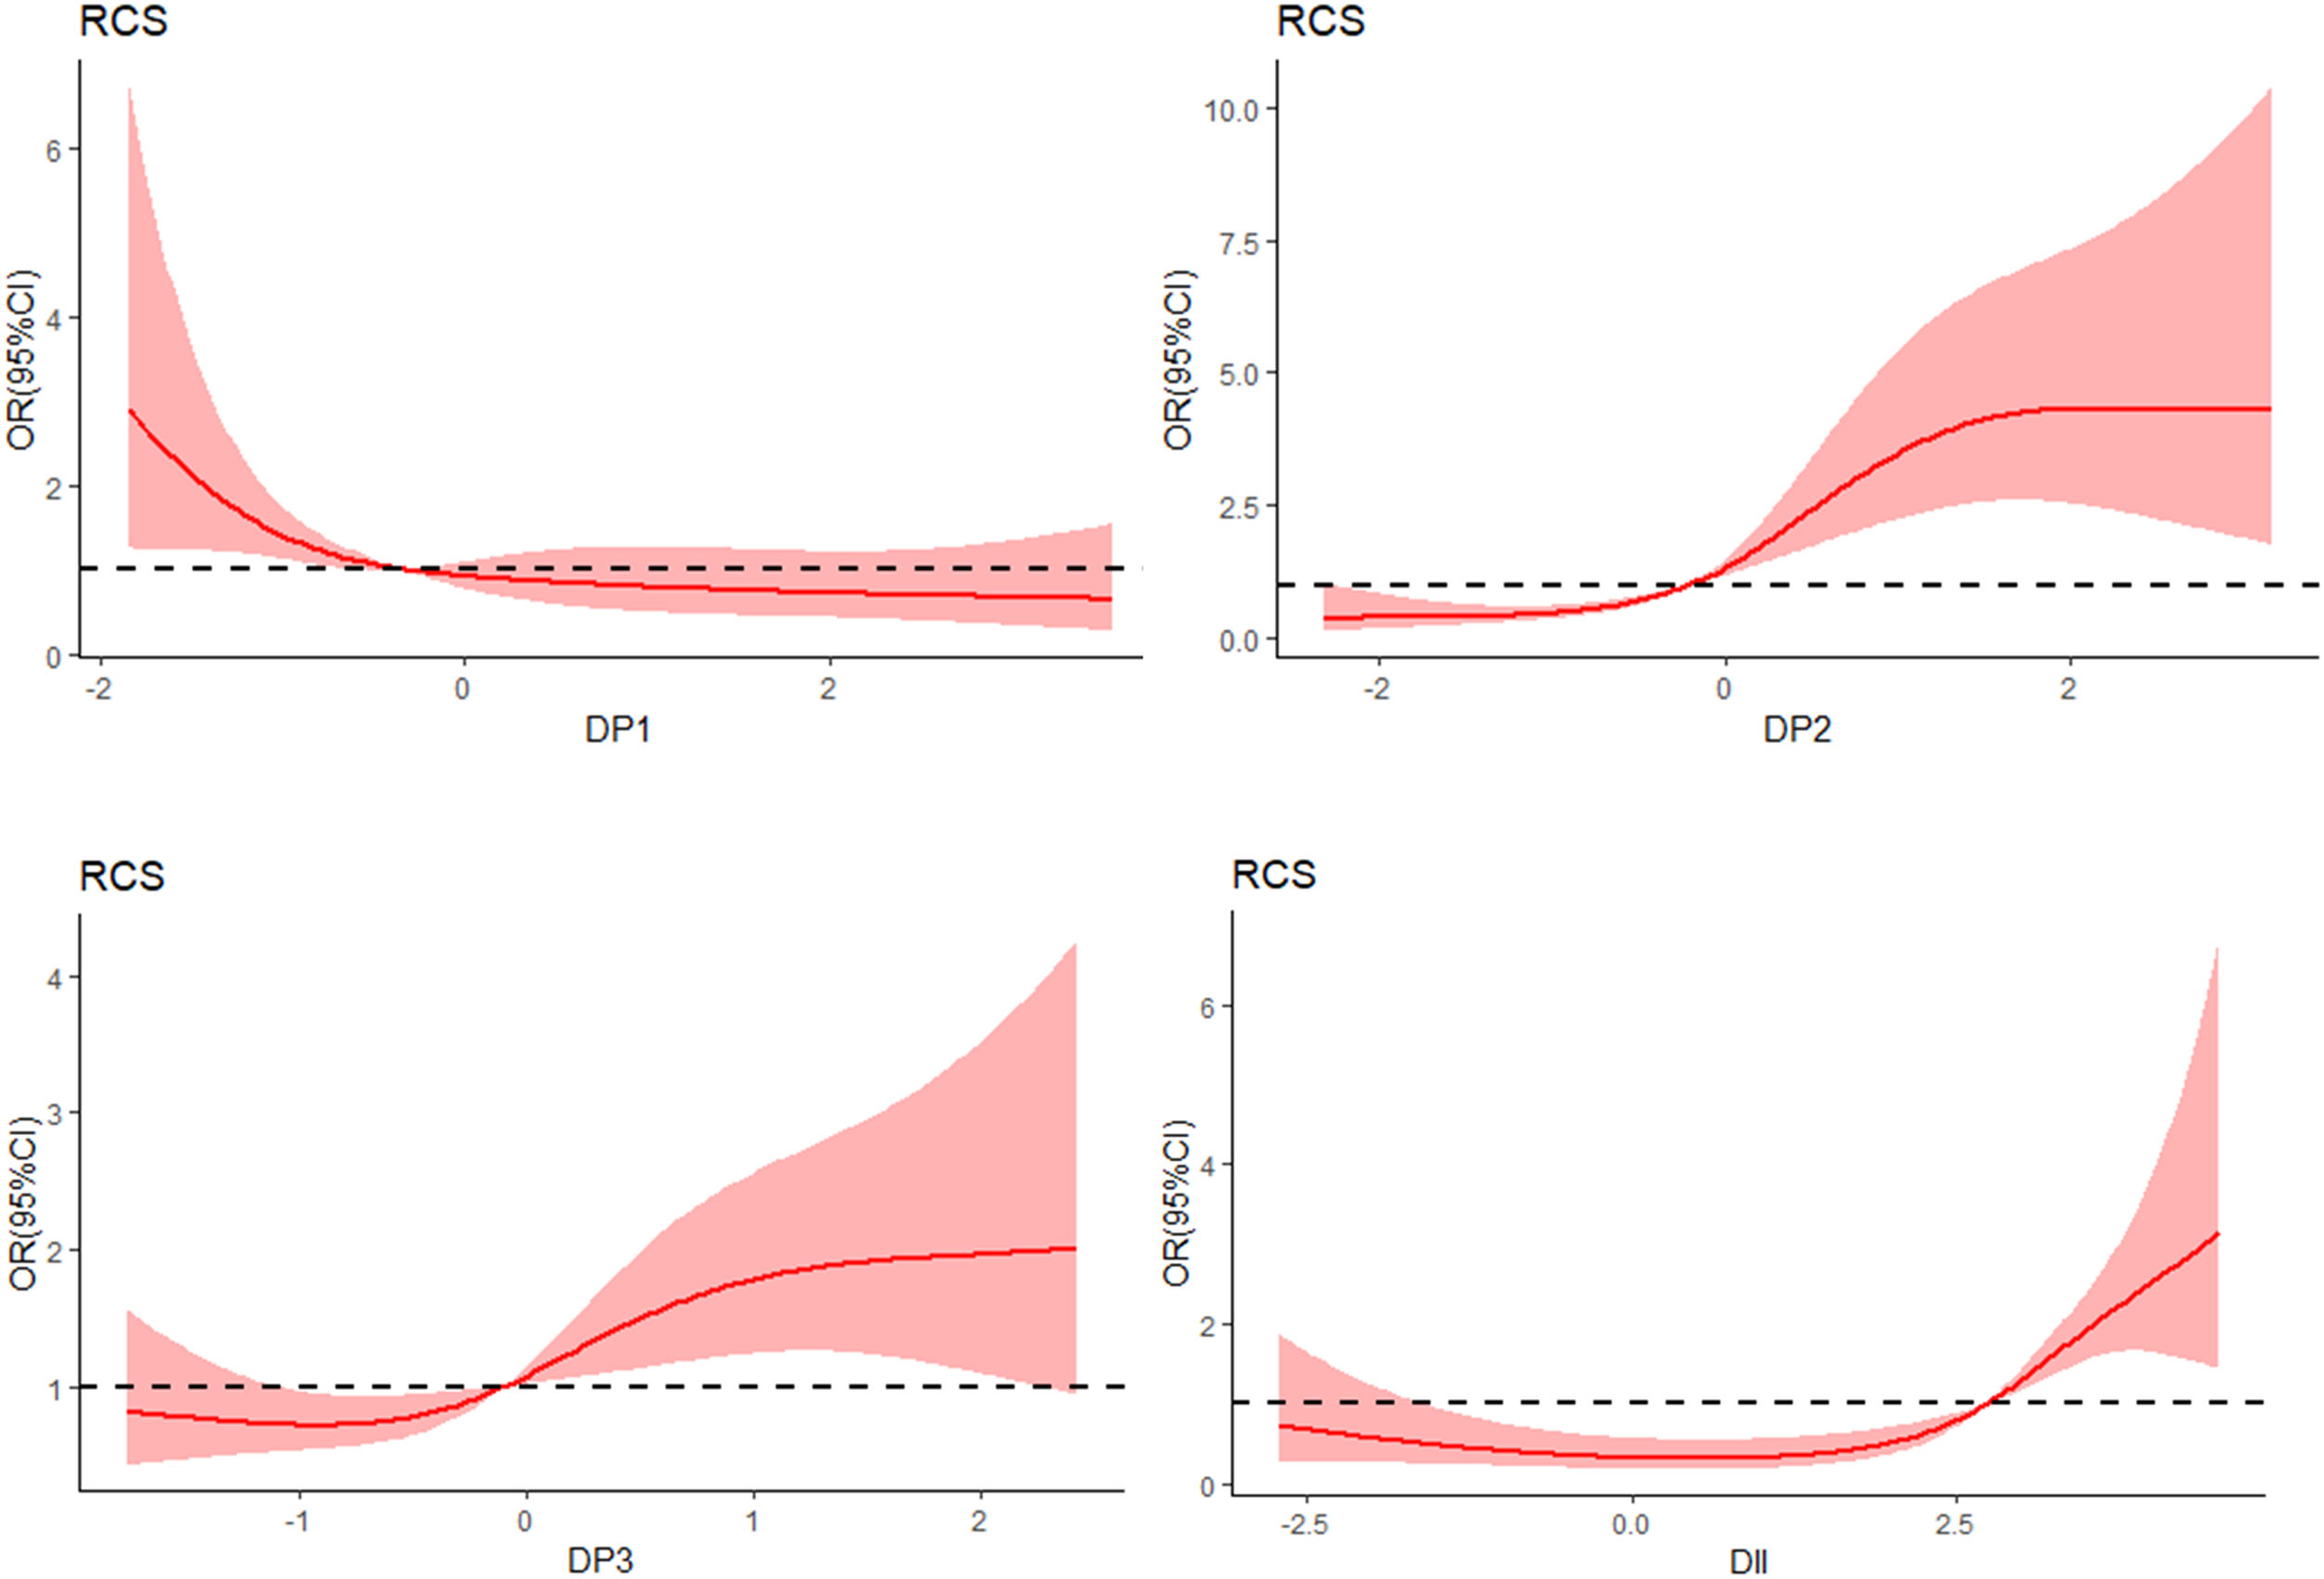
RCS analysis of the dose–response relationship between DP fraction, DII and MCIWe used the RCS model with four knots to simulate the relationship between the four dietary patterns, DII and MCI (Fig. 2). After adjusting for age, gender, smoking, HbA1c, duration of diabetes, sleep, education level and BMI, the RCS model showed a non-linear dose–response relationship between the “High-meat and low-vegetable pattern” score and the prevalence of MCI (χ2=53.8, p for nonlinearity=0.01). In addition, there was a non-linear dose–response correlation between DII and the prevalence of MCI (χ2=39.5, p for nonlinearity<0.001).
Mediation analysis
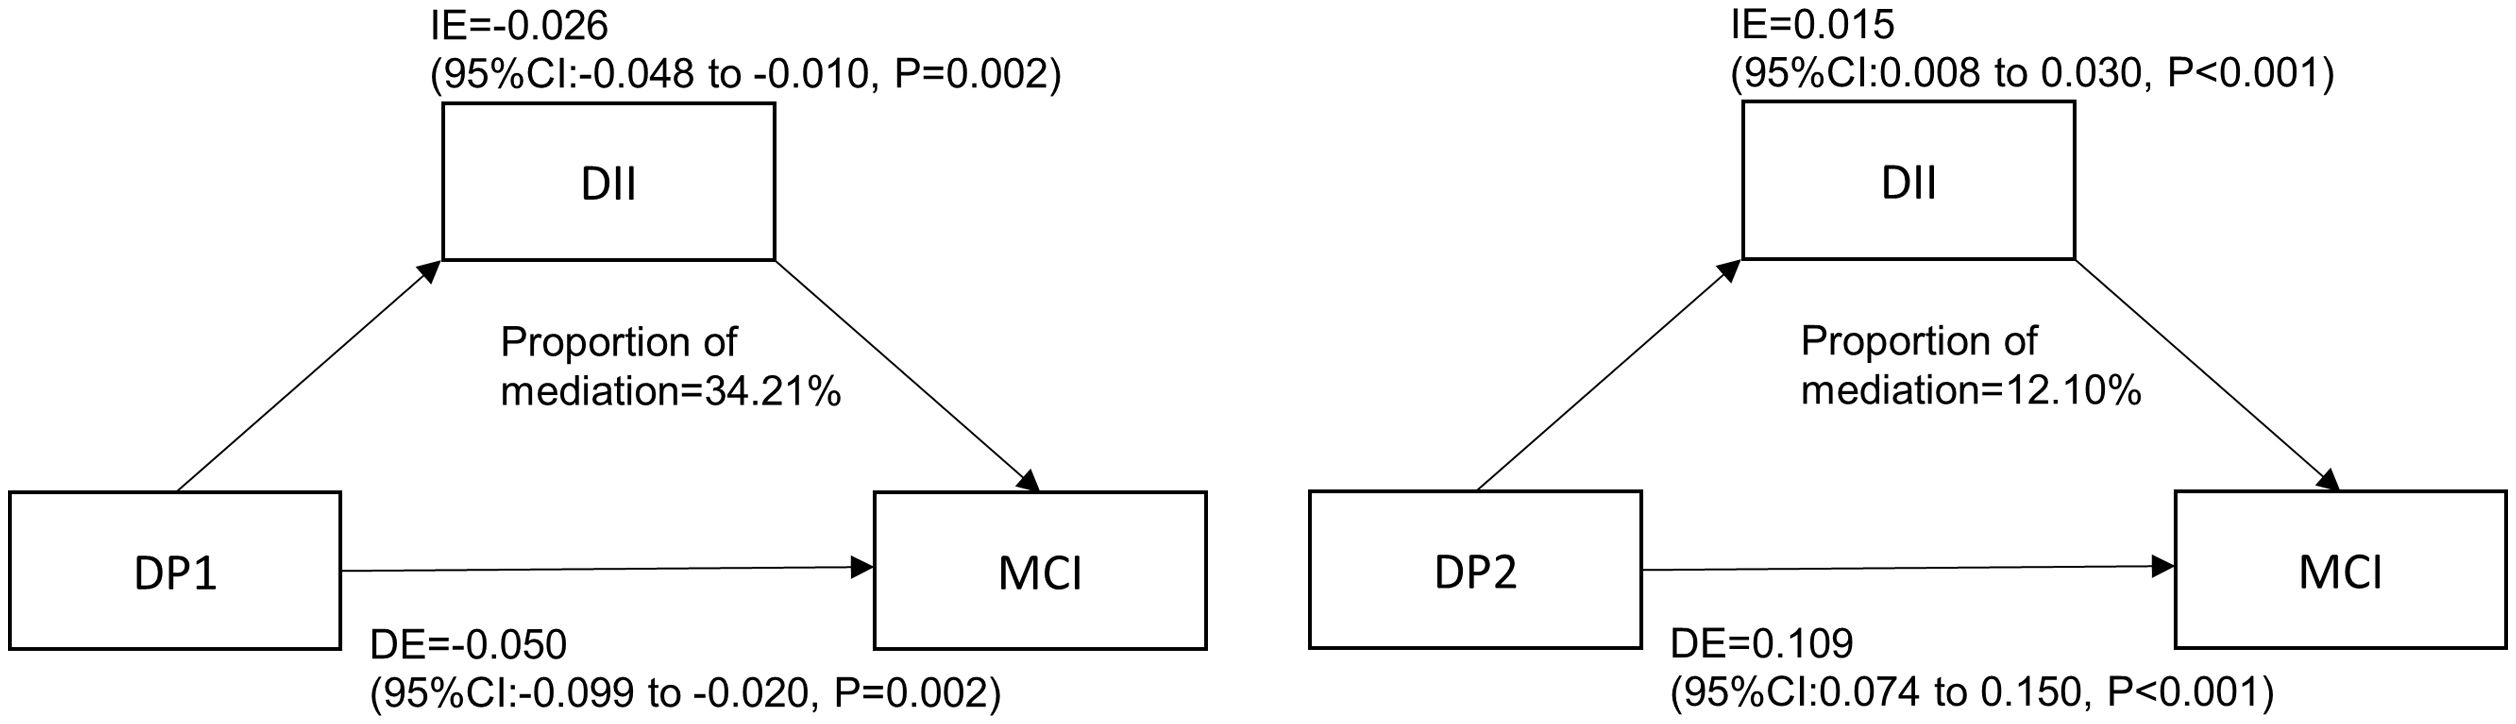
The results are shown in Fig. 3. DII played a partial mediating effect in the correlation between “Mediterranean-style dietary pattern” scores and the prevalence of MCI. In the adjusted model (age, gender, smoking, HbA1c, duration of diabetes, sleep, education level and BMI), the mediating effect size was −0.026 (95%CI: −0.048 −(−0.010)) and the mediating effect accounts for 34.21% of the total effect. DII partially mediated the correlation between “High-meat and low-vegetable pattern” scores and the prevalence of MCI. In the adjusted model, the mediating effect size was 0.015(95%CI: 0.008-0.030), and the mediating effect accounts for 12.10% of the total effect. DII had no mediating effect on the correlation between Western dietary pattern scores and the prevalence of MCI.
Discussion
T2DM is a high-risk group for the development of cognitive impairment. A good diet is an important cornerstone in treating diabetes and preventing complications. Considering the complexity of food, it may be more necessary to explore the correlation between dietary patterns and cognitive impairment of diabetes than to focus on single food or specific nutrients. To our knowledge, this is the first study to examine the association between dietary patterns and MCI in the T2DM population based on RRR. Our results suggest that specific dietary patterns and DII are associated with MCI.
Four dietary patterns were identified. The first dietary pattern is characterised by a high proportion of vegetables, soy products, nuts, fruits, coarse grains, potatoes and dairy products. It has a high degree of overlap with the traditional Mediterranean dietary pattern, so we named it the “Mediterranean-style dietary pattern”. However, it should be noted that this dietary pattern does not emphasise the intake of olive oil and red wine as in traditional Mediterranean cuisine. We found that higher adherence to this dietary pattern is associated with a lower prevalence of MCI. This is consistent with the longitudinal research results of Lotan et al., who found that among older adults with type 2 diabetes, adherence to the Mediterranean diet was associated with better overall cognitive and executive functions.21
We also found that high adherence to the “Western-style dietary pattern” with a higher proportion of animal foods (red meat, processed meat, eggs and dairy products) and the “High meat and low vegetable pattern” (high consumption of red meat, poultry, processed meat and nuts, low consumption of vegetables and soy products) are associated with a higher prevalence of MCI. Both dietary patterns emphasise a high intake of red meat and processed meat. The Weinstein et al. study revealed the destructive effects of a high intake of processed meat on executive function and overall cognition in T2DM patients.22 In addition, a meta-analysis by Quan et al. showed a significant association between total meat consumption and the risk of degenerative cognitive impairment.23 A randomised controlled trial of a dietary intervention by Kaplan et al. showed a reduction in red meat and processed meat consumption has a potential neuroprotective effect on age-related brain atrophy.24 We did not find any correlation between low-soy product and low-egg patterns and MCI. Therefore, adhering to a “Mediterranean-style dietary pattern” with a high proportion of plant-based foods and reducing the intake of red and processed meat seems to help prevent cognitive impairment in patients with T2DM.
The DII is a new dietary tool. A longitudinal study from the Hellenic Longitudinal Investigation of Ageing and Diet in Greece showed a 21% increase in the risk of developing dementia for each unit increase in DII score (HR=1.21 [95%CI: 1.03–1.42]; p=0.023).25 However, Zabetian et al. reported that inflammatory diets were not associated with brain structure or overall cognition.26 However, we found that a higher DII means a greater potential for a pro-inflammatory diet to be significantly associated with MCI in patients with diabetes, considering that diabetes may lead to greater heterogeneity in dietary intake compared to other diseases. Therefore, more detailed studies are needed in the future to confirm these results. Our results also suggest that the modulatory effect of dietary patterns on MCI is partially derived from DII. This is related to the type of food contained in the dietary pattern. For example, legumes, vegetables, fruits and whole grains are considered anti-inflammatory diets, while meat, processed foods and carbohydrates are considered pro-inflammatory diets.27–29 Therefore, the impact of dietary patterns on cognitive function may partly come from their impact on inflammation.
Cognitive impairment is influenced by various pathological and physiological mechanisms. For example, high blood sugar can lead to an increase in polyol levels in cerebrospinal fluid and may promote cognitive impairment through the formation of advanced glycation end products and non-enzymatic glycation of myelin sheaths.30,31
Inflammation can cause damage to synaptic proteins and synaptic ultrastructure in the hippocampus, potentially leading to a decline in cognitive function.32 Insulin resistance may lead to impaired mitochondrial function, neuronal apoptosis and induction of tau protein phosphorylation, affecting cognitive function.33 The relationship between one food and another, as well as between food and the human body, is very complex. Inflammation, metabolism, oxidative stress, gut microbiota or the protective effects of dietary nutrients on nerves and blood vessels may all act as a bridge between dietary patterns and MCI. Therefore, we cannot simply attribute the impact of dietary patterns on cognitive function to a specific nutrient or mechanism. The complex relationship between diet and MCI still needs further exploration.
The diagnosis of MCI in this study relied on the MoCA scale. However, lower educational attainment may lead to false positive results. Therefore a 1-point adjustment is recommended for subjects with ≤12 years of formal education. In addition, MoCA may be influenced by factors other than education, such as those related to subjective cognition or depression.34 However, the MoCA is still considered to have higher sensitivity and specificity than other brief mental status examinations. In conclusion, caution needs to be exercised when demographically correcting the MoCA in different populations. Moreover, differences in educational environment, socio-economic status, age, growth and gender may all lead to differences in dietary patterns. For example, people with higher socio-economic status may have higher adherence to Mediterranean dietary patterns.35 Women's intake of red meat may be lower than men's.36 Thus, these elements have the potential to be confounding factors.
Of course, there are limitations to this study. Firstly, we did not select biomarkers of MCI in the RRR, but rather the nutrients of interest. Secondly, it has to be acknowledged that the absorption and metabolism rates of food and nutrients vary among individuals, and the intake we calculated does not reflect the most realistic nutritional status of individuals. In addition, our research is limited to the Chinese population. It is not yet clear whether the results can be extended to other races, and further research using a representative cohort is required. Furthermore, the diagnosis of MCI in this study was based on cognitive tests only, and thus may not capture the complexity of cognitive functioning. Lastly, in this study, we did not further evaluate the causes of cognitive impairment in patients, which could include neurodegenerative disorders such as Alzheimer's disease or other factors like vascular damage.
ConclusionsIn patients with T2DM, greater adherence to the “Mediterranean-style dietary pattern” is associated with a lower probability of having MCI. Meanwhile, excessive consumption of meat, especially red meat and processed meat, combined with a lack of vegetable intake, is associated with a higher probability of having MCI. Greater adherence to the “Western-style dietary pattern” is associated with a higher probability of having MCI. A pro-inflammatory diet is also associated with a higher probability of having MCI, and DII partially mediates the impact of dietary patterns on MCI.
Our aim with this study is to provide suggestions and references for strategies to prevent cognitive impairment in patients with diabetes through diet.
Authors’ contributionShengdan Pu and Yuxin Xu performed the main data analysis and wrote the draft of the manuscript. Xinyuan Gao supervised the entirety of the research and is responsible for the integrity of the data analysis. Xuewei Tong and Yitong Zhang were responsible for data collection. Xiaotong Sun was responsible for designing the study. All authors contributed to the article and approved the submitted version.
FundingThis work was supported by the Postgraduate Research & Practice Innovation Program of Harbin Medical University[grant number YJSCX2023-189HYD, China].
Conflicts of interestThe authors report no conflicts of interest in this work.