


This study provides new evidence about the effects of subsidies for research and development (R&D) on technical efficiency in a sample of Spanish manufacturers during the period 1993-2002. The results suggest two issues to consider. Firstly, the beneficiary firms of subsidies are less efficient; to avoid this effect, this result should serve to as a guide to authorities, with the aim of improving the allocation of these resources. Secondly, less efficient firms are those that are unable to obtain resources to fund R&D or obtain credit and are therefore those that apply for subsidies. In light of these results, the subsidies received by Spanish manufacturing firms may be insufficient or may fail to arrive when required, hampering the fulfilment of their objectives.
Este trabajo aporta nuevas evidencias sobre los efectos que las subvenciones a la investigación y desarrollo (I+D) tienen en la eficiencia técnica, para una muestra de empresas españolas en el período 1993-2002. Los resultados obtenidos sugieren dos cuestiones a tener en cuenta. En primer lugar, las empresas beneficiarias de las subvenciones son menos eficientes; este resultado debería servir como orientación a los organismos que conceden estas ayudas para tratar de mejorar la asignación de estos recursos al objeto de evitar este efecto y mejorar. En segundo lugar, las empresas menos eficientes son las que no tienen capacidad de obtener recursos propios para financiar la I+D u obtener un crédito, de modo que son las que solicitan las subvenciones. Teniendo en cuenta estos resultados es probable que las subvenciones recibidas por las empresas manufactureras españolas sean insuficientes o no lleguen en el momento oportuno, lo cual impide que cumplan con sus objetivos.
The development of new products is an essential part of many firms’ strategies, and as Feldman and Kelley (2003) and Huang et al. (2008) signal, in some cases certain private firms may not pursue technology research and development (R&D) projects because, first, R&D scientific and technical frontiers are risky and the chances of failure are high; second, an individual firm may not have the capabilities required to develop the technology; and, third, private incentives may not be sufficient to induce a firm to undertake the project in the face of difficulties in appropriating the resulting benefits.
Firms’ incentives to conduct R&D may, however, be smaller than the socially optimal incentives. A public subsidy for R&D may then be an effective tool for bringing private incentives to conduct R& D in line with social incentives. The role of government intervention in economic and industrial development has been a constant topic of discussion and concern in the literature and in different social arenas. As Heijs (2003) mentions, since industrialisation began, non-interventionism, or laissez faire, has received broad support (Smith, 1776). On the other hand, an active role for the public institutions can ensure a fast process of industrialisation. Economic arguments justifying public intervention and related to the neo-classical perspective focus largely on market failures, linked to the public nature of the result of the R&D, the presence of spillovers, and the costs or risks inherent to the innovation process that are presupposed by a suboptimal level of investment among firms in market economies. This line includes modern growth theories (Romer, 1986; Romer, 1990; Lucas, 1988; Grossman and Helpman, 1991), as well as the evolutionary perspective (Nelson and Winter, 1982; Hall, 1994; Freeman, 1994; among others). As indicated in Marra (2006), although an abundant empirical literature has analysed the effectiveness of public policies on firms’ innovative activity, the results have been inconclusive. Surveys of the empirical literature that analyze the impact of public aids to the firms’ R&D investment are the papers of David et al. (2000), Klette et al. (2000) and Toole and Turvey (2009) and with a special attention to the Spanish case is the paper of Busom (2000), Blanes and Busom (2004), González et al. (2005), Pereiras and Huergo (2006).
While there is an extensive body of empirical research on the effects that R&D subsidies have on a firm's R&D effort, growth or patenting activity, there is limited evidence, to the best of our knowledge, on the subsidy allocation process and its implications for efficiency. The current work contributes to this empirical literature, analysing whether public support for private research and innovations activities1 affect firms’ technical efficiency in a sample of innovative Spanish manufacturers during the period 1993-2002. For this purpose, we want to explain firm differences in efficiency, following the methodology proposed by Lieberman and Dhawan (2005), which try to connect the resource-based view of the firm (RBV) and the frontier analysis, specifically, we apply Battese and Coelli's model (1995). This frontier model not only allows us to estimate the firm's technical inefficiency but, simultaneously, to identify the variables that are statistically related to inefficiency, that is, the determinants of the inefficiency reached and, in our paper, the R&D subsidies received by the firms. Such applications in the Spanish case has been made linking efficiency and export (Delgado et al., 2002), efficiency and labour force competition (Díaz and Sánchez, 2004), efficiency and organisational factors (Díaz and Sánchez, 2008).
The work is structured as follows. Section 2 presents a framework of the effects of subsidies for R&D on firms’ efficiency. Section 3 presents a descriptive analysis of the data, as well as the variables used in the research. In Section 4, we explain the methodology. The fifth section reports the results of the production function and an analysis of the sectoral efficiency using kernel distributions, stressing the comparative analysis of the firms’ technical efficiency with respect to their receipt or otherwise of subsidies. Finally, Section 6 presents the final conclusions of the work and possible future extensions.
2Effects of subsidies for R&D on firms’ efficiency frameworkGovernment subsidies for R&D have been offered for several decades in most industrialized countries, either in the form of indirect support such as tax incentives or by direct interventions for specific initiatives. The government rationalizes that such support will result in competitive benefits for the firm, which will spill over into the economy and ultimately increase industry competitiveness, and formulates several evaluation approaches to assess the performances of the R&D support (Luukkonen, 1998).
Numerous studies justify government intervention in technological innovation in response to underinvestment of R&D in private firms for market incentives (Sanz-Menéndez, 1995; Heijs, 2003). This fact is historically linked to the conceptual framework of market failure, meaning that the government has an interest in stimulating private R&D because such stimulation can generate social benefits ultimately that go beyond the simple underinvestment hypothesis (Luukkonen, 1998). R&D subsidies are included within the external factors that influence innovation. These factors in turn are framed within the legal and regulatory framework, implemented by public authorities, directly or indirectly governing these activities. In this sense, subsidies, like the rest of factors which include the use of industrial property, staffing, research centers and universities and tax may not have received the same attention in the literature compared with internal factors which may arise for the effects of changing a firm's strategy, encouraging it to enter a new market, to engage in more collaboration, or to improve their management (Luukkonen, 2000; Georghiou et al., 2004; Hsu et al., 2009). The arguments of the authors who have analyzed the influence of subsidies for R&D have been based in the allocation of financial resources, and the results are not conclusive. While authors such as Busom (1991) and Fernández et al. (1995) found a positive relationship between subsidies and innovation, Griliches (1986) and Lichtenberg (1987) found a negative relationship.
In order to improve the evaluation of public R&D support programmes, the OECD Working Party on Innovation and Technology Policy launched a project to measure the so-called behavioural additionality effects including 12 evaluation reports in 2006 (OECD, 2006). In this paper the output additionality is defined as the firms’ technical efficiency2, following the methodology proposed by Lieberman and Dhawan (2005), which try to connect the resource-based view of the firm (RBV) and the frontier analysis. The RBV regards the firm as a heterogeneous bundle of resources plus organizational capabilities that may enable the firm to deploy resources more efficiently than rivals (e.g., Barney, 1986; Rumelt, 1987; Dierickx and Cool, 1989; Peteraf, 1993). The perspective of the RBV resemble the logic of the frontier production function model because, as Amit and Schoemaker (1993) define, the resources are stocks of available factors that are owned or controlled by the firm and capabilities refer to a firm's capacity to deploy resources, in our case the subsidies received by those firms carrying out R&D activities.
3Data and descriptive analysisThe data used in this work come from the Survey on Business Strategies (ESEE), built by the SEPI Foundation (Fundación SEPI) during the period 1993-2002. The ESEE has been built combining criteria of exhaustiveness and random sampling in order to maintain the representativeness of the industrial firms of between 10 and 200 employees, by size interval and sector of activity. With regard to the firms with over 200 employees, there is a higher level of representativeness3. The sample consisted of an unbalanced sample of 5,349 observations, with which we estimated the econometric model described in the following section and we included both subsidised and non-subsidised firms.
Figure 1 shows the distribution of the firms engaged in R&D activities and of the firms receiving public R&D subsidies, classified by size into two subsamples: small and medium firms (SMEs) (≤200 workers) and large firms (>200 workers) in the period 1993-2002.
 1993-2002.")
As can be seen, there are important differences in the proportion of firms engaged in R&D activities during this period in function of the size. On average, the findings confirm that the large firms (>200 workers) have a greater proportion of innovative firms, while the smaller firms (≤200 workers) have far fewer, in no case exceeding 29%. This result suggests that R&D activities are carried out mainly by firms with a large size. On the other hand, certain variability is evident in the proportion of firms engaged in R&D activities in each size group over time. With regard to the proportion of firms receiving public subsidies, only a small percentage of firms under 200 workers receive assistance in this period. The proportion is higher in the firms over 200 workers, reaching around 25%. There is consequently a positive relation between firm size and proportion of firms receiving public financing. This type of financing comes from three different sources: the regional administration, the central government and European funds.
Figure 2 summarises the relevant variables of this work – innovation effort, measured by R&D spending as a proportion of output; and subsidies as a proportion of private R&D spending – differentiating between subsidised firms and all innovative firms, during the period 1993-2002.

As can be seen, for the manufacturing firms analysed the R&D effort of the firms receiving subsidies always exceeds that of innovative firms as a whole, which suggests that receiving subsidies has a positive effect on private R&D effort. With regard to the average subsidy received as a proportion of spending, subsidies represent around 9.05% of total R&D spending for all innovative firms and 32.01% for the firms receiving public financing. Thus, subsidies clearly represent an important part of R&D spending in innovative firms, so in principle they cannot be regarded as a marginal source of financing for firms’ R&D.
4Methodology and model specificationIn this paper, we use the stochastic frontier production function, specifically, a panel data version of Battese and Coelli (1995), in which the technical inefficiency is estimated from the stochastic frontier and simultaneously explained by a set of variables. This approach avoids the inconsistency problems of the two-stage approach used in other empirical works when analysing the inefficiency determinants4.
The Battese and Coelli (1995) model can be expressed as:
where Yit denotes (the logarithm of) the production of the i-th firm in the t-th time period; Xk represents the k-th logs of the input quantities; βk stands for the output elasticity with respect to the k-th input; the Vit are random variables which are assumed to be independent and identically distributed N(0,σV2), and distributed independently of the Uit which are non-negative random variables which are assumed to account for technical inefficiency in production and are assumed to be independently distributed as truncations at zero of the N(mit,σU2) distribution. The mean of this distribution is:where zit is a p×1 vector of variables which may influence the efficiency of a firm; and δ is an 1×p vector of parameters to be estimated.

The production function coefficients (β) and the inefficiency model parameters (δ) are estimated by maximum likelihood together with the parameterisation from Battese and Corra (1977), replacing σV2 and σU2 with σ2=σV2+σU2 and γ=σU2/(σV2+σU2).
Given that technical efficiency is the ratio of observed production over the maximum technical output obtainable for a firm (when there is no inefficiency), the efficiency (TE) of firm i in year t could be written as:
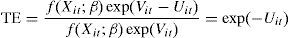
The efficiency scores obtained from expression (3) have a value of one when the firm is efficient and less than one otherwise.
This work assumes the Cobb-Douglas production function, with non-neutral technological progress5. In this way it is possible to observe the frontier shifting after controlling for the other factors considered. In particular, the function to estimate has the following form:
where the technical inefficiency effects are assumed to be defined by:where, considering the variables in logarithms, K is the capital variable, E is employment, C the intermediate spending, and G the variable that measures spending in R&D. This variable has been lagged one productive period, which is shorter than the period used in studies for more technologically-developed countries. This generally ranges from 1.7 to 2.6 years, depending on the sector and type of activity (Rodríguez, 1989)6. Sec denotes a vector of dummies capturing the sectorial effect. Finally, this stochastic frontier model includes year of observation (t) in such a way that non-neutral technical change is specified (see, for example, Battese and Broca, 1997). However, neutral technical change is present if the coefficients of the interactions between year of observation and the input variables are zero. With regard to the inefficiency term, S represents the subsidies received by those firms carrying out R&D activities, while S2 is the quadratic component of the subsidy and t the temporal trend. The coefficient t in equation (5) measures the change in inefficiency over time7. Consequently, if δ3 is negative, “catch-up” technical change (movement towards the frontier) is observed, and – δ3 can be indicated as the coefficient of technological change in Uit.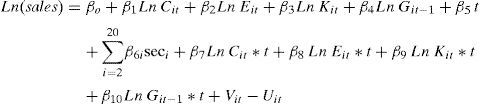

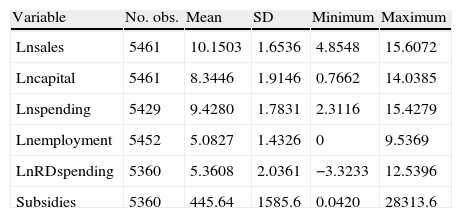
In particular, to measure the output, the production of goods and services, we consider the sum of the sales and the variation in sales inventory for each of the firms analysed. The input variables are the intermediate spending carried out in the production process. Intermediate spending is defined as the sum of purchases and external services, plus the variation in purchase inventory. These variables are converted into constant euros using deflators from the Spanish National Statistics Institute (INE). The variable capital for the period 1993-2002 is represented by the capital stock, which is approximated using the value of net capital at replacement cost less the corresponding accrued depreciation8. Spending on research and development is the sum of the internal and external spending, with this latter figure a consequence of any sub-contracting carried out by the firm. Table 1 shows the sample descriptive statistics of the variables used to estimate the model of R&D investment during the period 1993-2002.
Descriptive statistics of variables of production frontier model, 1993-2002.
| Variable | No. obs. | Mean | SD | Minimum | Maximum |
| Lnsales | 5461 | 10.1503 | 1.6536 | 4.8548 | 15.6072 |
| Lncapital | 5461 | 8.3446 | 1.9146 | 0.7662 | 14.0385 |
| Lnspending | 5429 | 9.4280 | 1.7831 | 2.3116 | 15.4279 |
| Lnemployment | 5452 | 5.0827 | 1.4326 | 0 | 9.5369 |
| LnRDspending | 5360 | 5.3608 | 2.0361 | −3.3233 | 12.5396 |
| Subsidies | 5360 | 445.64 | 1585.6 | 0.0420 | 28313.6 |
Source: Own elaboration, from ESEE data.
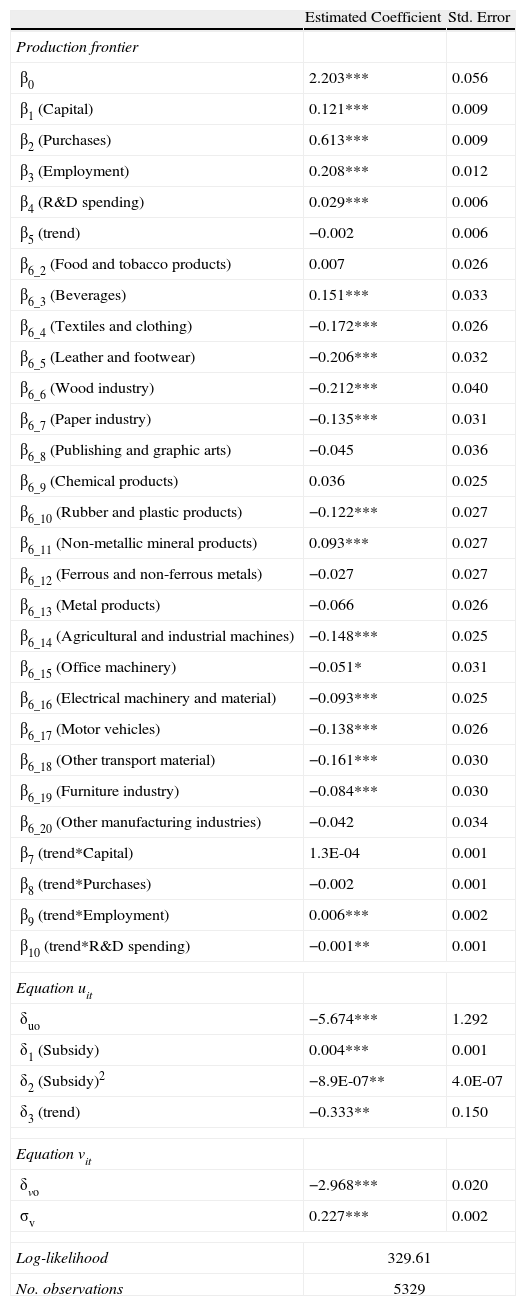
Table 2 shows the results of the model estimated simultaneously according to maximum likelihood (equations (4) and (5)). The data used, as mentioned above, are an unbalanced panel in the period 1993-2002 from the ESEE survey on business strategies.
Results of estimation.
| Estimated Coefficient | Std. Error | |
| Production frontier | ||
| β0 | 2.203*** | 0.056 |
| β1 (Capital) | 0.121*** | 0.009 |
| β2 (Purchases) | 0.613*** | 0.009 |
| β3 (Employment) | 0.208*** | 0.012 |
| β4 (R&D spending) | 0.029*** | 0.006 |
| β5 (trend) | −0.002 | 0.006 |
| β6_2 (Food and tobacco products) | 0.007 | 0.026 |
| β6_3 (Beverages) | 0.151*** | 0.033 |
| β6_4 (Textiles and clothing) | −0.172*** | 0.026 |
| β6_5 (Leather and footwear) | −0.206*** | 0.032 |
| β6_6 (Wood industry) | −0.212*** | 0.040 |
| β6_7 (Paper industry) | −0.135*** | 0.031 |
| β6_8 (Publishing and graphic arts) | −0.045 | 0.036 |
| β6_9 (Chemical products) | 0.036 | 0.025 |
| β6_10 (Rubber and plastic products) | −0.122*** | 0.027 |
| β6_11 (Non-metallic mineral products) | 0.093*** | 0.027 |
| β6_12 (Ferrous and non-ferrous metals) | −0.027 | 0.027 |
| β6_13 (Metal products) | −0.066 | 0.026 |
| β6_14 (Agricultural and industrial machines) | −0.148*** | 0.025 |
| β6_15 (Office machinery) | −0.051* | 0.031 |
| β6_16 (Electrical machinery and material) | −0.093*** | 0.025 |
| β6_17 (Motor vehicles) | −0.138*** | 0.026 |
| β6_18 (Other transport material) | −0.161*** | 0.030 |
| β6_19 (Furniture industry) | −0.084*** | 0.030 |
| β6_20 (Other manufacturing industries) | −0.042 | 0.034 |
| β7 (trend*Capital) | 1.3E-04 | 0.001 |
| β8 (trend*Purchases) | −0.002 | 0.001 |
| β9 (trend*Employment) | 0.006*** | 0.002 |
| β10 (trend*R&D spending) | −0.001** | 0.001 |
| Equation uit | ||
| δuo | −5.674*** | 1.292 |
| δ1 (Subsidy) | 0.004*** | 0.001 |
| δ2 (Subsidy)2 | −8.9E-07** | 4.0E-07 |
| δ3 (trend) | −0.333** | 0.150 |
| Equation vit | ||
| δvo | −2.968*** | 0.020 |
| σv | 0.227*** | 0.002 |
| Log-likelihood | 329.61 | |
| No. observations | 5329 | |
β6_1=sector omitted: Meat industry; Significance levels=***1%, **5%, *10%.
As was mentioned in the previous section, the results shown in Table 2 assume a Cobb-Douglas stochastic production function, which has found ample acceptance in the literature9. The chi-square is statistically significant at the 1% level (χ282=261910.85).
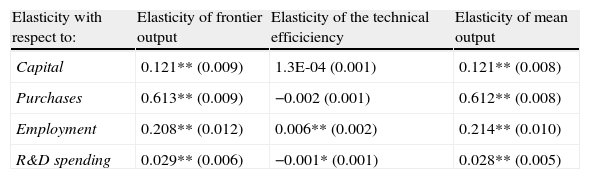
The elasticity of mean output with respect to the k-th input variable, for example employment, in equation (4) has two components: β2+β8*t. The first component is the traditional elasticity of the output with respect to the input, this is referred to as the elasticity of frontier output, and the second component of the elasticity is the non-neutral factor which is referred to as the elasticity of the technical efficient (this component is zero for neutral stochastic frontier models). The elasticities are estimated in Table 3. The elasticities of mean output are all positive and statistically significant at the 1% level and the elasticities of technical efficiency are only substantial components of the elasticities of the mean output for employment and R&D spending, this last input with a negative sign. The non-neutral technical change across all inputs is an adequate hypothesis for this model because the hypothesis of neutral technical change: H0: β7= β8= β9= β10=0 is χ2(4) = 24.82 is rejected and, also, H0: β5=β7= β8= β9= β10=0 is χ2(5) = 29.01 is rejected. On the other hand, we reject the hypothesis of constant returns to scale (χ2(1)=29.43).
Elasticities of mean output with respect to inputs.
| Elasticity with respect to: | Elasticity of frontier output | Elasticity of the technical efficiciency | Elasticity of mean output |
| Capital | 0.121** (0.009) | 1.3E-04 (0.001) | 0.121** (0.008) |
| Purchases | 0.613** (0.009) | −0.002 (0.001) | 0.612** (0.008) |
| Employment | 0.208** (0.012) | 0.006** (0.002) | 0.214** (0.010) |
| R&D spending | 0.029** (0.006) | −0.001* (0.001) | 0.028** (0.005) |
Note: In brackets the standard error. Significance levels=**1%, *5%.
One of the most important stylised facts refers to the results obtained in the part of the error term where the explanatory variable of inefficiency, i.e., the R&D subsidies received, shows a curvilinear behaviour (in the form of an inverted U), since its coefficients δ1 and δ2 are positive and negative, respectively, and statistically significant at the 1% and 5% levels. This finding is important for economic policy in Spain, since it allows us to determine the effect of subsidies on the management of resources in firms, and to what extent these incentives are useful. The result obtained indicates a priori that the size of the subsidies relates positively to inefficiency up to a maximum point, from where inefficiency declines as the subsidy grows further. In other words, the subsidies, which are meant to support innovation among Spanish manufacturers, may not be benefiting some of the firms.
We now look more closely at the distribution of the firms receiving subsidies and its relation with the technical inefficiency, by examining the curvilinear model from the coefficients estimated in the model. The function is as follows:
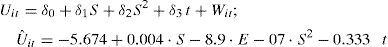
Figure 3 illustrates the relation between inefficiency and subsidies. As can be seen, although the relation is curvilinear – the inefficiency dropping as the level of subsidies rises – the mean subsidy is at approximately 445,000 euros, which corresponds to almost 80% of the firms under analysis. Only 2.4% of the observations are located in the downward part of the inefficiency curve. This shows that the important part of the inefficiency curve is where the slope is rising. Subsidies do not incentives the sample firms under analysis to improve their efficiency.
5.2Analysis by sector
In this section we analyse the intra-sectoral efficiency for the 20 sectors of activity in Spanish manufacturing industry. Figure 4 shows the mean efficiency results obtained for each of the CNAE classification sectors the ESEE survey uses to divide the firms for every year in the period 1993-2002. The average efficiency of the Spanish manufacturing firms carrying out research and development activities ranges from 0.96 to 0.99%. This means that on average the firms are producing around 96-99% of what they could produce given the quantity of resources used. In other words, the firms could raise their production by 4% in the worst case if they were fully efficient10.

Analysing the mean efficiency by sector, some observations stand out:
- a)
No significant differences in mean efficiency levels are appreciated between the sectors, since differences do not exceed 3 or 4%.
- b)
Despite the similar average sectoral efficiencies, there are intra-sectoral inequalities in the evolution of the mean efficiency over time. For example, the mean efficiency of the sector office machinery shows considerable swings, rising and falling abruptly over time.
- c)
In general terms the mean efficiency of the sectors tends to converge on high efficiency levels.
In order to observe the relation between firm efficiency and subsidies received or not received, we built a classification variable as follows (Mañez et al., 2005)11:
- a)
Continually subsidised firms: firms receiving subsidies every year in the period under analysis. Such firms represent 6.57% of the sample firms.
- b)
Incoming firms: firms that do not receive a subsidy at first, begin to receive one at some point, and continue to do so until the end of the period. These firms represent 7.96% of the sample firms.
- c)
Outgoing firms: firms that receive a subsidy at first, stop doing so at some point, and remain unsubsidised until the end of the period. They represent 6.92% of the sample firms.
- d)
Alternating firms: firms that change status at least twice in the period under analysis, i.e., they start to receive a subsidy and stop receiving a subsidy at some point in the period. They represent 32.13% of the sample firms.
- e)
Non-subsidised firms: firms not receiving any type of subsidy at any time in the period of analysis. They represent 46.43% of the sample firms.
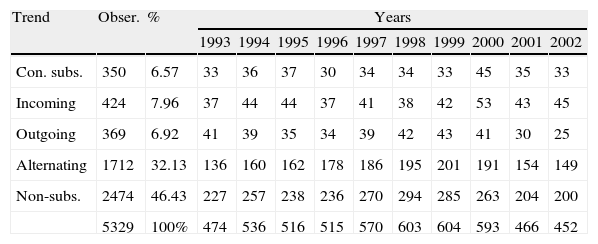
Table 4 shows the years for which the firms’ subsidy behaviour is observed, using the classification variable mentioned above.
Firms’ subsidy behaviour.
| Trend | Obser. | % | Years | |||||||||
| 1993 | 1994 | 1995 | 1996 | 1997 | 1998 | 1999 | 2000 | 2001 | 2002 | |||
| Con. subs. | 350 | 6.57 | 33 | 36 | 37 | 30 | 34 | 34 | 33 | 45 | 35 | 33 |
| Incoming | 424 | 7.96 | 37 | 44 | 44 | 37 | 41 | 38 | 42 | 53 | 43 | 45 |
| Outgoing | 369 | 6.92 | 41 | 39 | 35 | 34 | 39 | 42 | 43 | 41 | 30 | 25 |
| Alternating | 1712 | 32.13 | 136 | 160 | 162 | 178 | 186 | 195 | 201 | 191 | 154 | 149 |
| Non-subs. | 2474 | 46.43 | 227 | 257 | 238 | 236 | 270 | 294 | 285 | 263 | 204 | 200 |
| 5329 | 100% | 474 | 536 | 516 | 515 | 570 | 603 | 604 | 593 | 466 | 452 | |
Source: Own elaboration, from ESEE data.
The great majority of the firms analysed are found in the two categories non-subsidised and alternating firms, with 46.43% and 32.13%, respectively, while the other groups have far fewer members: continually subsidised firms (6.57%), incoming firms (7.96%) and outgoing firms (6.92%).
Figure 5 shows the evolution of the mean efficiency values dividing the sample according to this classification with respect to the subsidies received or otherwise. As can be seen, the non-subsidised firms differ notably12 in their mean values from the other types of firm throughout the whole period of analysis, particularly compared to the continually subsidised (or stable) firms.

The incoming, outgoing and alternating firms behave dynamically throughout the period, although the outgoing firms tend to converge with the non-subsidised firms. The analysis carried out up to now has proved very instructive about the relation of interest here between efficiency and R&D subsidies, but the weight of the analysis refers to just one moment in the distribution, namely its mean value. For this reason, we also need to analyse the efficiency distribution by means of density functions, carrying out a non-parametric approximation by using the kernel method, and in particular estimating a Gaussian kernel with optimal bandwidth13. This type of approach does not impose, a priori, any functional form on the distribution. As is commonly said, non-parametric estimation “lets the data speak for themselves”. The purpose of density estimations is to determine whether convergence or divergence has occurred in the period of analysis. The former would be evident if the probabilistic mass tended to concentrate around certain values. For example, if this point of concentration was greater than 0.9, it would be indicating a convergence process towards values close to the frontier. In contrast, a divergence process would be reflected in a shifting of the probabilistic mass within the distribution range of the distribution.
As shown in Figure 5 for all types of firms analysed, we can observe an improvement in efficiency due to distributions move to the frontier (Efficiency=1) in selected years (horizontal displacement). If we compare the vertical displacement of the distributions from continually subsidised firms to firms non-subsidised, we can observe the improvement (or closer to the frontier) of the distributions is intensified, with non-subsidised firms the ones that get the greatest improvement.
Figure 6 shows the density functions of the efficiency for the years 1993, 1996, 1999 and 2002. The results obtained reveal the changes that have taken place in the external shape of the distribution for all the types of subsidy behaviour, changes which confirm convergence processes towards upper efficiency levels. In this respect, the external shape of the efficiency distribution appears to be maintained in a single mode, but one that is shifting over time.

We should stress that in some subsamples of this classification the number of observations is low, and so the distribution appears incomplete in such cases. As was mentioned, examining Figure 6 from the top to the bottom graph, the distributions can be seen to shift towards higher values, particularly for the non-subsidised firms compared to the continually subsidised firms. Meanwhile, examining each graph from left to right, there is a greater spread in the distributions in the case of the firms continually receiving subsidies (stable firms), or those that start receiving them and continue to be subsidised (incoming firms), compared to the other groups, particularly the unsubsidised firms.
In short, whether from the perspective of the mean efficiency values or applying kernel distributions to observe the whole distribution, the analyses indicate that the non-subsidised firms are more efficient than the firms that continually receive subsidies. Even the firms that stop receiving subsidies appear to behave better.
6Conclusions and final recommendationsThis work provides new evidence about the effects of subsidies for research and development on the technical efficiency of a sample of Spanish manufacturing firms from the ESEE survey on business strategies during the period 1993-2002. We have estimated the Cobb-Douglas stochastic production frontier following Battese and Coelli's (1995) model to analyse an unbalanced panel of innovative firms, introducing the subsidies received by the firms as explanatory variable of their inefficiency.
Although subsidies form only a part of the assistance obtained by Spanish manufacturers (they also receive tax relief, soft loans, etc.), they are a very important part of such aid. In this respect, one of the conclusions of this work relates to the curvilinear relation between inefficiency and subsidies. In other words, as the size of the subsidy increases, so does the inefficiency up to a certain point, after which the inefficiency begins to decline. Despite this behaviour, more than 85% of the sample firms are in the growth part of this relation, and 78% are in the part with the steepest slope. This result suggests two important question, firstly, the finding that firms receiving subsidies are less efficient, this outcome should serve as guidance to authorities to try to improve the allocation of these resources in order to avoid this effect, and secondly, less efficient firms are those that are unable to obtain resources to fund R&D or get a credit, so that they are the ones who apply for subsidies. Taking into account these facts, policymakers should be extremely cautious about using subsidies to incentives R&D activities among Spanish manufacturing firms, because it is possible that the subsidies received by them are insufficient or do not arrive when they are needed, making difficult to fulfill their objectives.
On the other hand, the results of the classification of the firms in function of their receipt of subsidies for research and development (continually subsidised, incoming, outgoing, alternating and non-subsidised firms) with respect to the efficiency show that during the period under analysis the non-subsidised firms are more efficient than the firms receiving subsidies every year in the period. In addition, a full analysis of the distribution by means of kernel distributions allows us to confirm the relatively stronger convergence towards higher efficiency levels over time among non-subsidised firms.
The analysis of the firms’ efficiency at the sectoral level shows that the mean efficiency of Spanish industrial firms ranges from 94% to 99%. This finding indicates that on average, Spanish firms could produce at higher levels. These results are quite different to those of other works using data from the same survey. The differences could be due to although the current study uses a Cobb-Douglas model, like Martín and Suárez (2000), Gumbau (1998), and Gumbau and Maudos (2002), it applies an estimation model in one single stage, introducing the variable subsidies as determinant of the efficiency. Nevertheless, the efficiency measure refers to a judgment about the relation between the resources used (inputs) and a measure of the results obtained (output), so that the idea of opportunity costs underlies both concepts (Bosch et al., 1998).
The absence of other work in this line of research relating efficiency and subsidies, at the national or international levels, has prevented us from comparing the results obtained here in this specific context. Possible extensions of this work could focus on comparing the results obtained here with those of firms from other countries. The findings of this work could also suggest some interesting reflections, for example: it appears to be inefficient to continue subsidising Spanish manufacturing firms as is being done at present. This may have something to do with the size of the subsidies, the time it takes for the subsidies to reach the firms, or the process of selecting which firms to subsidise. In this respect, larger firms probably obtain subsidies for projects that they could have undertaken without such assistance, while smaller firms may not be obtaining subsidies, making it impossible for them to undertake larger-scale projects.
FundingThe author recognises the support received from the Regional Government of Castille-La Mancha (Spain).
The authors are grateful to Vicente Salas, Sergio Perelman, the editor and the associate editor, and two anonymous referees for comments and suggestions that have greatly improved the article. A preliminar version was presented in XVI Congreso Nacional de ACEDE. All remaining errors or failings are the sole responsibility of the authors.
See Cotec (2000) for a survey of the relations between firms which do innovations and the Administrations in Spain.
Other measures of output additionality can be found in Georghiou et al. (2004).
A description of this database can be seen in Fariñas and Jaumandreu (1999).
In a two-stage procedure, firstly, a stochastic frontier production function is estimated and the inefficiency is obtained under the assumption of independently and identically distributed inefficiency effects. But in the second step inefficiency effects are assumed to be a function of some variables, which contradicts the assumption of identically distributed inefficiency effects.
The Cobb-Douglas production function was chosen because of its simplicity and validity in different works (Zellner et al., 1966). Nevertheless, we also tried to use the trans-log function, but the likelihood function had problems of convergence.
Nevertheless, we estimated different models lagging the variable R&D spending by more than one year. The results barely changed.
We try to introduce a non-neutral measure of change in inefficiency over time but it has not significant impact on the inefficiency model.
The formula of permanent inventory is KNRt= It+KNRt-1(1-δt) Pt/Pt-1, where KNR is the net capital at replacement cost, It the investment in capital assets, δt the depreciation rate of the capital assets, and Pt the price indexes for capital assets published by the National Statistics Institute (INE).
Using ESEE data, authors such as Gumbau (1998) and Martín and Suarez (2000) use this same specification.
In Gumbau's (1998) comparative study for the period 1991-1994, these values are lower, ranging from 76% to 83%. In the current study, the model follows Battese and Coelli's (1995) approach, the time period is much longer and the sample of firms is different, since the firms carry out innovation and development.
These authors use the same criterion applied to firms carrying out R&D, the idea being to avoid sample selection bias.
A comparison of means was conducted through the Kruskal-Wallis test, which was found to be statistically significant at the 5% level. This type of test was chosen rather than an ANOVA due to the non-normality of the sample, it being truncated at value 1.
A kernel can be regarded as a smoothed version of a histogram. The bandwidth of the kernel measures the degree of smoothness employed in estimating the density function. The value of the smoothing parameter is determined following Silverman's (1986) approach.