


The Finnish Diabetes Risk Score (FINDRISC) is a tool to predict 10-year risk of type 2 diabetes mellitus (T2DM), and visceral adiposity is associated with higher cardio-metabolic risk. The objective of the study was to assess the relationship of epicardial adipose tissue (EAT) thickness with T2DM risk according to the FINDRISC tool.
MethodsThe study was conducted in Ciudad Bolívar, Venezuela, and included 55 subjects of whom 37 (67.3%) were women and 18 (32.7%) men with ages between 18 and 75 years. A record was made of weight, height, body mass index (BMI), waist circumference (WC), fasting glucose, baseline insulin, plasma lipids, Homeostasis Model Assessment-Insulin Resistance (HOMA-IR), and EAT thickness. The FINDRISC tool, with WC cut-off points modified for Latin America (LA-FINDRISC) was used.
ResultsBMI, WC, plasma insulin concentration, HOMA-IR index, and EAT thickness were higher (P<0.0001) in the high-risk group compared to subjects in the low-moderate risk group according to the LA-FINDRISC. LA-FINDRISC was positively correlated with BMI (r=0.513; P=0.0001), WC (r=0.524; P=0.0001), fasting blood glucose (r=0.396; P=0.003); baseline plasma insulin (r=0.483; P=0.0001); HOMA-IR index (r=0.545; P=.0.0001); and EAT thickness (r=0.702; P=0.0001). The multivariate regression analysis showed that fasting blood glucose (P=0.023) and EAT thickness (P=0.007) remained independently associated with high T2DM risk.
ConclusionsLA-FINDRISC was associated with EAT thickness and insulin resistance markers. Both were independently and directly associated with high risk for diabetes in the LA-FINDRISC category.
La escala Finlandesa de riesgo de diabetes (FINDRISC) es una herramienta para predecir el riesgo a 10 años de diabetes tipo 2 (DMT2). La adiposidad visceral se asocia con un alto riesgo cardiometabólico. El objetivo fue evaluar la relación del espesor del tejido adiposo epicárdico (TAE) y el riesgo de DMT2 calculado según FINDRISC.
MétodosEste estudio fue realizado en Ciudad Bolívar, Venezuela. Cincuenta y cinco sujetos; 37 mujeres (67,3%) y 18 hombres (32,7%) con edades entre 18 y 75 años fueron incluidos. Peso, talla, índice de masa corporal (IMC), circunferencia abdominal (CA), glucemia, insulina basal, lípidos plasmáticos, Homeostasis Model Assessment-Insulin Resistance (HOMA-IR) y espesor del TAE fueron medidos. Se aplicó el FINDRISC con puntos de corte de CA modificados para Latinoamérica (LA-FINDRISC).
ResultadosEl IMC, CA, insulina, HOMA-IR y espesor del TAE fueron mayores (p<0,0001) en el grupo de alto riesgo comparado con el grupo de bajo-moderado riesgo según LA-FINDRISC. Esta escala se correlacionó positivamente con el IMC (r=0,513; p=0,0001), CA (r=0,524; p=0,0001), glucemia en ayuna (r=0,396; p=0,003); insulina (r=0,483; p=0,0001); HOMA-IR (r=0,545; p=0,0001); y espesor del TAE (r=0,702; p=0,0001). El análisis de regresión multivariante mostró que la glucemia en ayuna (p=0,023) y el espesor del TAE (p=0.007) se asociaron independientemente con alto riesgo de DMT2.
ConclusionesLA-FINDRISC se asocia tanto con el espesor del TAE como con marcadores de resistencia a la insulina. Ambos se asociaron directa e independientemente con la categoría de alto riesgo de DMT2 según LA-FINDRISC.
The Finnish Diabetes Risk Score (FINDRISC) was originally developed for the Finnish National Type 2 Diabetes Prevention Program as a tool for primary health care workers to predict 10-year risk of type 2 diabetes mellitus (T2DM) onset without the need for laboratory tests.1 FINDRISC also proved suitable in predicting coronary heart disease, stroke and total mortality in Caucasians.2 A modified version for Latin America (LA-FINDRISC), using different waist circumference (WC) cutoff values, has been validated.3
Visceral adiposity is associated with higher cardiometabolic risk. Quantifying visceral adipose tissue might therefore allow a better cardiovascular and metabolic risk stratification.4 The importance of the anatomical closeness of some visceral adipose tissue depots to target organs, including the heart, was recently emphasized.5,6 Thus in the last few years, some non-traditional visceral adipose tissues, such as epicardial adipose tissue (EAT) have been studied and proposed as new markers of visceral adiposity.5,7
In clinical practice, EAT thickness can be easily and accurately measured with standard ultrasound techniques.8 EAT thickness has been consistently associated with the metabolic syndrome and its components9,10 as well was with a higher cardiovascular disease risk.11 Furthermore, the relationship between thickness of epicardial fat and T2DM has been also evaluated, although large longitudinal studies for determining an independent predictive role of epicardial fat in the development of T2DM are lacking. Thus, the objective of the present study was to assess the relationship of EAT thickness with calculated T2DM risk according to the LA-FINDRISC.
MethodsDesign and subjectsThis is an observational, cross-sectional study conducted in Ciudad Bolívar, Venezuela, between January and August, 2017. Subjects were invited through local newspapers and social media to participate in a screening for cardiometabolic risk. The study comprised 55 subjects; 37 women (67.3%) and 18 men (32.7%) aged between 18 and 75.
Subjects with a prior history of T2DM, ischemic cardiomyopathy, cerebrovascular disease, chronic kidney disease on dialysis, primary hyperlipidemia, and endocrinopathies such as hypothyroidism, Cushing's syndrome, and acromegaly, as well as those with any comorbidity likely to affect the metabolic variables, were excluded.
The study was approved by the hospital's Ethics Commission according to Helsinki Declaration guidelines. All subjects gave informed consent to participate in the study.
Clinical evaluationWeight and height were measured with subjects wearing only their underwear. Body mass index (BMI) was calculated as weight in kilograms divided by height in meters squared. WC was measured midway between the underside of the lowest rib and the iliac crest, in cm, with subjects standing. Blood pressure was taken on the right arm, after 10min of rest, with the subject in a sitting position using the auscultation method with a conventional mercury sphygmomanometer.
Laboratory variablesAfter obtaining an 8-hour fasting blood sample from the antecubital vein blood glucose and lipids [total cholesterol, triglycerides and high-density lipoprotein cholesterol (HDL-C)] were measured by enzymatic methods. Low density lipoprotein cholesterol (LDL-C) was calculated using the Friedewald equation: LDL-C (mg/dL)=total cholesterol−[HDL-C+(triglycerides/5)] for triglyceride values up to 400mg/dL. Basal insulin (mU/mL) was determined by chemiluminescence with Siemens reagents. Homeostasis Model Assessment-Insulin Resistance (HOMA-IR) was calculated using the equation [fasting glucose (mg/dL)×fasting insulin (mU/mL)/405].
Echocardiografic measurement of EAT thicknessStandard transthoracic two-dimensional echocardiography was performed with a Vivid 7 Dimension Ultrasound scanner (GE Healthcare, Wisconsin, USA) with subjects in left lateral recumbent position. The echocardiograms were recorded and interpreted by the same cardiologist-echocardiographer in order to guarantee the validity of the studies. The echocardiographer was blinded to the condition of the subjects.
The epicardial fat was measured using the technique validated by Iacobellis et al.8 Echocardiographically, EAT thickness showed as the echolucent space between the outer wall of the myocardium and the visceral pericardium. Thickness (in mm) was measured perpendicularly on the free wall of the right ventricle at end-systole in three cardiac cycles using both long and short-axis parasternal views. The right, free ventricular wall measurement was predicated on two reasons: (1) This point showcases the thickest pad of epicardial fat; and (2) Both the long- and short parasternal axes on the right ventricle make for more accurate EAT measurements, with optimal prompter alignment on each view.
LA-FINDRISC scoreThe LA-FINDRISC questionnaire comprises eight variables: age, BMI, WC, physical activity, daily consumption of vegetables and fruits, antihypertensive drug use, personal history of hyperglycemia, and family history of diabetes. WC cutoff values were adjusted for Latin America12 by adding four points to subjects with abdominal obesity (WC ≥94cm in men and ≥90cm in women) and no points to those with WC normal values, total score ranging from 0 to 26 points. Subjects scoring ≤14 points were considered at “low-moderate risk,” and those with >14 points, at “high risk”. These cutoff values have been reported to detect the presence of impaired glucose homeostasis (impaired fasting glucose+glucose intolerance+unknown T2DM), and vitamin D deficiency in clinical Venezuelan settings.3,13
Statistical analysisAll continuous variables are presented as mean±standard deviation, and the categorical variables, as absolute number and percentage. The chi square test was used to determine any significant sex-related difference between the groups. To determine the difference between the means of the continuous variables, a Student's t-test for independent samples was applied to those variables with a normal distribution determined with the Kolmogorov–Smirnov test; and the Mann–Whitney U test to those with a distribution that differs from the norm. In order to ascertain which variable exerts the most influence, a Pearson correlation matrix and both univariate and multivariate logistic regression analyses were performed, using high T2DM risk according to LA-FINDRISC as a dependent variable. To obtain the cut-off point of EAT thickness for predicting high T2DM risk according to the LA-FINDRISC in this population, the receptor operating curve (ROC) curve was constructed. An area under the curve (AUC) of 1 was considered optimal, while an AUC less than 0.5 was considered to have very little validity. The Youden Index was used to determine the best cut-off point from the ROC curve, calculated with the formula YI=(sensitivity+specificity)−1. Version 20.0 of SPSS for Windows was used for the statistical analysis, a p value ˂0.05 being statistically significant.
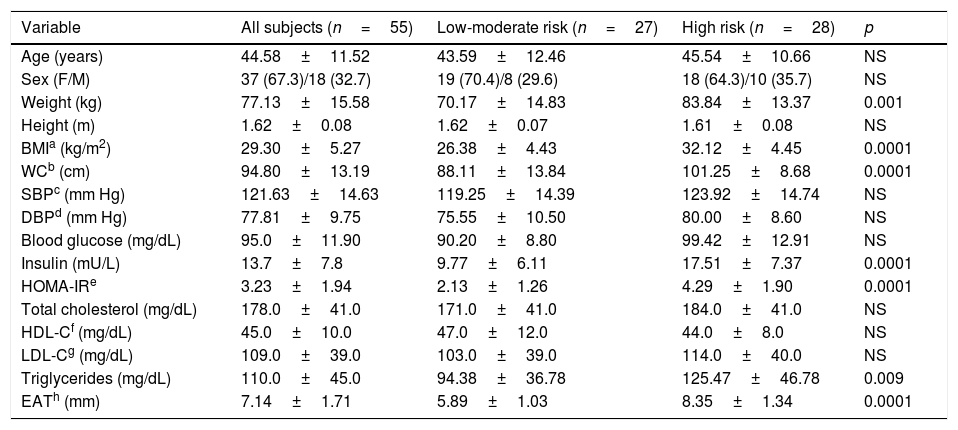
ResultsTable 1 shows clinical and biochemical characteristics of study subjects according to the risk of T2DM: low-moderate risk and high risk as determined by the LA-FINDRISC score. A group of 55 subjects averaging 44.58±11.52 years was evaluated. No significant differences were observed in age, sex, height, systolic (SBP) and diastolic blood pressure (DBP) between the groups. As expected BMI and WC were higher in the high-risk group (p<0.0001) than in the low-moderate risk group. Furthermore, Insulin plasma concentration, HOMA-IR index, and EAT thickness were higher (p<0.0001) in the high-risk group compared to subjects in the low-moderate risk group. No differences were observed in fasting blood glucose, total cholesterol, HDL-C and LDL-C between groups.
Anthropometric, clinical, laboratory data, and EAT thickness of participants according to LA-FINDRISC diabetes risk.
| Variable | All subjects (n=55) | Low-moderate risk (n=27) | High risk (n=28) | p |
|---|---|---|---|---|
| Age (years) | 44.58±11.52 | 43.59±12.46 | 45.54±10.66 | NS |
| Sex (F/M) | 37 (67.3)/18 (32.7) | 19 (70.4)/8 (29.6) | 18 (64.3)/10 (35.7) | NS |
| Weight (kg) | 77.13±15.58 | 70.17±14.83 | 83.84±13.37 | 0.001 |
| Height (m) | 1.62±0.08 | 1.62±0.07 | 1.61±0.08 | NS |
| BMIa (kg/m2) | 29.30±5.27 | 26.38±4.43 | 32.12±4.45 | 0.0001 |
| WCb (cm) | 94.80±13.19 | 88.11±13.84 | 101.25±8.68 | 0.0001 |
| SBPc (mm Hg) | 121.63±14.63 | 119.25±14.39 | 123.92±14.74 | NS |
| DBPd (mm Hg) | 77.81±9.75 | 75.55±10.50 | 80.00±8.60 | NS |
| Blood glucose (mg/dL) | 95.0±11.90 | 90.20±8.80 | 99.42±12.91 | NS |
| Insulin (mU/L) | 13.7±7.8 | 9.77±6.11 | 17.51±7.37 | 0.0001 |
| HOMA-IRe | 3.23±1.94 | 2.13±1.26 | 4.29±1.90 | 0.0001 |
| Total cholesterol (mg/dL) | 178.0±41.0 | 171.0±41.0 | 184.0±41.0 | NS |
| HDL-Cf (mg/dL) | 45.0±10.0 | 47.0±12.0 | 44.0±8.0 | NS |
| LDL-Cg (mg/dL) | 109.0±39.0 | 103.0±39.0 | 114.0±40.0 | NS |
| Triglycerides (mg/dL) | 110.0±45.0 | 94.38±36.78 | 125.47±46.78 | 0.009 |
| EATh (mm) | 7.14±1.71 | 5.89±1.03 | 8.35±1.34 | 0.0001 |
The continuous variables are presented in X±SD. Categorical variables in N (%).
Fig. 1 shows the correlation analyzes between LA-FINDRISC and clinical parameters. There was a positive correlation of LA-FINDRISC with BMI (r=0.513; p=0.0001), WC (r=0.524; p=0.0001), SBP (r=0.294; p=0.029), and DBP (r=0.331; p=0.014). Also, as illustrated in Fig. 2, LA-FINDRISC showed a positive correlation with fasting blood glucose (r=0.396; p=0.003); basal plasma insulin concentration (r=0.483; p=0.0001); HOMA-IR index (r=0.545; p=0.0001); and serum triglyceride levels (r=0.366; p=0.006). Likewise, as shown in Fig. 3 the LA-FINDRISC score showed a strong correlation with EAT thickness (r=0.702; p=0.0001).
, waist circumference (WC), and both systolic (SBP) and diastolic (DBP) blood pressure.")
, and triglycerides (Tg).")
.")
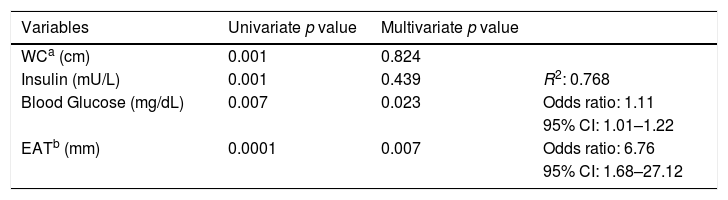
Table 2 shows the univariate and multivariate logistic regression analyses using high T2DM risk according to LA-FINDRISC as dependent variable. The univariate regression analysis yielded significance for WC (p=0.0001); basal insulin (p=0.001); fasting blood glucose (p=0.007); and EAT thickness (p=0.0001). BMI was excluded for being collinear with WC. The multivariate regression analysis showed that fasting blood glucose (p=0.023) and EAT thickness (p=0.007) persisted independently associated with high T2DM risk (R2 of 0.768 and the good of fitness Hosmer–Lemeshow of 7.306, non-significant, p=0.398), odds ratios of 1.11 and 6.61 for fasting blood glucose and EAT thickness, respectively.
Logistic regression analyses featuring the FINDRISC score classified for high and low-moderate diabetes mellitus risk as a dependent variable, and waist circumference, insulin, blood glucose, and epicardial adipose tissue as independent variables.
The ROC curve was constructed to obtain the cut-off point of EAT thickness for predicting high T2DM risk according to the LA-FINDRISC in this population. Analysis of the ROC curve (Fig. 4) showed an AUC of 0.931 (CI 95%: 0.866–0.996), which is an indication of the very high precision of the test. The cut-off value of 6.65mm obtained the highest Youden index (YI: 0.743), with 92.9% sensitivity and 99.8% specificity for predicting high T2DM risk according to the LA-FINDRISC.
Discussion
In this study, the LA-FINDRISC was directly correlated not only with fasting blood glucose, insulin and HOMA-IR index but also with EAT, a marker of visceral adiposity. Indeed, after multivariate adjustments, including for abdominal visceral adiposity, both EAT and fasting glucose were independently associated with the FINDRISC category previously shown to indicate greater risks of diabetes and cardiovascular disease onset.1,14,15
The FINDRISC is a practical, noninvasive, and cost-effective tool with a high sensitivity and specificity to detect diabetes mellitus or glucose metabolism alterations.14 This questionnaire takes into account clinical variables such as age, BMI, WC, level of physical activity, daily consumption of fruits and vegetables, use of antihypertensive medication, history of hyperglycemia and family history of diabetes mellitus. As expected, and consistent with previous reports13,15,16 subjects with high diabetes risk (FINDRISC >14 points) exhibited more elevated values of BMI, WC, insulin, HOMA-IR, and plasma triglyceride concentrations than low-moderate risk subjects. Furthermore, a statistically significant positive correlation was observed between the LA-FINDRISC score and metabolic syndrome components. Janghorbani et al.16 reported that subjects at high risk according to FINDRISC had 4.8 more chances to develop metabolic syndrome than those at low risk, FINDRISC emerging not only as a T2DM detecting tool but also as one to identify subjects with elevated global cardiometabolic risk.
At the present time there are no completely reliable diagnostic criteria for insulin resistance as a screening tool applicable to population studies. However, HOMA-IR17 serves as a surrogate marker of insulin resistance widely used on different populations. The current study indeed showed a positive correlation between the LA-FINDRISC score and both the basal insulin plasma concentration and the HOMA-IR, a finding which agrees with that observed in other studies.13,18 Both insulin secretion and insulin resistance are key components in the development of T2DM. The multivariate analysis revealed that fasting blood glucose was one of the variables exerting greater influence on T2DM risk according to the LA-FINDRISC score; probably owing to the high dependence of fasting plasma glucose on hepatic insulin sensitivity19 this in turn constituting the pivotal link in the FINDRISC-diabetes risk association.20 Interestingly, a study of 7232 Finnish men showed that the FINDRISC is more strongly associated with insulin resistance than with impaired insulin secretion.21 In addition, the subjects’ personal history of hyperglycemia is one of the variables bearing most weight in the FINDRISC score.1
The main finding of this study is the strong association between the LA-FINDRISC score and EAT thickness measured by echocardiography. EAT thickness is a marker of visceral fat accumulated within the pericardial sac. Epicardial fat has been shown to have both endocrine and paracrine effects that might predispose to development of diabetes and atherosclerosis.5 This relationship may be due to the connection existing between EAT thickness and components of FINDRISC that constitute criteria of metabolic syndrome definition4,9,10 especially waist circumference a clinically accepted surrogate of visceral abdominal fat. Indeed, a previous study on Venezuelan population showed that an EAT thickness ≥5mm has a sensitivity of 84.62% and a specificity of 71.11% to predict metabolic syndrome presence22; however, this study has for the first time revealed that a 6.65mm EAT thickness predicts high risk for T2DM according to the LA-FINDRISC score, with a sensitivity of 92.9 and a specificity of 99.8%, this threshold being higher than that found to predict metabolic syndrome.
This study suggests that FINDRISC is associated with visceral ectopic adiposity and that it could be used to predict increased visceral fat accumulation. Indeed it has been previously demonstrated that FINDRISC was a good tool to discriminate for the presence of hepatic steatosis by ultrasound.23 Interestingly, epicardial fat has been associated with liver fat accumulation, as both represent organ-specific ectopic fat depots in addition to sharing biochemical and embryological properties with intra-abdominal visceral fat.5,24 Although EAT reflects intramyocardial triglyceride content, its association with fatty liver disease results from multiple systemic factors, among which are an increase in free fatty acid release and a status inherent to insulin resistance.5 From a clinical perspective, EAT thickness is associated with serum levels of transaminases and incidence of hepatic steatosis regardless of the degree of obesity.25 When determined by ultrasound, it has shown to effectively predict, like the FINDRISC, hepatic steatosis.26
Furthermore, in addition to its association with EAT thickness, LA-FINDRISC was strongly associated with fasting glucose as previously shown,1,14,20 the variable exerting the greatest influence on diabetes onset risk. One can presume that in part this might also be to the association of the score with epicardial fat in addition to the previously described association with visceral abdominal fat.4,5 The relationship between EAT thickness and T2DM has been evaluated before,27 and subjects with impaired fasting glucose have been shown to have thicker epicardial fat deposits than their normoglycemic counterparts.28 This association may be ascribed to the correlation between EAT thickness and insulin resistance markers such as HOMA-IR.10,28 Likewise, type 1 diabetic patients also have greater EAT thickness than individuals without diabetes mellitus, independently of BMI and age.29
Study limitationsAlthough this study affords novel findings, some limitations are worth acknowledging, to wit: (1) the size of the sample is relatively small. The statistical power, however, was good enough to detect significant differences in the parameters under study; (2) the FINDRISC was not evaluated in all ethnic groups, and the cutoff value used to define high risk (<14 points) stems from studies of non-Hispanic European populations. This questionnaire, however, addresses universally applicable risk factors for T2DM; and the use of a regional cutoff point for WC enhanced the sensitivity of the FINDRISC in our population.3,30 (3) the FINDRISC was developed as a method to detect undiagnosed T2DM or glucose metabolism alterations, but not visceral adiposity. In addition, this study was designed not as a longitudinal analysis but as a cross-sectional one, which rules out the notion that subjects with higher EAT thickness will have a greater incidence of T2DM. This observation notwithstanding, similar studies have demonstrated the association of the FINDRISC with other cardiometabolic risk markers.13,15,23 (4) the subjects evaluated in this study were invited through local newspapers and social media to participate in a screening for cardiometabolic risk, a factor that might preclude its results from representing the general population of Ciudad Bolivar.
ConclusionIn this study, LA-FINDRISC was associated with both EAT thickness and insulin resistance markers. Both markers were independently and directly associated with high risk for diabetes FINDRISC category. Our data suggests that FINDRISC could be a marker not only of glucose disturbances but also of visceral adiposity accumulation in the heart. Further studies, especially prospective ones comprising more randomly selected patients, are necessary to corroborate these findings and evaluate if in fact, subjects having higher EAT thickness have a greater incidence of T2DM and also cardiovascular disease and if LA-FINDRISC could be used as a tool to stratify this risk.
FundingThis research did not receive any specific grant from funding agencies in the public, commercial, or not-for-profit sectors.
Conflict of interestThe authors have no conflicts to disclose.
We would like to thank to Professor Carlos Mota for his support and valuable comments to the manuscript.