


Carotid intima-media thickness (CIMT) is considered a marker of atherosclerosis, but the data is lacking from the South Asian population. We aimed to study the relation of CIMT with the presence and severity of coronary artery disease (CAD) in this population.
MethodsThis was a prospective, single-center study of consecutive patients undergoing elective coronary angiography. Participants with >50% luminal stenosis in any major coronary artery were included in the CAD group and those with normal coronaries in the non-CAD group. Multivariate linear regression analysis was done to determine independent predictors of CAD. Pearson's correlation coefficients assessed correlations between CIMT and Syntax and Gensini score.
ResultsThe mean CIMT was significantly much higher in the CAD group when compared to the non-CAD group (0.83±0.16 vs 0.61±0.14mm, p<0.001). On multivariable linear regression analysis only diabetes (β=0.208 and p=0.024), waist–hip ratio (β=0.178 and p=0.043), current smoker (β=0.293 and p=<0.001) and CIMT (β=0.217 and p=0.031) were independent predictors of CAD. The mean Gensini score in the CAD group was 48.59±34.25 and the mean Syntax score was 19.45±10.24. No significant relation was found between CIMT and Gensini score (r=0.009 and p=0.89), and Syntax score (r=−0.087 and p=0.171).
ConclusionMean CIMT is an independent predictor of CAD along with diabetes, waist–hip ratio, and smoking. However, CIMT was not related to the severity and complexity of the CAD as assessed by the Gensini score and Syntax score, respectively.
El grosor de íntima media carotídeo (GIM) está considerado un marcador de la aterosclerosis, aunque se carece de datos relativos a la población del sur de Asia. Nuestro objetivo fue estudiar la relación de GIM con la presencia y gravedad de la enfermedad de las arterias coronarias (EAC) en esta población.
MétodosEstudio prospectivo y unicéntrico de pacientes consecutivos sometidos a angiografía coronaria electiva. Se incluyó en el grupo EAC a los participantes con >50% estenosis luminal en cualquier arteria coronaria mayor, y en el grupo no EAC a los participantes con arterias coronarias normales. Se realizó un análisis de regresión lineal multivariante para determinar los factores predictivos independientes de EAC. Los coeficientes de correlación de Pearson evaluaron las correlaciones entre GIM y las puntuaciones de Gensini y Syntax.
ResultadosEl GIM medio fue significativamente mayor en el grupo EAC en comparación con el grupo no EAC (0,83±0,16 vs. 0,61±0,14mm, p<0,001). En el análisis de regresión lineal multivariante solo la diabetes (β=0,208 y p=0,024), el índice cintura-cadera (β=0,178 y p=0,043), y el tabaquismo actual (β=0,293 y p=<0,001) y GIM (β=0,217 y p=0,031) fueron factores predictivos independientes de EAC. La puntuación Gensini media en el grupo EAC fue de 48,59±34,25, y la puntuación Syntax media fue de 19,45±10,24. No se encontró relación significativa entre GIM y la puntuación de Gensini (r=0,009 y p=0,89) y la puntuación Syntax (r=−0,087 y p=0,171).
ConclusiónEl GIM medio es un factor predictivo independiente de EAC, junto con la diabetes, el índice cintura-cadera y el tabaquismo. Sin embargo, GIM no guardó relación con la gravedad y complejidad de EAC, según la evaluación de las puntuaciones de Gensini y Syntax, respectivamente.
Atherosclerosis leading to coronary artery disease (CAD) is the leading cause of morbidity and mortality across the globe. Atherosclerosis is a gradually progressive and generalized vascular system disease with an early increase in intima-media thickness.1 Carotid intima-media thickness (CIMT) measurement is a non-invasive, rapid, inexpensive, safe, widely available, and reproducible marker for atherosclerosis. It is independently associated with the risk of future cardiovascular events.2 Besides, CIMT can also predict the extent and severity of CAD.
Unfortunately, most of the research on CIMT is from high-income countries, with data notably lacking from the South Asian population.3 This is concerning because both CIMT and CAD are significantly influenced by ethnicity. South Asia accounts for one-quarter of the world's population and has the highest reported coronary heart disease (CHD) deaths for any ethnic group.4 The peculiar features of CAD in Indians are a premature onset, extensive and severe CAD, higher relative mortality, and few/absent conventional risk factors.5 Moreover, the traditional risk factors fail to explain the 40% excess CHD mortality in South Asians.6,7
The available literature from South Asia is limited by the small sample size, differences in CIMT measurement protocol, and inappropriate/absent comparison groups. Moreover, there is a lack of data on the association of CIMT with the severity and complexity of CAD. The objective of the present study was to assess the relationship between CIMT and the presence of angiographically proven CAD. Additionally, we aimed to study the relation of CIMT with the severity and complexity of the CAD.
Material and methodsStudy population and designThis prospective observational study was conducted in the Department of Cardiology, JIPMER, Puducherry, India, from December 2012 to December 2015. All consecutive patients of suspected chronic coronary heart disease, between 30 and 70 years of age, undergoing elective coronary angiography were included in the study. The patients with significant CAD on angiography were included in the CAD group, and those with non-significant coronary obstruction (<50% stenosis in major epicardial coronary arteries) or normal coronaries formed the non-CAD group. The participants with decompensated heart failure, left ventricular ejection fraction <30%, acute coronary syndrome, chronic kidney disease, post coronary revascularization, body mass index (BMI) of <18 or >40kg/m2, and sub-optimal image for CIMT measurement were excluded. The Institute Ethical Committee (IEC) for human studies approved the conduct of the study. Written consent was obtained after explaining to the participants in a language they understood.
Data collection and analysisDetailed medical histories and records were obtained from the participants, including the history of chest pain, diabetes, hypertension, hyperlipidemia, smoking, renal failure, prior revascularization, and family history of premature CAD. Enrolled patients underwent detailed clinical evaluation, anthropometric examination, electrocardiography (ECG), echocardiography, and routine biochemistry, including fasting lipid profile. Two experienced cardiologists interpreted the coronary angiogram to define CAD and non-CAD groups. Linear vascular ultrasonography was used to measure the mean CIMT. We did multivariate linear regression analysis to find independent predictors of CAD. Correlation between CIMT and the severity and complexity of CAD were also studied.
Coronary angiography and evaluation of CAD severity and complexityCoronary angiography was performed in the majority via radial artery approach using standard angiographic techniques. The angiographic study was interpreted in at least two orthogonal views, and the severity of lesions was estimated by quantitative coronary angiography (QCA). We assessed the severity of CAD using the Gensini score, a summation of the individual coronary segment scores based on the degree of narrowing and its topographical importance.8 In this system, 1–25% narrowing is scored as 1, 26–50% as 2, 51–75% as 4, 76–90% as 8, 91–99% as 16, and a complete occlusion is scored as 32. This score is multiplied by 1.5 for mid-left anterior descending artery (LAD) lesion, 1 for distal LAD, 2.5 for proximal LAD, and 5 for left main lesions. The complexity of CAD was evaluated by Syntax score, where each coronary lesion showing stenosis ≥50% of the diameter in vessels ≥1.5mm is scored separately.9 The total SYNTAX score was calculated by summing up the scores from individual lesions using an online SYNTAX calculator (http://www.syntaxscore.com). The angiographic scoring was performed independently by two interventional cardiologists blinded to the clinical and CIMT data.
CIMT measurementCIMT measurement was done according to consensus documents from international societies.1,10 This study used the Philips iE33 ultrasound machine (Philips, Eindhoven, Netherlands) with L11–3MHz linear array transducer. A high-resolution B-mode image of the longitudinal section of CCA, including the bifurcation, was used for measurement (Fig. 1). CIMT was defined as a double-line pattern formed by lumen-intima and media-adventitia interfaces. CIMT was measured at a distance of at least 5mm below the distal end of CCA, along a 10mm long straight segment of artery free of atherosclerotic plaque. CIMT values were measured in triplicate from the far wall of both the right and left CCA, at end-diastole (R wave). We used an automated system for measurement and took the average of all six values to derive the mean CIMT.
. It is formed by lumen-intima and media-adventitia interfaces. CCA, common carotid artery; ECA, external carotid artery; ICA, internal carotid artery; CIMT, carotid intima-media thickness.")
Longitudinal section of CCA and carotid bifurcation. CIMT is defined as a double-line pattern visualized by ultrasonography on both walls of the common carotid artery (CCA). It is formed by lumen-intima and media-adventitia interfaces. CCA, common carotid artery; ECA, external carotid artery; ICA, internal carotid artery; CIMT, carotid intima-media thickness.
The measurements were performed by two experienced cardiologists who were blinded to the clinical and angiographic data. To assess intraobserver variability, reader 1 (D.K.) measured the mean CIMT at distal CCA and compared it with the second set of measurements performed one week later. To examine interobserver variability, reader 2 (B.V.) measured mean CIMT at distal CCA and compared it with the first set of measurements derived by reader 1. 25 patients were randomly selected to assess the intra-observer and inter-observer variability and agreement.
DefinitionsCAD was defined as a diameter stenosis of ≥50% in at least one of the major epicardial coronary arteries. Hypertension was considered systolic blood pressure ≥140mmHg or diastolic blood pressure >90mmHg or taking treatment. Diabetes mellitus meant a fasting blood glucose ≥126mg/dl or 2-h postprandial blood glucose ≥200mg/dl or HbA1c>6.5% or already on treatment. Current smokers included adults who had smoked any tobacco in the previous 12 months. Family history of premature CAD was considered when CAD was diagnosed in a male primary relative before 55 years or 65 years in a female primary relative. Waist circumference (WC) was measured at the midpoint between the lower margin of the rib cage and the upper margin of the iliac crest at the end of normal expiration. Hip circumference for calculating waist–hip ratio (WHR) was taken around the widest portion of the buttocks. Bodyweight in kilograms (kg) was divided by the square of height in meters to derive the body mass index (BMI). Metabolic syndrome was defined according to modified NCEP ATP III panel criteria.
Statistical analysisThe data were managed on Microsoft excel version 2010 (Microsoft Corp., Seattle, Washington) and analyzed using SPSS version 28.0 (SPSS Inc., Chicago, IL, USA). Means and SDs were used to express continuous variables, and categorical variables were presented as frequencies and percentages. The p-value for comparing two independent continuous variables was obtained from the unpaired Student t-test. A comparison of two proportions was made by the Chi-square test or Fisher exact test. Box plot analysis was used to compare the mean CIMT between the two groups. Multivariate linear regression analysis of conventional risk factors and CIMT was done to determine independent predictors of CAD. Correlations between CIMT and Syntax and Gensini score were assessed by Pearson's correlation coefficients and scatter plot analysis. The Interclass correlation coefficient (ICC) and the lower and upper limits of the 95% CI were determined for intraobserver and interobserver variability in measurement of mean CIMT. The Bland–Altman method was used to determine intraobserver and interobserver agreement on the paired measure of mean CIMT. All tests were 2-sided, and statistically significant associations were considered at p-value <0.05.
Sample sizeBefore the commencement of our study, data on CIMT from India was minimal. Normative data of CIMT in the adult Indian population was not available for sample size calculation. However, in a small study, mean CIMT in 32 normal control subjects was reported as 0.501±0.081mm.11 Considering a very conservative 5% increase in CIMT in CAD patients, at least 221 patients were required in each study group to reject the null hypothesis with a power of 90% (β=0.1) and type 1 error (α) at 5% (two-tailed). We decided to recruit an additional 13% of patients (n=29) in each arm to account for attrition. Thus, the planned sample size was 250 patients in each in CAD and non-CAD groups.
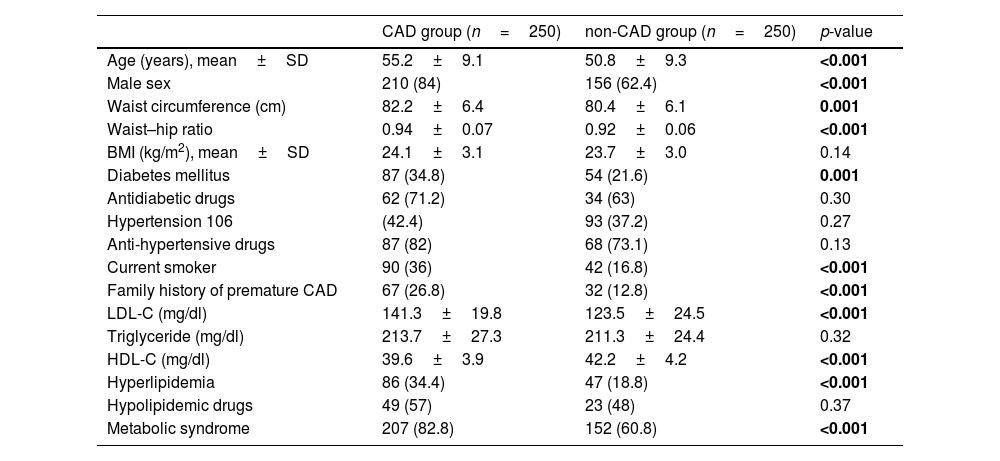
ResultsDemographic and clinical characteristicsFive hundred patients were included in this study, with 250 patients each in the CAD and non-CAD groups. The patient characteristics of both groups are compared in Table 1. The patients with CAD were older (55.2±9.1 years vs. 50.8±9.3 years) and more likely male (84% vs. 62.4%). No significant difference between the groups was seen regarding BMI, hypertension, and serum triglyceride levels. However, waist circumference and waist–hip ratio were significantly higher in the CAD group (82.2±6.4cm vs. 80.4±6.1cm, p=0.001), and (0.94±0.07 vs. 0.92±0.06kg/m2, p<0.001), respectively. CAD group had a higher prevalence of diabetes (34.8% vs 21.6%), current smokers (36% vs. 16%, p<0.001, family history of premature CAD (26.8% vs. 12.8%, p<0.001) and metabolic syndrome (82.8% vs 60.8%, p<0.001). The proportion of patients taking antidiabetic and antihypertensive drugs were similar between both the groups. The patients with CAD had significantly higher levels of LDL-C (141.3±19.8 vs. 123.5±24.5mg/dl, p<0.001) and lower levels of HDL-C (39.6±3.9 vs. 42.2±4.2mg/dl, p<0.001) as compared to the control group. Overall, the prevalence of hyperlipidemia was more common in CAD group (34.4% vs 18.8%, p<0.001). Among the patients with hyperlipidemia, lipid lowering drugs at the time of study was being taken by 57% of the CAD group and 48% of non-CAD group (p=0.37). The mean CIMT was significantly much higher in the CAD group when compared to the non-CAD group (0.83±0.16 vs. 0.61±0.14mm, p<0.001) (Fig. 2).
Demographic and clinical characteristics.
| CAD group (n=250) | non-CAD group (n=250) | p-value | |
|---|---|---|---|
| Age (years), mean±SD | 55.2±9.1 | 50.8±9.3 | <0.001 |
| Male sex | 210 (84) | 156 (62.4) | <0.001 |
| Waist circumference (cm) | 82.2±6.4 | 80.4±6.1 | 0.001 |
| Waist–hip ratio | 0.94±0.07 | 0.92±0.06 | <0.001 |
| BMI (kg/m2), mean±SD | 24.1±3.1 | 23.7±3.0 | 0.14 |
| Diabetes mellitus | 87 (34.8) | 54 (21.6) | 0.001 |
| Antidiabetic drugs | 62 (71.2) | 34 (63) | 0.30 |
| Hypertension 106 | (42.4) | 93 (37.2) | 0.27 |
| Anti-hypertensive drugs | 87 (82) | 68 (73.1) | 0.13 |
| Current smoker | 90 (36) | 42 (16.8) | <0.001 |
| Family history of premature CAD | 67 (26.8) | 32 (12.8) | <0.001 |
| LDL-C (mg/dl) | 141.3±19.8 | 123.5±24.5 | <0.001 |
| Triglyceride (mg/dl) | 213.7±27.3 | 211.3±24.4 | 0.32 |
| HDL-C (mg/dl) | 39.6±3.9 | 42.2±4.2 | <0.001 |
| Hyperlipidemia | 86 (34.4) | 47 (18.8) | <0.001 |
| Hypolipidemic drugs | 49 (57) | 23 (48) | 0.37 |
| Metabolic syndrome | 207 (82.8) | 152 (60.8) | <0.001 |
CAD, coronary artery disease; BMI, body mass index; LDL-C, low-density lipoprotein cholesterol; HDL-C, high-density lipoprotein cholesterol.
Values shown represent numbers (percentages), except where otherwise noted.
Significant p values (p<0.05) have been marked as bold.
 and presence of CAD. CIMT is given as mean±standard deviation below the box plots. The p-values for the comparison of the groups are also shown. CAD, coronary artery disease; CIMT, carotid intima-media thickness.")
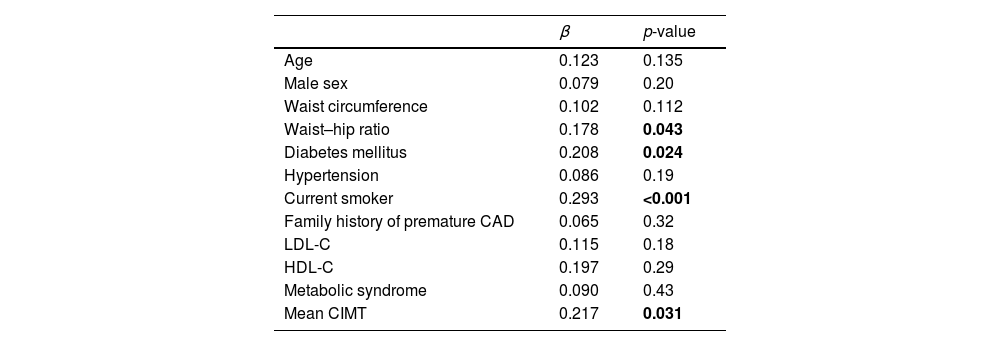
We entered all the variables from Table 1 into a stepwise multiple linear regression analysis to identify significant contributors to the presence of CAD (Table 2). The multivariable linear regression analysis showed that only diabetes (β=0.208 and p=0.024), waist–hip ratio (β=0.178 and p=0.043), current smoker (β=0.293 and p=<0.001 and CIMT (β=0.217 and p=0.031) were independent predictors of CAD.
Multivariate regression analysis of variables predictive of CAD.
| β | p-value | |
|---|---|---|
| Age | 0.123 | 0.135 |
| Male sex | 0.079 | 0.20 |
| Waist circumference | 0.102 | 0.112 |
| Waist–hip ratio | 0.178 | 0.043 |
| Diabetes mellitus | 0.208 | 0.024 |
| Hypertension | 0.086 | 0.19 |
| Current smoker | 0.293 | <0.001 |
| Family history of premature CAD | 0.065 | 0.32 |
| LDL-C | 0.115 | 0.18 |
| HDL-C | 0.197 | 0.29 |
| Metabolic syndrome | 0.090 | 0.43 |
| Mean CIMT | 0.217 | 0.031 |
CAD, coronary artery disease; LDL-C, low-density lipoprotein cholesterol; HDL-C, high-density lipoprotein cholesterol; CIMT, carotid intima-media thickness.
β indicates regression coefficient.
Significant p values (p<0.05) have been marked as bold.
The mean Gensini score in the CAD group was 48.59±34.25, and the mean Syntax score was 19.45±10.24. Pearson's correlation analysis was done, and a scatter plot was drawn to study the correlation between CIMT and Gensini (Fig. 3) and Syntax score (Fig. 4). No significant relation was found between CIMT and Gensini score (r=0.009 and p=0.89) and Syntax score (r=−0.087and p=0.171).
Intra-observer and inter-observer variability and agreement in CIMT measurement and Gensini Score.")
 and Syntax score.")
The Bland–Altman plot showed strong agreement between intraobserver (Fig. 5) and interobserver measurements of mean CIMT (Fig. 6). The intraobserver variability was small for measuring CIMT, with an ICC of 0.953 (95% CI: 0.904–0.978). The interobserver reliability was also excellent, with an ICC of 0.937 (95% CI: 0.873–0.970).
.")
.")
We did a prospective study to evaluate the relation between CIMT and angiographically proven CAD in a South Asian population. CIMT was found to be an independent predictor of the presence of CAD, along with waist–hip ratio, diabetes, and current smoking. However, CIMT was not related to the severity and complexity of the CAD as assessed by the Gensini score and Syntax score, respectively.
The Asian Indians have been noted to have the highest CHD burden among all ethnicities, but the underlying reasons remain unknown. They typically have accelerated atherosclerosis, premature occurrence, and a high mortality rate.5 Limited understanding of the mechanisms leading to excess CHD risk presents a significant hindrance in reducing the CHD burden in this population. Moreover, countrywide data on CV risk factors except tobacco use is not available from India. We found that only diabetes, waist–hip ratio, and smoking were independent predictors of CAD among conventional risk factors. Asian Indians are an ethnically vulnerable race for developing diabetes and metabolic abnormalities. Central adiposity, insulin resistance, and diabetes have been proposed to contribute to higher CHD risk in this ethnic group. However, these risk factors cannot fully explain the high CAD rates in this population.6,7 There may be an interplay between genetic, metabolic, social, and environmental factors.7 Discouraging cigarette smoking and promoting healthy lifestyle changes can promote better cardiovascular health.
We want to highlight that only WHR remained the independent predictor of CAD and not WC and BMI. WHR and WC are related to abdominal obesity, whereas BMI reflects general obesity. South Asians have lower BMI and WC than other racial groups, but they have higher levels of visceral fat and insulin resistance.12 Moreover, high BMI is a weak risk factor for CVD mortality in South Asians.13 As measured by WHR, Visceral adiposity is the preferred clinical measure of obesity for predicting all-cause and CVD mortality. Another finding of concern was a very high rate of smoking among adults in the CAD group of this study (36%). A large cross-sectional study has shown that more than one-third of adults in India (35%) use tobacco, which is more prevalent in males.14 Tobacco use (cigarettes and beedi) is strongly associated with CAD in Asian Indians.12 Tobacco use is increasing alarmingly among young individuals and even children, particularly those with lower education.
Mean CIMT measured in this study by an automated system had excellent reproducibility. It was found to be independently associated with the presence of CAD on multivariate regression analysis. CIMT is an established marker of atherosclerosis and has been independently associated with future risk for adverse cardiovascular events.2,3 In a recent meta-analysis, pooled sensitivity and specificity of IMT for diagnosing CAD were 68% and 70%, respectively.3 However, the incremental value of carotid IMT beyond that available from standard risk assessments to improve overall patient outcomes is not established.15
The severity and complexity of CAD as assessed by Gensini score and Syntax score, respectively, are increasingly being recognized for their importance in treatment decisions and prognostication. Therefore, efforts are being made to use non-invasive methods to predict CAD severity and complexity. CIMT can predict future cardiovascular events, but their relation with the severity of CAD is not established. Studies, mainly from high-income countries, suggest that CIMT can predict the severity of CAD.16,17 In a recent meta-analysis, a moderate correlation was found between CIMT and severity of CAD and the number of diseased vessels.2 However, these results cannot be generalized to the South Asian population due to their limited representation in the studies. We did not find any relation between CIMT and the severity of CAD as assessed by the Gensini score.
The Syntax score, a measure of CAD complexity, assists in choosing an appropriate revascularization strategy between the percutaneous coronary intervention (PCI) and CABG. A higher score predicts increased periprocedural complications and long-term mortality. The available literature on the relation between CIMT and Syntax score are conflicting. Studies showing a significant association between CIMT and Syntax scores have significantly lower Syntax scores than our study.18,19 From Japan, Ikeda et al. reported a mean SYNTAX score of 8.1±14.4 compared to the mean Syntax score of 19.45±10.24 in our study.16 Studies with relatively higher Syntax scores have failed to show any correlation with CIMT.20,21 In the study by Costanzo et al., with a mean Syntax score of 20.11±9.17, there was a high prevalence of carotid lesions in patients with multivessel complex CAD, but the Syntax score failed to correlate with the CIMT.21
The following reasons may explain the lack of correlation between CIMT and CAD severity and complexity. First, significant ethnic differences are present in South Asians with greater severity, complexity, and relative prematurity of CAD. An increase in CIMT may not have reciprocated the relatively severe CAD at a younger age. Second, though atherosclerosis is a systemic disease process, there is significant variability in atherosclerosis development between the vascular beds. In an elegant post-mortem study by Pasterkamp et al., there was a five-fold difference in the extent of atherosclerosis between the common carotid arteries and the coronary arteries.22 This may lead to a possible error in measuring CAD severity because CIMT is an indirect measure of atherosclerotic burden in the coronaries. CIMT is supposed to have a weak relation with coronary atherosclerosis. Third, there is an absence of data to show that the progression of CIMT predicts CAD. In large studies from the general population and individuals at high CV risk, the CIMT progression did not relate to future CV risk.23 Fourth, CIMT includes both the intimal and medial layer of the carotid artery, whereas atherosclerosis is limited to the intimal layer, at least in the early phase. Fifth, the Syntax score includes factors like vessel tortuosity, thrombus, bifurcation or trifurcation type lesions, duration of occlusion, the stump of occlusion, and coronary dominance, which may not have a direct relation with the severity of atherosclerosis. Finally, the varying study results may probably be also caused by differences in study design and differences in CIMT measurement protocols.
The main strength of our study was a well-powered prospective study from the South Asian population. Second, we used angiography to exclude CAD in the control group. Third, the angiography was quantified by QCA instead of visual estimation of lesion severity. Fourth, we studied the correlation of CIMT with both the severity and complexity of CAD. Moreover, the measurement of CIMT was done according to standard recommended protocol, and all measurements were automated. However, there were several important limitations too. First, being a single-center study, the findings cannot be generalized to a much-varied South Asian population. Second, follow-up data were not available to study the future risk of CV events and their relation to progression in CIMT. Moreover, we have used only mean CIMT of the common carotid artery, whereas those segments with a higher prevalence of plaques as the bulb or internal carotid artery were not analyzed. Atherosclerotic plaques, number and maximum thickness correspond to a more advanced atherosclerotic disease.24 Failure to include these characteristics in our study may also explain the no correlation observed between carotid atherosclerosis and the extent of CAD.
ConclusionsMean CIMT is an independent predictor of CAD along with diabetes, waist–hip ratio, and smoking. However, CIMT was not related to the severity and complexity of the CAD as assessed by the Gensini score and Syntax score, respectively.
Ethical approvalThe Institute Ethical Committee (Reg no: ECR/342/Inst/PY/2013) for human studies approved the conduct of the study. The study was a part of an academic thesis done by D.K at Jawaharlal Institute of Postgraduate Medical Education and Research (JIPMER), Puducherry, India.
FundingThis research did not receive any specific grant from funding agencies in the public, commercial, or not-for-profit sectors.
Informed consentWritten informed consent was obtained from all individual participants included in the study.
Conflict of interestsThe authors declare that there is no conflict of interest.
The authors would like to thank Prof Santhosh Satheesh, Dept of Cardiology, JIPMER, Puducherry, India for his valuable guidance and support throughout the thesis work.
- Documento de recomendaciones de la Sociedad Española de Arteriosclerosis (SEA). La dieta en la prevención cardiovascular. Actualización 2024
- “Notas metodológicas”: una nueva e importante sección en Clínica e Investigación en Arteriosclerosis
- Consenso sobre lipoproteína (a) de la Sociedad Española de Arteriosclerosis. Revisión bibliográfica y recomendaciones para la práctica clínica
recomendados