


The aim was to assess the impact on economic costs and length of stay (LOS) of postoperative complications.
Methods5822 records from BMDS (2014–2015) are included. A descriptive, univariate and multivariate study evaluated the correlation between complications, Clavien-Dindo grade and vacation periods with LOS and economic costs, based on a full-cost model, aggregated by DRG.
Results and conclusionsMean cost per stay was €676.71, and €4309.02 per episode. Complications appeared in 639 patients (11%). Admission to ICU was required in 203 patients, re-operation in 134 and re-admission in 243, while 66 patients died (1.1%). Complications caused significantly longer LOS (20.08 vs 5.48 days) and higher economic cost (€11670.31 vs €3354.12); infectious complications were the most frequent and respiratory the most expensive (€20428.53), together with ICU admission (€20242.66). Clavien-Dindo grade correlated with greater LOS and costs (except grade V). During vacation periods, complications and LOS are increased, but costs of these complications and LOS did not differ significantly from complications detected in non-vacation periods.
El objetivo es analizar el impacto en costes económicos y estancias de las complicaciones quirúrgicas.
MétodosIncluimos 5.822 registros del CMBD (2014-2015). Realizamos análisis descriptivo, univariante y multivariante, evaluando asociación entre complicaciones, grado Clavien-Dindo y vacaciones con estancias y costes económicos (modelo de costes totales agregados por GRD).
Resultados y conclusionesEl coste medio por estancia es de 676,71€, y de 4.309,02€ por episodio. Presentaron complicación 639 (11%). 203 ingresos en UCI, 134 reintervenciones, 243 reingresos y 66 fallecimientos (1,1%). Las complicaciones generan mayor estancia (20,08 vs 5,48 días) y coste (11.670,31€ vs 3.354,12€), siendo las infecciosas las más frecuentes y las respiratorias las más costosas (20.428,53€), conjuntamente con ingreso en UCI. El grado de Clavien-Dindo se correlaciona con el incremento de estancias y costes (excepto grado v). En vacaciones aumentan complicaciones y estancias, pero sus costes no varían respecto a no vacaciones.
Despite better patient selection, better preoperative preparation and advanced recovery programs, which have all become more routine, surgical complications can appear in up to 40% of patients undergoing general surgery, causing increased hospital stays,1 risk of mortality, need for higher-level care at discharge and unplanned readmissions.1,2 In addition, some studies have estimated that the presence of complications can increase costs by 1.893 and entail total additional costs of up to $37917 per patient.4 This estimation will lead to the development of strategies to make our healthcare system more sustainable.1,5–8
Multiple factors can determine a greater number of complications, and their costs.2,9–11 Some are inherent to the type of patient,12–14 surgery,15 surgeon16,17 or specific complication,18,19 in addition to population aging and the chronification of disease.20 Likewise, it is important to consider that the growing specialization and technification in healthcare, despite providing a clear improvement in health outcomes, can achieve the opposite effect, turning a complication into a source of expenses, sometimes never-ending, with a duration over time that is difficult to withstand from an economic viewpoint.21
Recently, an editorial of The JAMA Network stated that “effective methods have been identified to reduce surgical complications, but hospitals have been very slow to implement them.”22 Is it possible that hospitals benefit from complications, depending on how they are codified? In fact, depending on who is paying at hospitals where there are different “payers”, the profit or loss margin for financing the same complication may be dissimilar.4
We intend to analyze the economic impact of the presence of complications and their types in the context of a Surgical Unit at a Regional Hospital, with the idea of being able to optimize resources or, at least, develop budget forecast initiatives according to these expected complications.
The general objective of this analysis is to calculate the cost caused by postoperative complications. The specific objectives are to determine the distribution of complications, cost of the main types of complications, correlation between costs and the Clavien-Dindo grade and differences in the distribution of complications at different times (vacation periods versus non-vacation periods) and their impact on hospital stays and costs.
MethodsUsing a case–control study, we retrospectively analyzed the 2014–2015 general surgery records. The sample was divided into two groups, according to the presence of complications (cases) or absence (controls). The economic data have been extracted from the analytical accounting application COAN-HyD23 associated with the records by means of a database prepared for this purpose, which included some variables of interest for the study and routines for the detection and classification of complications. The Ethics Committee authorized the study, and every precaution was taken for data protection, in accordance with current legislation.24,25
“Complications” were defined as any deviation from the normal postoperative course, symptomatic or asymptomatic; “sequelae” were, to an extent, inherent to the surgery itself, appearing after the operation; lastly, “failure” was when the ultimate purpose of the surgery was not achieved.26 Therefore, only complications, not sequelae or failures, have been considered objects of this study.
We included all the episodes with admission to/discharge from the surgery unit, admission to other units and discharge from the surgery unit, and discharge from the ICU after a surgical procedure. The only exclusion criterion was the impossibility of assigning *DRG (Diagnosis-Related Group) codes, or cases assigned DRG 470 (non-grouped DRG). Our surgery unit does not treat pediatric patients.
For the calculation of aggregate costs by DRG, values for mean hospital stays, avoidable hospital stays and stay utilization index (SUI) were obtained. We calculated the expected mean hospital stay (MHS) for each DRG and the cost of each DRG point using the quotient of the total cost of hospitalization, divided by the total of DRG points, and the cost per day of hospitalization for each DRG, adjusting this to the expected stays according to the SUI. Thus, the cost per day of stay per DRG was obtained by dividing the total cost of the DRG by the product of the number of discharges by the MHS. In unique cases (without SUI), the gross MHS was assumed as the denominator. Finally, the differential cost was calculated for each case using the product of the cost/day of the DRG multiplied by the difference between the hospital stay and the expected stay. If the stay was less than 24h, it was assigned the costs for one full day.
For each group, we calculated the cost associated with the presence of complications in general and related to the different types of complications, readmission, reoperation, admission to the ICU, Clavien-Dindo grade26 and its correlation with vacation periods. Reoperations were considered those performed due to a complication of the primary intervention, and therefore unforeseen, excluding second scheduled interventions, such as second-looks or stomata closure.
Hospitalization during vacation periods was defined as admissions between July 1 and September 30, Christmas holidays (December 21 to January 8), Holy Week (Palm Sunday to Easter Sunday) and April Fair (Monday to Fair Sunday). Traditionally, there is a decrease in scheduled activity as hospital staff take vacation days and there are staff substitutions.
Statistical AnalysisDescriptive study, with measures of central tendency and dispersion for quantitative variables, and distribution of frequencies for qualitative variables. Student's t test to compare means between groups (95% statistical significance level, P<.05). With the significant variables, multivariate linear regression models were proposed for global hospital stay, calculated cost and differential cost (real/expected).
The statistical analysis was performed using R 3.3.1 GUI 1.68 Mavericks Build (7250), with R-Commander.
ResultsOverall ResultsOut of the 6000 registered discharges, and after filtering out non-coded records or DRG-470 (not grouped), we included 5822 patients with a mean age of 57.35±18.1 years. The non-coded registers were scheduled hospitalizations for canceled interventions, with same-day discharge.
A total of 2870 (49.3%) were men, 2947 (50.6%) women and 5 unspecified. The most frequent patient origin was the surgical waiting list with 3042 cases (52.4%), followed by emergency admissions with 2491 cases (42.8%), and surgery consultations with 253 (4.3%). A total of 2610 (43.5%) hospitalizations were urgent and 3390 (56.5%) were scheduled. The differences between origin and admission circumstances were that an admission could be urgent, but not necessarily originating from the Emergency Department.
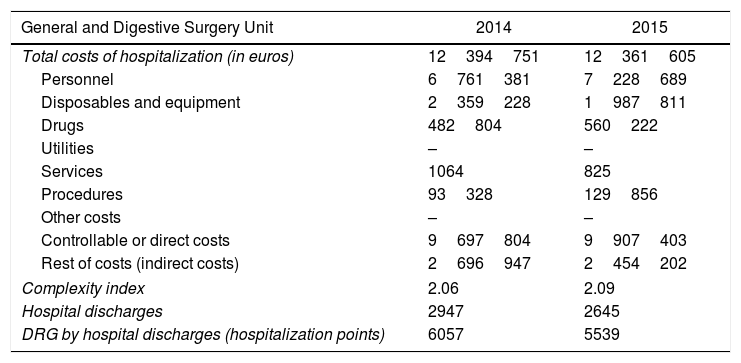
The total costs of hospitalization, their breakdown and DRG points are detailed in Table 1, with a calculated average cost/day of €676.71±€246.70. The expected average cost per episode was €4267.34±€7030.80, while the real cost was −€39.86±€4921.20. The 591-day hospital stay was due to a case with numerous complications, prolonged ICU stay and several surgical interventions. Likewise, the maximum cost of €175708 was calculated for an episode of serious complications secondary to an intervention due to esophageal cancer, which was very complex. The negative cost difference refers to cases in which, according to the expected calculation based on DRG and adjusting the cost to the SUI, they have been assigned a lower cost than expected, and therefore negative (representing a savings). Thus, the differential of −€27.146 was an episode of death due to multiple complications in one of the most expensive DRG (DRG 877).
Economic Costs and Indicators.
| General and Digestive Surgery Unit | 2014 | 2015 |
|---|---|---|
| Total costs of hospitalization (in euros) | 12394751 | 12361605 |
| Personnel | 6761381 | 7228689 |
| Disposables and equipment | 2359228 | 1987811 |
| Drugs | 482804 | 560222 |
| Utilities | – | – |
| Services | 1064 | 825 |
| Procedures | 93328 | 129856 |
| Other costs | – | – |
| Controllable or direct costs | 9697804 | 9907403 |
| Rest of costs (indirect costs) | 2696947 | 2454202 |
| Complexity index | 2.06 | 2.09 |
| Hospital discharges | 2947 | 2645 |
| DRG by hospital discharges (hospitalization points) | 6057 | 5539 |
Based on data obtained from COAN HyD.
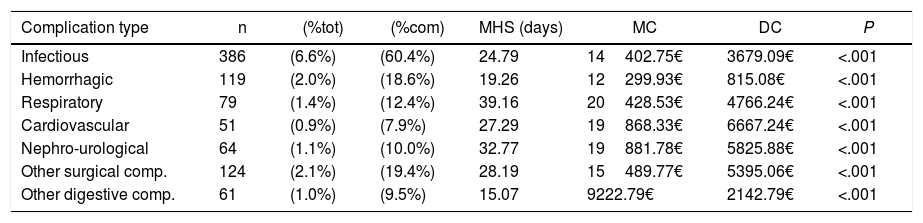
There were a total of 639 episodes (11.0%) with at least one complication. The mean number of complications coded (complicated) was 1.82±1.3, with mode and median=1. A total of 5183 episodes (89.0%) presented no complications. Table 2 demonstrates the distribution of the complication types, and the presence of several are possible in the same episode. The most frequent were infectious: 386 (60.40%), which exceeded 2/3 of the total.
Analysis of the Types of Complications Versus Their Absence.
| Complication type | n | (%tot) | (%com) | MHS (days) | MC | DC | P |
|---|---|---|---|---|---|---|---|
| Infectious | 386 | (6.6%) | (60.4%) | 24.79 | 14402.75€ | 3679.09€ | <.001 |
| Hemorrhagic | 119 | (2.0%) | (18.6%) | 19.26 | 12299.93€ | 815.08€ | <.001 |
| Respiratory | 79 | (1.4%) | (12.4%) | 39.16 | 20428.53€ | 4766.24€ | <.001 |
| Cardiovascular | 51 | (0.9%) | (7.9%) | 27.29 | 19868.33€ | 6667.24€ | <.001 |
| Nephro-urological | 64 | (1.1%) | (10.0%) | 32.77 | 19881.78€ | 5825.88€ | <.001 |
| Other surgical comp. | 124 | (2.1%) | (19.4%) | 28.19 | 15489.77€ | 5395.06€ | <.001 |
| Other digestive comp. | 61 | (1.0%) | (9.5%) | 15.07 | 9222.79€ | 2142.79€ | <.001 |
MC: mean cost in euros (€); DC: differential cost in €; MHS: mean hospital stay; %com: % calculated of total complications only; %tot: % calculated of total episodes.
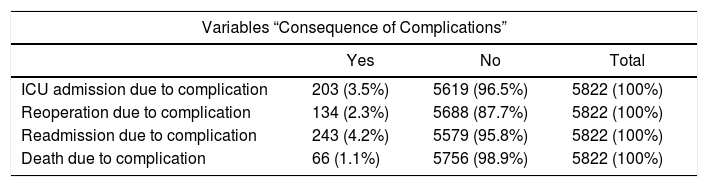
The consequences of the presence of complications, such as admission to the ICU, reoperation, readmission within 30 days or death, are described in Table 3, and the distribution of episodes classified according to Clavien-Dindo is in Table 4.
Other Variables Caused by the Presence of Complications: Distribution of Frequencies.
| Variables “Consequence of Complications” | |||
|---|---|---|---|
| Yes | No | Total | |
| ICU admission due to complication | 203 (3.5%) | 5619 (96.5%) | 5822 (100%) |
| Reoperation due to complication | 134 (2.3%) | 5688 (87.7%) | 5822 (100%) |
| Readmission due to complication | 243 (4.2%) | 5579 (95.8%) | 5822 (100%) |
| Death due to complication | 66 (1.1%) | 5756 (98.9%) | 5822 (100%) |
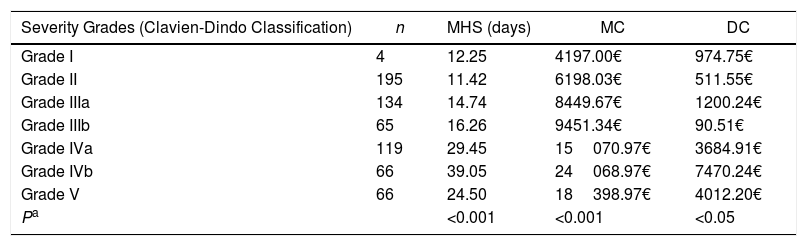
Non-Parametric Analysis of Mean Hospital Stay, Cost and Differential Cost According to the Complication Severity Grade.
| Severity Grades (Clavien-Dindo Classification) | n | MHS (days) | MC | DC |
|---|---|---|---|---|
| Grade I | 4 | 12.25 | 4197.00€ | 974.75€ |
| Grade II | 195 | 11.42 | 6198.03€ | 511.55€ |
| Grade IIIa | 134 | 14.74 | 8449.67€ | 1200.24€ |
| Grade IIIb | 65 | 16.26 | 9451.34€ | 90.51€ |
| Grade IVa | 119 | 29.45 | 15070.97€ | 3684.91€ |
| Grade IVb | 66 | 39.05 | 24068.97€ | 7470.24€ |
| Grade V | 66 | 24.50 | 18398.97€ | 4012.20€ |
| Pa | <0.001 | <0.001 | <0.05 |
MC: mean cost in euros (€); DC: differential cost in €; MHS: mean hospital stay.
MHS without complications was 5.48 days versus 20.08 days with complications (P<.001), with an average cost calculated per episode that was higher in complicated cases (€11670.31) compared to €3354.12 in uncomplicated (P<.001), and a calculated differential cost of €2239.22 in complicated case, with a savings of €321.00 (negative differential cost) in the uncomplicated (P<.001).
The analysis of frequencies, MHS, cost and differential cost for each type of complication (Table 2) shows that all generated longer stay, costs and differential costs than uncomplicated cases, which was significant in all except the differential cost for hemorrhagic complications. The most expensive were respiratory, with an average cost of €20428.53, a differential cost of €4766.24 and an MHS of 39.16 days. The least were “other digestive complications”, with an average cost of €14402.84 and a differential cost of €2143.78 for an MHS of 15.07 days.
Readmissions due to complications resulted in a readmission MHS of 13.73 days, compared to 6.79 days for cases without readmission (P<.001). The mean cost was €7061.33, compared to €4145.58 for non-readmissions (P<.001). The calculation of the total cost of the episode that presented readmission should be considered, therefore, as the sum of the “original” episode plus the cost of the readmission, although this is not a calculation that we have made. Likewise, the differential cost of the episodes with readmission was greater than the episodes that did not (€738.29 versus −€73.77), although in this case the P values were <.05 (assuming different variances) and greater than 0.05 (assuming equal variances).
Out of the 539 episodes admitted to the ICU, in 203 this was due to complications, generating an MHS of 12.47 days in the ICU and an overall stay of 34.24 days with 2.65 coded complications, compared to 13.48 days in patients who were not admitted to the ICU due to complications with 1.43 complications (P<.001). These hospitalizations cost an average of €20242.66, with an average differential cost of €5907.71 compared to the expected cost (P<.001).
The 134 patients who underwent reoperation for complications had an MHS of 21.51 days, greater than the 6.55 days of the non-reoperated patients (P<.001), costing an average of €12339.14 (€2413.12 more than those expected for the episode) (P<.001).
Sixty-six patients died due to complications, with an MHS of 24.50 days, which was statistically higher than that of the non-deceased due to complications (6.69 days). For these patients, an average cost of €18368.97 was calculated, which represents a differential cost of €4012.20 compared to the expected cost (P<.001).
We have also analyzed the hospital stays, cost and differential cost of the episodes according to their Clavien-Dindo grade, as summarized in Table 4.
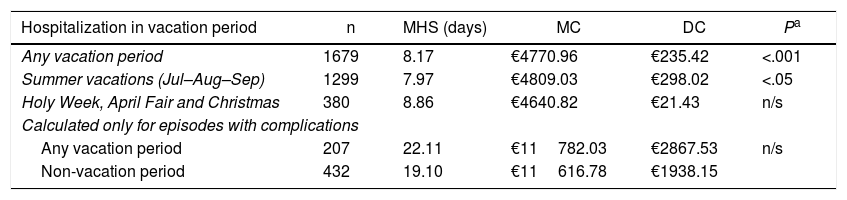
Results for Vacation PeriodsWhen we compared the episodes by their date of admission, patients admitted during vacation periods had longer hospital stays, higher costs and greater differential cost than those who did not (P<.05). However, this significance was maintained only over the summer vacation period, and not in the other periods (Holy Week, April Fair and Christmas). Nonetheless, when only episodes with complications were included in this analysis, there were no significant P values in hospital stay, cost or differential cost. In other words, complications that appear during vacations generate the same hospital stays, cost and differential cost as during the rest of the year (Table 5).
Analysis of Mean Hospital Stay, Cost and Differential Cost According to Date of Admission During Vacation Periods.
| Hospitalization in vacation period | n | MHS (days) | MC | DC | Pa |
|---|---|---|---|---|---|
| Any vacation period | 1679 | 8.17 | €4770.96 | €235.42 | <.001 |
| Summer vacations (Jul–Aug–Sep) | 1299 | 7.97 | €4809.03 | €298.02 | <.05 |
| Holy Week, April Fair and Christmas | 380 | 8.86 | €4640.82 | €21.43 | n/s |
| Calculated only for episodes with complications | |||||
| Any vacation period | 207 | 22.11 | €11782.03 | €2867.53 | n/s |
| Non-vacation period | 432 | 19.10 | €11616.78 | €1938.15 | |
MC: mean cost in euros (€); DC: differential cost in €; MHS: mean hospital stay.
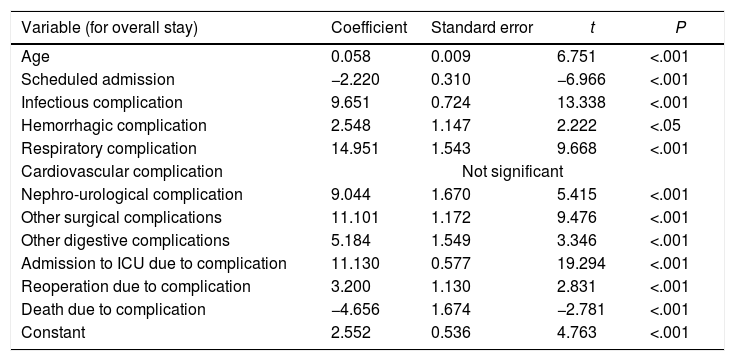
The multivariate analysis (Table 6), which includes the complication type, admission type, age, admission to the ICU, reoperation and death, confirms that there was a statistically significant difference for hospital stay in all except cardiological complications. Mortality exerts decreasing effects on hospital stay, as does scheduled admission. The coefficient of determination (R2) was 24.12%, which means that the application of the regression equation would explain exactly 24.12% of the cases. For the average cost of each episode, all variables were significant, but the R2 was 30.57%. In any event, age, respiratory complications, reoperation and death were not significant in differential cost, so when we eliminated them from the model, we obtained an even lower R2 of 8.65%.
Multivariate Linear Regression Models and Regression Equations for Global Hospital Stay and Economic Costs.
| Variable (for overall stay) | Coefficient | Standard error | t | P |
|---|---|---|---|---|
| Age | 0.058 | 0.009 | 6.751 | <.001 |
| Scheduled admission | −2.220 | 0.310 | −6.966 | <.001 |
| Infectious complication | 9.651 | 0.724 | 13.338 | <.001 |
| Hemorrhagic complication | 2.548 | 1.147 | 2.222 | <.05 |
| Respiratory complication | 14.951 | 1.543 | 9.668 | <.001 |
| Cardiovascular complication | Not significant | |||
| Nephro-urological complication | 9.044 | 1.670 | 5.415 | <.001 |
| Other surgical complications | 11.101 | 1.172 | 9.476 | <.001 |
| Other digestive complications | 5.184 | 1.549 | 3.346 | <.001 |
| Admission to ICU due to complication | 11.130 | 0.577 | 19.294 | <.001 |
| Reoperation due to complication | 3.200 | 1.130 | 2.831 | <.001 |
| Death due to complication | −4.656 | 1.674 | −2.781 | <.001 |
| Constant | 2.552 | 0.536 | 4.763 | <.001 |
| EG=2.552+(Edad×0.058)−(prog×2.22)+(CInf×9.65)+(CHem×2.55)+(CRes×14.95)+(CNef×9.04)+(CQxO×11.10)+(CDigO×5.18)+(UCI×11.13)+(Rein×3.2)−(Exit×4.66) | ||||
|---|---|---|---|---|
| R2=0.2412 | ||||
| Variable (for economic cost) | Coefficient | Standard error | t | P |
| Age | 33.427 | 4.306 | 7.763 | <.001 |
| Scheduled admission | −954.891 | 158.478 | −6.025 | <.001 |
| Infectious complication | 5.426127 | 355.029 | 15.284 | <.001 |
| Hemorrhagic complication | 2.254894 | 561.498 | 4.016 | <.001 |
| Respiratory complication | 3.845771 | 759.674 | 5.063 | <.001 |
| Cardiovascular complication | 5.443955 | 871.119 | 6.249 | <.001 |
| Nephro-urologic complication | 5.324769 | 817.733 | 6.512 | <.001 |
| Other surgical complications | 5.279193 | 573.938 | 9.198 | <.001 |
| Other digestive complications | 3.262925 | 758.752 | 4.300 | <.001 |
| Admission to ICU due to complication | 6.535032 | 283.610 | 23.042 | <.001 |
| Reoperation due to complication | 1.725192 | 553.478 | 3.117 | <.05 |
| Death due to complication | 2.104281 | 833.247 | 2.525 | <.05 |
| Constant | 1.510601 | 268.803 | 5.620 | <.001 |
| CE(COAN)=1,510.6+(Edad×33.427)−(prog×954.9)+(CInf×5426.1)(CHem×2254.9)+(CRes×3845.8)+(CCvas×5443.9)+(CNef×5324.8)+(CQxO×5279.2)+(CDigO×3262.9)+(UCI×6535.0)+(Rein×1725.2)+(Exit×1510.6) | |||
|---|---|---|---|
| R2=0.3057 | |||
| CE(COAN) | Calculated cost for the episode according to COAN | EG | Overall stay |
| Edad | Age in years | Constant | Mean cost without complications |
| CInf | Presence of infectious complication | Prog | Programmed hospitalization |
| Cres | Presence of respiratory complication | CHem | Presence of hemorrhagic complication |
| CNef | Presence of nephro-urologic complication | CCcvas | Presence of cardiovascular complication |
| CDigO | Presence of other digestive complications | CQxO | Presence of other surgical complications |
| Rei | Reoperation due to complications | UCI | Admission to ICU due to complications |
| Exit | Death due to complications | ||
Although the percentages of surgical complication are very different and depend mainly on the type of sample, our series reaches 11.0%, a figure similar to that published by Tevis et al.2 and Dindo et al.,26 although more acceptable than other series at up to 40%.2
In spite of the constant efforts to increase patient safety, staff qualifications and equipment at hospitals, and due to the chronification of patients, longer life expectancy and the complexity derived from the improved care offered by better human and technological teams, complications are becoming more and more costly and hospitalizations increasingly longer,1 with higher mortality and more unplanned readmissions.1,2 According to our series, complicated patients have an MHS 3.66 times greater than uncomplicated patients, coinciding with most series.
In terms of costs, the complicated cases tripled the average cost, similar to Dimick et al.,5 and are higher than in the study by Birkmeyer et al.,27 although this group focused on only four specific procedures.
However, when adjusting the differential costs to the SUI of each DRG, the adjusted mean was €2239.22, meaning that each complicated patient costs 1.66 times more, which is very similar to data published by Vaughan-Sarracin.28 According to our point of view, the correction of costs according to the SUI of each DRG adapts the calculation to the efficiency of the Unit, adjusting the figures to efficiency, which is somewhat more realistic.
Some authors justify the increase in costs due to the increase in stays, although if properly analyzed, the increase in stays is greater than the increase in costs.1
The most frequent complications were infectious, as in other studies,1 which occurred in 6.6%, usually coinciding with more complications.2 The remaining complication types followed the same distribution as in other reports, although with different grouping criteria. This datum is of interest, since the prevention of infections usually has a significant impact; therefore, efficiently designed training or prevention activities will improve health outcomes and reduce costs.
According to the univariate model, all types of complications had an impact on the increase in length of stay and costs. Respiratory complications had the highest stay and cost, although after adjusting the differential cost with the SUI, its impact was less than cardiovascular complications, among others. This can be explained by the fact that they are usually the most complex complications. In fact, in the multivariate analysis, respiratory complications and admission to the ICU had the highest multiplying coefficient in the hospital stay estimation equation, although R2 explains a small percentage.
When we analyzed hospital stay, cost and differential cost with the Clavien-Dindo grade,26 a correlation was found between severity (except death) with the hospital stay, with results similar to their validation study. Unlike these authors, our study of the costs of the episodes demonstrated a statistically significant increase as the severity increased (also except death). This correlation is not as clear in reference to the differentials adjusted by SUI, probably because of the impact that hospital stay itself, and as an independent factor, may have on the episode costs.
The need for admission to the ICU, reoperation and death, individually, increase hospital stays, costs and the differential cost, although the multivariate analysis shows the impact of death on decreased hospitalization and the impact of death or reoperation on cost savings (differential of negative cost). And this is logical, because death itself is a sort of unexpected discharge; the same is true for reoperation, which may possibly resolve the complication more quickly. Depending on whether the death is early or late with regards to the period of stay, very different costs may result.1
Another interesting question is the analysis of the possible correlation between vacations and complications, with consequences in hospital stays and costs. In addition to the summer vacation period, in our city there are three short periods – Christmas holidays, Holy Week and April Fair – that entail a decrease in programmed activity, an increase in urgent activity (although not in absolute numbers), and an increase in substitutions of support staff, with a probability for more adverse events due to inexperience, less skill development or simply a decrease in resources. In fact, there are studies that correlate weekend admissions with higher mortality in the following 48h, possibly due to some of the reasons explained above.29,30 The difficulty to maintain continuity of care in these periods is another factor to be considered.31 The comparison of patients admitted in non-vacation periods with others showed a higher percentage of complications, MHS, costs and differential cost in patients admitted during vacation. By separating the summer period from the other three (grouped), the same results were maintained for the summer, but not for the other groups. However, when we compared only the complicated cases, we did not find significant differences between the hospital stays, costs or the differential costs. Therefore, complications occurring during vacations do not increase hospital stays, nor do they cost more than hospitalizations in non-holiday periods. The explanation for the increase in complications lies in the increased complexity of the episodes during vacations, a period in which the scheduled activity of less complex surgeries decreases, and the number of episodes involving neoplasms and urgent admissions increases.
As limitations, we assume the possibility of error in the real calculation of the hospital stays and cost of episodes with readmission within 30 days due to episode complications, because we have not calculated the sum of the hospital stays of both episodes or the cost of the sum of both, which is what perhaps should be imputed to the complicated episode (considering both as a single episode). The analytical accounting method itself can be a source of error if we consider that the system of total aggregate costs by DRG can have errors in the allocation of indirect costs, which depend on factors such as who entered the data or errors associated with the quality of coding, which is clearly influenced by the quality of the discharge reports.32 What would be closest to reality would be a cost calculation system based on direct imputation, as in the private model, which is more precise but also more expensive. Likewise, the possibility that some complications may have been included in several different types induces a classification bias that would modify the results. Regarding the results obtained from the multivariate analysis, the respective determination coefficients were low in the three models, predicting 30.57% of the calculated cost in the best of cases.
The contribution of this present study is that it may serve as a reference for the calculation of costs adjusted by DRG and by hospital stay, which would enable comparisons with other public hospitals. It also provides an analysis with few precedents about the presence of complications during vacation periods and their costs, which could be an interesting line of future research, with a more refined design of the variables to be considered. Likewise, future research could consider the impact on the reduction of costs of certain actions that minimize the percentage of complications, according to the calculations obtained. For example, calculate how much would be saved by decreasing surgical infections by a percentage point of (knowing how much this decrease in resources costs us). In short, this study establishes a baseline calculation costs for different situations, which can be corrected and compared as a reference.
ConclusionsThe presence of complications after surgery increases hospital stays 3.66 times compared to uncomplicated cases. The costs of complicated episodes are higher than uncomplicated episodes, both globally and adjusted for SUI. The most frequent complications are infectious (2/3 of the total), while the multivariate study has shown that respiratory complications and ICU admissions are the factors with the greatest impact on hospital stays. The Clavien-Dindo severity grade correlates with the increase in hospital stay and costs, with the exception of grade V (death). The complications, stays and costs of episodes during the holiday period are higher than in patients admitted during non-holiday periods. However, these complications are neither more expensive nor generate more stays than those of non-holiday periods.
Conflict of InterestThe authors have no conflict of interests to declare that could modify the results or conclusions.
Please cite this article as: Gomez-Rosado J-C, Salas-Turrens J, Olry-de-Labry-Lima A. Análisis de los costes económicos asociados a las complicaciones en cirugía general y digestiva. Cir Esp. 2018;96:292–299.
The complete version of this article has been presented as a Master's degree final project of the 9th edition of the Master's Program of Healthcare Economics and Administration of Healthcare Organizations offered by the Andalusian School of Public Health and the University of Granada. This manuscript is a summary of the mentioned final degree project.
articles

Cirugía Española (English Edition) follows the Recommendations for the Conduct, Reporting, Editing and Publication of Scholarly Work in Medical Journals