


Compacted soil walls provide environmental benefits due to their low impact and embodied energy. Although their mechanical strength is lower than other materials, they meet safety requirements. Current trends promote circular economy solutions, such as waste reuse. This study assesses recycled glass in lime- and cement-stabilized rammed earth as a replacement for natural sand to enhance waste management and soil properties. Ultrasonic inspection confirms increased compressive strength and density, especially in cement-stabilized mixtures. Statistical analysis reveals a direct correlation between crushed glass content and improved properties. The optimal replacement rate is 75% for lime and 100% for cement. The superior performance in cement-stabilized samples is due to a pozzolanic reaction absent in lime mixtures. Both binders show significant reductions in thermal conductivity, improving energy efficiency without compromising structural integrity. Ultrasound proves reliable for predicting compressive strength and stiffness, supporting the viability of this approach. The incorporation of recycled glass in compacted soil offers a sustainable construction alternative, balancing environmental benefits with enhanced mechanical and thermal performance.
Los muros de suelo compactado ofrecen beneficios ambientales por su bajo impacto y energía incorporada. Aunque su resistencia mecánica es menor que otros materiales, cumplen con los requisitos de seguridad. Las tendencias actuales fomentan soluciones alineadas con la economía circular, como la reutilización de residuos. Este estudio evalúa el uso de vidrio reciclado en tierra compactada estabilizada con cal y cemento como sustituto de la arena natural para mejorar la gestión de residuos y las propiedades del suelo. La inspección ultrasónica confirma un aumento en la resistencia a compresión y la densidad, especialmente en mezclas estabilizadas con cemento. El análisis estadístico revela una correlación directa entre el contenido de vidrio triturado y la mejora de propiedades. La tasa óptima de sustitución es 75% para cal y 100% para cemento. El mejor desempeño en mezclas con cemento se debe a una reacción puzolánica ausente en las de cal. Ambos aglomerantes reducen significativamente la conductividad térmica, mejorando la eficiencia energética sin afectar la integridad estructural. El ultrasonido resulta fiable para predecir la resistencia y rigidez, validando esta estrategia. La integración de vidrio reciclado en suelo compactado es una alternativa sostenible, combinando beneficios ambientales con mejoras mecánicas y térmicas.
The construction with soil may seem a simple technology [1], but these techniques have been developed and improved to provide better process performance. It is also a cleaner, healthier and less energy-consuming process than others, such as brick making, in which a firing phase is necessary. The techniques differ by the application and handling of the material. Two large groups can be distinguished, one of them in which the construction with earth supports a load and the other where the soil is only a filler. In the first group are techniques such as rammed earth, adobe, cob and compressed earth block (CEB).
The CEB is similar to adobe, but in this case, the soil is subjected to high static pressure, which increases the compressive strength of the material. They are building blocks made from a mixture of soil, sand and clay, and may also contain lime or cement as a stabilizer. Since they are built-on-site the technical requirements are low in comparison to CEBs. Moreover, rammed earth walls are made by dynamic pressure with low energy per impact, hence the formwork does not need to withstand extreme forces. In both cases they share similar physical–mechanical properties.
The earthen walls have an advantage providing a high thermal insulation capacity [2,3], they regulate the environment of the house in a natural way. The CEB and rammed earth are not fired, so they preserve the original properties of the earth walls, regulate humidity and accumulate heat. This compacting technique can also be carried out in situ, whenever the construction site allows it, by means of a compression machine. To produce the CEB and rammed earth, only about 1% of the energy required to make a conventional brick is needed, with minimal CO2 emissions. Another advantage is that compressed earth walls maintain a constant relative humidity of around 50%, requiring less energy to heat them than in a traditional building [4].
The incorporation of aggregates from waste is an alternative that has been investigated with the aim of improving the properties of the final product and increasing its sustainability [5–7]. The possibility of incorporating crushed glass is a simple and clean option that, according to previous research, will improve the thermal insulation capacity [8]. Waste glass has traditionally been used in compacted soil, as a substitute for sand in concrete [9] and geotechnical products, mostly as a filler material, as a plasticity modifier [10], although in those cases where an alkaline activator is incorporated, such waste can also develop chemical stabilisation capacity depending on its particle size [11–13]. Other authors have reported reductions in thermal conductivity of around 38% for lightweight concretes with the incorporation of 45% glass [14].
The mean value of the thermal conductivity of rammed earth wall can be defined in the range 0.5–1.7W/mK [15], which indicates a relatively poor thermal performance of rammed earth walls. In relation to thermal conductivity, the thermal conductivity coefficient of glass from domestic sources is estimated at an average value of 0.8W/mK, although this can vary depending on the characteristics and origin of the material [8], so its incorporation into rammed earth elements contributes to the thermal conductivity of these being at the lower end of the range [16,17].
The incorporation of glass in compressed earth walls has also been studied in order to improve particle stabilisation and to obtain an increase in mechanical capabilities [18]. For example, powdered glass has been used by an alkaline activation process [6,11] to achieve substantial improvements in compressive strength and durability. Alkaline activation has also been used to improve the consolidation of earth mortars for restoration [19] with valid results for low alkaline concentrations. Alkaline activation has also been considered for rammed earth [20] and for CEB [21] but without including the incorporation of recycled or powdered glass [22]. In both cases, it is highlighted that this type of chemical reaction provides a better bonding matrix and therefore a higher mechanical performance.
Since there is scarce research on the incorporation of recycled glass in construction techniques using compacted earth, the aim of this research is the analysis of the physical–mechanical performance of incorporating crushed glass in stabilised rammed earth. Physical and mechanical properties will be evaluated, depending on different percentages of substitution of the finer fractions of natural aggregate. The research aims to determine whether there are significant improvements in the aforementioned properties and, if so, what percentage of glass substitution would be optimal, assessing its advantages and disadvantages.
Material and methodsThe soil used in this study was artificial manufactured from separated fractions so that a homogeneity is achieved between different batches. The soil is composed by a mix of gravel, coarse and fine sands and clay. The lime was purchased from a local company while the clay came from a specialised manufacturer (Sio-2®), who supplied it in powder form so that it could be easily mixed dry with all the aggregates. The chemical analyses of the clay AFN from Sio-2 are depicted in Table 1. The mineralogical composition of the clay is shown in Fig. 1 and its quantification in Table 2.
Chemical analysis of the AFN clay, according to manufacturer data-sheet and Atterberg limits.
| Chemical analysis (%) | Plasticity | ||||||||||
|---|---|---|---|---|---|---|---|---|---|---|---|
| SiO2 | Al2O3 | Fe2O3 | TiO2 | CaO | MgO | Na2O | K2O | MnO | L.O.I. | L.L. | P.I. |
| 57.59 | 17.63 | 6.38 | 0.39 | 3.40 | 2.14 | 0.18 | 3.16 | 0.08 | 8.75 | 34 | 15 |
L.O.I.: lost on ignition; L.L.: liquid limit; P.L.: plasticity index.

Crushed glass was studied as substitute of sand, maintaining the established percentage of gravel. The crushed glass was provided by Ravsa S.A., a glass recycling company. The glass was crushed, by a mechanical grinding machine. Aggregate sizes larger than 4mm were removed.
A soil type was designed that was composed of 15% gravel, 50% coarse sand, 20% fine sand and 15% clay, which were dry-mixed prior to the preparation of the specimens. According to UNE-EN 9333-1 sieving method, these proportions comply with a particle size distribution of good compactness, since as can be seen in Fig. 2A, the curve corresponding to the soil has no discontinuities and remains close to its corresponding Fuller and its fineness modulus (4.29) is similar to that of its Fuller (4.79). The crushed glass that will replace the sand fractions is represented in Fig. 2B, where the similarity of both aggregates is observed.
 and soil with processed glass (B).")
The experimental design considered the partial and total substitution with crushed glass of the sand fractions. As the intention is to analyse the behaviour of glass as a substitute for aggregate, 50, 75 and 100 percentages were sought in order to observe possible changes in behaviour. In addition, a reference dosage without glass was considered. This glass is a by-product from laminated pans of glass and was chemically characterized by means of X-ray fluorescence (XRF) in a Panalytical X-ray fluorescence spectrometer (AXIOS) with Rh tube for elemental solid sample analysis (Table 3). The analyses were carried out on pearl processed at 1200°C using lithium metaborate and lithium tetraborate as fluxes in a ratio of 34/66. The flux/sample ratio used was 9/1.
Chemical analysis of glass.
| Elements | |||||||||||||
|---|---|---|---|---|---|---|---|---|---|---|---|---|---|
| SiO2 | Na2O | CaO | MgO | Al2O3 | K2O | SO3 | Fe2O3 | TiO2 | MnO | P2O5 | LOI | ||
| % | 72.21 | 13.05 | 9.98 | 3.46 | 0.76 | 0.34 | 0.3 | 0.26 | 0.07 | 0.03 | 0.01 | 0.46 | |
| D.L. | 0.02 | 0.01 | 0.03 | 0.02 | 0.01 | 0.01 | 0.01 | 0.04 | 0.01 | 0.01 | 0.01 | ||
| C.L. | 0.03 | 0.02 | 0.05 | 0.03 | 0.02 | 0.02 | 0.02 | 0.06 | 0.02 | 0.04 | 0.02 | ||
| Rel.E. | 0.019 | 0.073 | 0.0100 | 0.029 | 0.011 | 0.038 | 0.137 | 0.023 | 0.106 | 0.050 | 0.026 | ||
| Traces | F | Ba | S | P | Zn | Pb | Cr | Sr | Zr | Mn | Sn | Cs | Cu |
| Ppm | 1211 | 1200 | 1076 | 144 | 84.8 | 66.6 | 64.5 | 59.5 | 57.1 | 52.1 | 32.2 | 27 | 26 |
D.L.: detection limit; C.L.: cuantification limit; Rel.E.: relative error.
This soil was stabilized by Portland cement (C) and hydraulic lime HL5 (L), both in a percentage of 5% by mass of dried soil, being within the optimal range stated by several authors [23–25]. These conditions, as well as the names of each dosage, are listed in Table 4.
Distribution and description of each dosage for the experimental phase (-R, stands for reference group).
| Batch | Number samples | Stabilization | Glass |
|---|---|---|---|
| C-R | 6 | Cement (5%) | – |
| C-50 | 6 | Cement (5%) | 50% |
| C-75 | 6 | Cement (5%) | 75% |
| C-100 | 6 | Cement (5%) | 100% |
| L-R | 6 | Lime (5%) | – |
| L-50 | 5 | Lime (5%) | 50% |
| L-75 | 6 | Lime (5%) | 75% |
| L-100 | 6 | Lime (5%) | 100% |
The mixing moisture or optimum moisture content (OMC) is critical to achieve optimum compaction. According to previous research, the determination of this moisture content is usually performed by means of the UNE-103500 standard or modified Proctor test [26] or their equivalents according to ASTM D698-12 standard [27]. In this case, four Proctor tests have been prepared for two types of stabilization and for the cases of 100% glass and no glass substitution, shown in Fig. 3. In Fig. 3A and B, it can be seen that the moisture contents are very similar for all cases and are around 8%, except for the cement with glass, which is reduced to 7%. Since the differences are so small and considering the difficulty of precisely controlling this margin during manufacture, it was decided to work with an OMC equal to 8%.
 and lime (B).")
Once the starting parameters were defined, the manufacture and curing of the test specimens was developed. First, each soil and glass fraction were oven-dried for 24h at less than 100°C, so that the mineralogical components were not affected and to ensure that all mixtures started from the same moisture content before mixing. The aggregate fractions corresponding to each dosage were then dry-mixed, and the stabilizer (cement or lime) was added to achieve a uniform mixture. According to the dry weight produced and having previously checked the moisture content of the aggregates, the necessary water was added until the OMC was reached. The mixing was carried out in a pan concrete mixer that allows working adequately with low water–stabilizer ratios and drier textures. The mixture was then compacted in the moulds in four layers of about 5cm thickness. Once the first 3 layers had been compacted, a plastic film was applied before the last layer was compacted. In this way, a 15×15×15cm test specimen, called A, and another 15×15×5cm specimen with the same compaction, called B, could be obtained for the tests (Fig. 4).

In order to maintain uniformity in the rate of compaction of all the specimens, the procedure developed by the authors [28] was followed, but adapted to the use of a jackhammer, for which the methodology described by [24,29] is taken as a reference. Basically, it consists of establishing a relationship between the specific compaction energy of the standard Proctor test and that of the mechanical tools used. For this purpose, the hammer manufacturer's data were considered, with the number of blows (b) per minute (nb) being 26 b/min, according to an intermediate speed configuration, and the energy per impact being j=1J. By equating the specific compaction energies from the Proctor and the experiment, Eq. (1) can be obtained, which describes the time required to compact a 5cm layer of material with the hammer described. In our case tmin=14.26s, so the compaction time was controlled at 15s per layer, during which the hammer, which had a compaction surface of 5×5cm, covered the entire surface of 15×15cm of the test specimen.

Vm being the volume of the specimen layer (m3), VOMC the volume of the standard Proctor test layer (m3), nOMC the number of blows per Proctor layer – which is 26 blows, nb is the number of blows per minute of the hammer, m is the mass of the Proctor hammer (2.5kg), g is the acceleration of gravity in ms−2, h is the height at which the Proctor hammer falls (0.305m) and j is the energy per blow of the hammer (Joules).
After finishing three successive layers, which formed the type A test sample, before pouring the mixture, the plastic film was placed to separate the fourth 5cm layer, thus defining the type B test sample. After demoulding, the samples were left to dry during 28 days under the same environmental conditions (20±2°C and 65±5% relative humidity). The tests carried out on each type of specimen are described below.
Specimens B were intended for tests to determine the bulk density and open porosity, by means of a water saturation method in vacuum, following the procedure provided in UNE-EN-1936 standard [30].
The thermal conductivities of the samples were determined by using a test set-up manufactured by PHYWE Systeme GmbH & Co. KG [31]. This same set-up has been used by several researchers to measure the thermal conductivity of concretes [32] and earth building materials [33]. The equipment consists of a 40cm side house, thermally insulated, which contains a heat source in its interior. The side walls of the house have 21cm square openings, and the samples to be tested can be fixed from the inside against the openings using tensioning screws. Since the frontal area of our samples (type B specimens, 15×15cm2) was smaller than the apertures on the side walls, the samples were mounted in a 4cm thick polyurethane frame.
During the experiments, type K thermocouples were used to measure the air temperature in the laboratory (Tair), the temperature at the center of the external surface of the sample (Tout) and the temperature at the center of the internal surface of the sample (Tin). A tiny amount of thermal grease (HY710, Shenzhen Halnziye Electronics Co.) was applied at the contact points between the thermocouple tips and the solid surfaces to improve the thermal contact. All temperatures were recorded over time using a high-resolution data logger (TC-08, Pico Technology) connected to a PC, until steady-state conditions were reached (6–8h). At that moment, the heat flux through the sample per unit area q (W/m2) can be obtained as
where Rs is the surface thermal resistance of the air boundary layer next to the sample, and e and λ are the thickness and the thermal conductivity of the sample, respectively. Here, according to the standard ISO 6946:2017 [34], the conventional value Rs=0.13m2K/W for horizontal heat flow through a plane surface will be assumed. The thermal conductivity of the sample can then be obtained as,

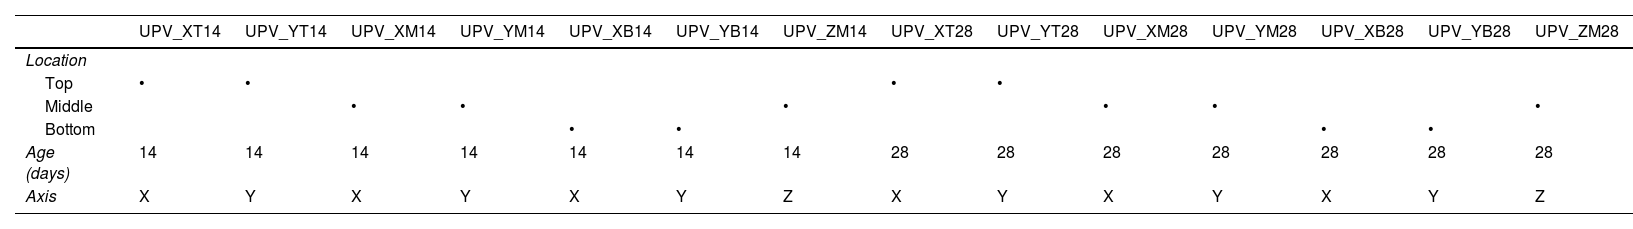
Ultrasonic pulse velocity (UPV) tests were performed on A samples with a Pundit Lab system from Proceq company, equipped with two 54kHz piezoelectric sensors. The procedures established in the UNE-EN 12504-4 standard were followed in this testing [35]. Since ten readings are taken at each location, a variability range of ±2% from the mean value was therefore taken. After this check, some atypical values were discarded, so that the average of all the filtered readings in each UPV direction and location studied was obtained. This criterion was taken into account to determine the ultrasonic pulse velocities UPV-X and UPV-Y, for those directions perpendicular to the compaction direction, and UPV-Z for the compaction direction. In addition, three heights were differentiated in the X–Y plane, depending on whether the transducers were located at the base (B), in the middle (M) or at the top (T) of specimen A (Fig. 5). Measurements at 14 and 28 days were taken in order observe and check the evolution and certain trends [28]. However, the mechanical test was only possible to carry out at 28 days, hence lectures of UPV at 14 days will serve as a simple checking of the internal evolution of the samples. Table 5 describes the list of UPV variables initially considered in this research.

Description of the different UPV readings taken in accordance with location, age, and direction.
| UPV_XT14 | UPV_YT14 | UPV_XM14 | UPV_YM14 | UPV_XB14 | UPV_YB14 | UPV_ZM14 | UPV_XT28 | UPV_YT28 | UPV_XM28 | UPV_YM28 | UPV_XB28 | UPV_YB28 | UPV_ZM28 | |
|---|---|---|---|---|---|---|---|---|---|---|---|---|---|---|
| Location | ||||||||||||||
| Top | • | • | • | • | ||||||||||
| Middle | • | • | • | • | • | • | ||||||||
| Bottom | • | • | • | • | ||||||||||
| Age (days) | 14 | 14 | 14 | 14 | 14 | 14 | 14 | 28 | 28 | 28 | 28 | 28 | 28 | 28 |
| Axis | X | Y | X | Y | X | Y | Z | X | Y | X | Y | X | Y | Z |
The compressive strength of A-type specimens was obtained after curing for 28 days. The compression tests were carried out using a universal monoaxial testing machine.
The loading history was established considering UNE-EN 14580:2006 Standard [36]. The amplitudes of the loading–unloading processes were defined by load levels, but they were displacement controlled at 1mm/min rate.
The UPV measurements in the cement and lime samples, and the corresponding 50%, 75% and 100% subgroups, were used to determine the dynamic modulus of elasticity “MOE” E (MPa) according to Eqs. (4) and (5), which depend on UPV v (m/s) and density ρ (kg/m3). The relationship between UPV and MOE in rammed earth materials has been validated by previous research [37]:
where v is Poisson's ratio, whose value was set at 0.35 as proposed by other authors [37,38].

Finally, a statistical analysis of the results (independent samples T-Student test) is carried out to establish the possible existence of statistically significant differences in the physical and mechanical values between the groups of reference specimens and those corresponding to the different degrees of glass substitution. If the test is positive, it could be affirmed that the substitution of sand by glass has a statistically decisive influence on the analysed property.
Results and discussionPhysical resultsTable 5 shows the descriptive statistics of the bulk density and open porosity values obtained for the different mixes. Except for the case of porosity for the cement-based mixes, the reduced standard deviation and coefficient of variation values describe a representative and uniform data set. It can also be stated that the average values are as expected for this type of material [24,39], the densities being similar to those established by the Proctor test (Fig. 2) for the dosages without glass and 100% replacement.
Fig. 6 shows that in the case of cement, the median density increases slightly with increasing the degree of glass substitution, reaching 2.01g/cm3. Consequently, the porosity decreases to a minimum of 21.18%, which defines a low porosity wall, in line with the minimum range established for both new [40] and historical [41] compacted soil-based materials. In contrast to this trend, the behaviour of the lime-based specimens shows a progressive reduction in density as a higher percentage of glass replacement is used, down to a minimum of 1.82g/cm3. The porosity, however, presents the minimum at the 50% substitution (L-50: 25.77%), being in any case always higher than those using cement. From this dosage of glass onwards, the samples increase their porosity until they reach values of more than 30% for L-75. Therefore, with regard to the physical behaviour, there seems to be a differential response depending on the stabilizer used, and the degree of glass substitution induces, from a descriptive point of view, an influence on density and porosity (Table 6).
 and open porosity (B) according to the type of stabilization method and the percentage of glass.")
Statistical results of physical properties of samples.
| N | Density (g/cm3) | Porosity (%) | |||||
|---|---|---|---|---|---|---|---|
| AV | SD | VC | AV | SD | VC | ||
| C-R | 5 | 1.96 | 0.08 | 0.04 | 23.50 | 2.87 | 0.12 |
| C-50 | 5 | 1.96 | 0.04 | 0.02 | 23.79 | 2.23 | 0.09 |
| C-75 | 5 | 1.99 | 0.08 | 0.04 | 24.23 | 2.21 | 0.09 |
| C-100 | 5 | 2.01 | 0.03 | 0.02 | 21.18 | 2.40 | 0.11 |
| L-R | 6 | 1.91 | 0.04 | 0.02 | 26.72 | 0.98 | 0.04 |
| L-50 | 5 | 1.92 | 0.03 | 0.02 | 25.77 | 0.99 | 0.04 |
| L-75 | 4 | 1.85 | 0.03 | 0.01 | 28.86 | 1.05 | 0.04 |
| L-100 | 6 | 1.82 | 0.02 | 0.01 | 27.56 | 0.86 | 0.03 |
N: number of data; AV: average; SD: standard deviation; VC: variation coefficient.
The statistical analysis on the physical properties shows that when cement is considered, there is no significant variation in density and porosity for any of the glass substitutions (C-50, C-75 and C-100) with respect to the reference (C-R). However, when lime is used, there are significant variations in density for L-75 [t(8)=26.127, p=.000] and L-100 [t(10)=4.6989, p=.0008] and in porosity for L-75 [t(8)=−3.4699, p=.008]. This means that, when cement is used, it cannot be statistically proven that the substitution of glass has a decisive influence on the physical properties, although, as shown in Fig. 5, there is a slight progressive increase in the density averages and consequent reductions in porosity. When crushed glass is used, pozzolanic reactions can occur in the presence of the calcium hydroxide of the cement, which generates new compounds (hydrated calcium silicates) that are deposited in the pores of the material [42]. When using lime, as there are more pronounced variations at higher glass substitutions (75% and 100%), it is statistically possible to state that glass can decisively alter the physical properties.
Mechanical resultsTable 7 shows the descriptive statistics of the simple compressive strength values at 28 days obtained for the different percentages of glass substitution, according to each type of binder. In all cases, the mechanical strength is higher for cement, as has been reported in other studies [43], with the difference between the two being of the order of 100% and reaching more than 200% when the glass substitution is 100%.
Statistical results of unconfined compression strength of samples.
| N | UCS (MPa) | ||||
|---|---|---|---|---|---|
| AV | SD | VC | Δ % | ||
| C-R | 6 | 2.19 | 0.50 | 0.23 | – |
| C-50 | 6 | 3.00 | 0.69 | 0.23 | – |
| C-75 | 6 | 3.90 | 1.20 | 0.31 | – |
| C-100 | 6 | 4.07 | 1.23 | 0.30 | – |
| L-R | 6 | 0.78 | 0.30 | 0.38 | 109 |
| L-50 | 5 | 1.61 | 0.39 | 0.24 | 86 |
| L-75 | 6 | 1.83 | 0.25 | 0.14 | 113 |
| L-100 | 6 | 1.31 | 0.21 | 0.16 | 210 |
N: number of data; AV: average m/s; SD: standard deviation; VC: variation coefficient; Δ %: percentage difference of mean values between cement and lime samples.
In general, the dispersion of results is as expected for this type of heterogeneous materials, with CVs between 15 and 25%, except in the case of C-75 and C-100, which rise to 30% [28,44,45], while for lime (Fig. 7A) the dispersion is smaller, with the percentiles being more clustered around the mean of each group.
. Relation between UCS and density according to the type of chemical stabilizer (B).")
Regarding the use of lime, it is observed (Fig. 7) that there is a maximum UCS in the substitution L-75, with an average of 1.83MPa, the standard deviation and the coefficient of variation being lower than in the case of cement. This trend is not followed by cement, which shows a progressive increase in mechanical strength until complete substitution with glass. The better mechanical behaviour of the cement specimens can be related to the higher density and lower porosity (Figs. 6 and 7B). As other studies have reported, the fine particles of glass provide higher adhesion due to the pozzolanic effect [42,46,47]. The hypothesis of the formation of hydrated neosilicates by alkaline activation can also be considered. According to Harrison et al. [48] alkaline activation occurs with glass when its size is less than 20μm, which improves the mechanical behaviour when the chemical reaction takes place. In addition, the use of crushed glass provides an aggregate with angular shapes that improves mechanical performance for aggregate compaction [49] and, together with the formation of the hydrated components of the cement, allows higher levels of mechanical strength to be achieved.
According to the UCS statistical study, when considering the use of cement, there is significant variation for 75% glass substitution, C-75 [t(10)=−3.2205, p=.0092] and C-100 [t(10)=−3.4587, p=.0061]. For lime, the variation is more pronounced in all glass substitution grades, L-50 [t(9)=−3.9959, p=.0031], L-75 [t(10)=−6.6071, p=.00012] and L-100 [t(10)=−3.5738, p=.0051]. Therefore, it can be stated that the partial substitution of aggregates by crushed glass has a direct relationship with the change in mechanical behaviour and that it is in lime where these changes, at the statistical level, are more appreciable.
Thermal propertiesFig. 8 shows the average values of the thermal conductivity (l) for each dosage of crushed glass, showing a gradual reduction with increasing glass content, except in the particular case of the use of lime for L-100, which remains significantly the same as for L-75.

Thermal conductivity of dry-state, non-glass rammed earth without additions [50,51] is in the range of that reported in this research. On the other hand, glass has a reported thermal conductivity of 0.4–0.9W/mK [52], depending on its composition, being significantly lower than that normally reported for the rammed earth (0.6–1.6W/mK, according to Ref. [51]), it is possible that the use of glass reduces the value of the whole. In cement mortars, it has been observed that the incorporation of glass as a partial replacement of aggregate, up to 50% of the aggregate, reduces the thermal conductivity by one third of the initial value [53].
Fig. 8 shows the behaviour of the reference wall and the different degrees of substitution with glass, both for the use of cement and lime. For both cases there is a very similar reduction in conductivity, which at 75% substitution reaches a decrease of 36% for the lime and cement dosages. When 100% substitution with cement as a stabiliser is used, a 78% reduction of the initial thermal conductivity is achieved. However, the thermal conductivity becomes stable for the lime stabilized specimens (L-R to L-100) when the aggregate substitution exceeds 75% (L-75). If we compare this fact with the porosity trend reported in Fig. 5, a coincidence is observed, since the increase in porosity for the case of lime corresponds to a reduction in thermal conductivity. The minimum conductivity achieved for the L-75 and L-100 groups coincides approximately with the minimum range of that reported for glass (0.4W/mK). However, when cement is used, the porosity decreases and the density increases, which is not consistent with the reduction in thermal conductivity. In other research researches [53], where cement is used, a reduction in conductivity associated with a reduction in porosity has been reported, as is also the case for the lime specimens.
When type C-100 is treated, the reduction in conductivity is even greater than the minimum values for glass, so there must be other factors that need to be investigated in further studies.
Ultrasonic pulse velocityA statistical treatment of the results obtained in all directions analysed has been carried out (see Fig. 4 and Table 4) in order to establish correlations between them and to discard redundant measurements, if applicable.
A statistical treatment has been carried out on the results obtained in all the directions analysed (see Fig. 5 and Table 5), so as to establish correlations between them and to discard, if necessary, redundant measurements.
To analyse whether the results between the pairs of UPV_X and UPV_Y directions are dependent, the related samples T-Student test is performed (Table 8). As the degree of significance value (p-value) is always greater than 0.01, the null hypothesis is satisfied and therefore there is no difference between the two readings, so they are interchangeable. It is decided from this point on to reduce the number of ultrasound variables, working with an XY average for each position – top, middle and bottom – and ages 14 and 28 days.
T-Student's t-test values for related samples according to UPV reading direction.
| Pair of variables | t | df | p | |
|---|---|---|---|---|
| Pair 1 | UPV_XT14 – UPV_YT14 | −0.747 | 23 | .462 |
| Pair 2 | UPV_XM14 – UPV_YM14 | 0.126 | 23 | .901 |
| Pair 3 | UPV_XB14 – UPV_YB14 | 0.646 | 23 | .525 |
| Pair 4 | UPV_XT28 – UPV_YT28 | −0.436 | 23 | .667 |
| Pair 5 | UPV_XM28 – UPV_YM28 | −1.406 | 23 | .173 |
| Pair 6 | UPV_XB28 – UPV_YB28 | −1.772 | 23 | .090 |
t: t-statistic; df: degree of freedom; p: significance value (p-value).
A similar procedure is followed to analyse whether the values according to the positions top, middle and bottom, considering the ages (14 and 28 days) are independent, for which the T-Student test for related samples is performed again, showing the values in Table 9. Except for the use of lime at 14 days and XYM-XYB, pP is less than 0.01, so the null hypothesis is satisfied and there is no difference between the pairs considered. Therefore, the variables for UPV according to top, middle and button position are interchangeable. Consequently, the average UPV for the three positions for each age of 14 and 28 days will be considered, integrating the initial variables in UPV for XY-14, XY-28, both for lime (L−) and cement (C−) and the respective substitution percentages (R, −50, −75 and −100).
T-Student's t-test values for related samples by UPV reading position direction.
| Type | Age | Pairs | t | df | p |
|---|---|---|---|---|---|
| Lime | 14 | XYT-XYM | 0.6740 | 18 | .5090 |
| XYT-XYB | −2.1570 | 18 | .0450 | ||
| XYM-XYB | −3.586 | 18 | .002 | ||
| 28 | XYT-XYM | −0.663 | 16 | .517 | |
| XYT-XYB | −1.68 | 16 | .112 | ||
| XYM-XYB | −1.692 | 16 | .11 | ||
| Cement | 14 | XYT-XYM | −0.9720 | 23 | .3410 |
| XYT-XYB | −0.4550 | 23 | .6530 | ||
| XYM-XYB | 0.688 | 23 | .499 | ||
| 28 | XYT-XYM | −1.404 | 23 | .174 | |
| XYT-XYB | −2.068 | 23 | .05 | ||
| XYM-XYB | −0.481 | 23 | .635 | ||
t: t-statistic; df: degree of freedom; p: significance value (p-value).
Fig. 9 shows the average values of UPV in the XY and Z directions for 14 and 28 days. It can be seen how UPV for the cementitious specimens is higher than for the lime in either direction at 14 days. However, at 28 days, the differences are less pronounced, as they are significantly reduced for the cementitious specimens and increased for the lime specimens.
 and 28 days (B).")
Regarding the percentage of the difference between the average values of the lime groups versus the cement groups, it is corroborated that in the reference groups is maximum and positive. However, at the age of 28 days the difference is reduced and even inverted, with the averages for lime becoming higher in the UPV readings at Z. Having used the same mixing water (8%) in all groups and starting from oven-dried soils, the initial moisture content of all test specimens would be similar.
The comparison of the UPV averages using the T-Student technique has been elaborated for the UPV XY and Z ratios of the specimens without glass with the different substitution percentages, considering the two ages (14 and 28 days) and the two binders (cement and lime). It is observed that, in the case of lime, both at 14 and 28 days, the p-value takes a value of less than 0.01 for all cases, so it can be stated that all degrees of glass substitution have a decisive influence on the ultrasonic readings. However, for cement the situation is different, except for 100_XY-14 [t(10)=−4.2630, p=.002] and 100_Z-14 [t(10)=−4.8740, p=.001], the variations of UPV are not significant for the different glass substitutions, both at 14 and 28 days. Therefore, it is statistically proven that the reductions in the physical–mechanical values of specimens with lime are mainly attributable to the substitution with glass, while for cement other factors, such as those mentioned above, could be influencing its behaviour.
Considering the age of 28 days, the specimens with lime show a similar behaviour of UPV in XY for the different glass substitutions when compared to the UCS results, for which a maximum is found at the 75% substitution (Figs. 7A and 9B), although the maximum density is reached with the L-50 substitution. However, in cement the correlation is not so clear, since UPV for 100-XY presents a reduction that in the mechanical response corresponds to a moderate increase. In fact, if the regressions between UPV and UCS are plotted, a better correspondence is observed for the UPV readings in the XY plane for lime (Fig. 10D), where the correlation coefficient R2 is 0.745, than for cement, R2 being 0.608. This unequal behaviour between lime and cement was already apparent in the statistical T-Student tests for the physical–mechanical properties, where the variation of glass is significant for lime and to a lesser extent for cement. For UPV in the Z-direction, the aforementioned regressions presented a worse fit with lower R2 coefficients. This worse response in Z is also evident for the UPV averages shown in Fig. 10, discussed above. This differential performance between XY and Z could be related to the anisotropic behaviour of the wall described by other authors [54,55]. In any case, this approach would require specific studies beyond the scope of this research.

In order to estimate the MOE it was decided to use UPV XY28, since it corresponds to the same age of UCS available values and XY represents a mean value for top, middle and bottom lectures, following similar criteria from [37]. In fact, as discussed above, these UPV XY28 readings represent a better fitting with mechanical properties. The mean values obtained for the reference samples showed MOE values 240% higher for the cementitious samples (Fig. 10). The incorporation of glass in both cases imply a progressive increase in the values of the elastic modulus up to a maximum at the 75% of glass. In the case of the cementitious specimens, the increase is as much as 30% for the 75% glass specimens. In the case of the lime specimens, the increase is 107% for the 75% glass specimens. Between the specimens with cement and those with lime, the difference in MOE obtained by the 75% glass specimens is 54%, the value obtained with cement being significantly higher.
Basic statistical results (Table 10 and Fig. 11) describe more disperse values for cement specimen, although the trends are similar in both cases, as commented before.
Statistical results of the MOE.
| N | AV (GPa) | SD (GPa) | VC | |
|---|---|---|---|---|
| C-R | 5 | 6.62 | 1.89 | 0.28 |
| C-50 | 5 | 7.04 | 1.82 | 0.26 |
| C-75 | 5 | 8.62 | 2.10 | 0.24 |
| C-100 | 5 | 7.665 | 2.70 | 0.35 |
| L-R | 6 | 2.72 | 0.51 | 0.19 |
| L-50 | 5 | 5.24 | 0.98 | 0.19 |
| L-75 | 4 | 5.62 | 0.53 | 0.09 |
| L-100 | 5 | 4.94 | 0.44 | 0.09 |
N: number of data; AV: mean value in GPa; SD: standard deviation; VC: variation coefficient.

Cement subgroups show higher stiffness than lime, which is known since lime-based materials usually presents higher deformation ratios, and therefore a lower MOE, as has been reported for the determination of the dynamic MOE of cement and lime mortars [56]. As mentioned above, the higher density and lower porosity of cement specimens may play a key role in increasing the stiffness of this group compared to lime.
UPV is related to the density and stiffness of the material [57], however it does not depend on the compressive strength [55]. In fact, this behaviour is reproduced as the performance of UPV does not present a proper fitting with UCS, especially in the case of cement specimens. Subsequent work should address the study of the static MOE by means of strain–stress plot and compare both elastic moduli to validate the results discussed.
ConclusionsIn this study, the influence of replacing fine aggregate with crushed glass of equivalent texture for compacted soil has been evaluated using two binders, cement and lime, and supported by of ultrasound as a non-destructive testing technique. The following observations can be made on the basis of the above results and discussions:
Research has confirmed that the use of crushed glass as a partial replacement of aggregate improves the physical and mechanical properties of the rammed earth. In the case of cement, the full substitution (C-100) is the dosage that gives the best values, although the C-75 replacement is very similar. When treating the groups with lime, it is the L-75 substitution that gives the best results, maximising the compressive strength and avoiding an excessive decrease in density. However, this dosage is the one with the highest porosity. These results confirm the feasibility of incorporating the recycled glass amendment resulting in a material with improved strength and good breathability, an indispensable component of safe and healthy infrastructure.
The statistical results show that the replacement of sand by crushed glass is responsible for the difference in performance recorded in the mechanical and physical aspects of the specimens with and without glass. As for the cement groups, the same statistical comparison for the T-Student tests showed more uncertainty which leads us to believe that mechanisms other than glass influence the overall performance.
It should also be noted that the thermal conductivity is significantly reduced with the progressive incorporation of crushed glass at 75% substitution, both for the use of lime and cement, the latter being the case where C-100 represents the greatest reduction. This improvement is a very important factor in the practical application of this type of building products, as the thermal insulation capacity implies significant energy savings in the long term.
It is confirmed that UPV can be used as a non-destructive technique to predict the unconfined compression performance of lime stabilized rammed earth. Regardless the direction or position of the UPV readings the data is statistically the same. Therefore, readings could be reduced in number or average values may be used to represent each UPV in rammed earth cubic specimens. However, Z direction is found to be independent of XY plane, meaning that some kind of anisotropy is recorded in rammed earth, as already stated by prior research. When dealing with cement specimens, UPV in XY plane is higher than lime dosage, independently of the age considered. Bearing in mind that the density is higher and the porosity is lower for the cement group, it is suggested that the pores may be, porous are filled by with hydrated compounds coming from the clinker and promoted by the fine silica from the crushed glass. In fact, the cement groups presented reported better mechanical performance, both in UCS and MOE.
It is confirmed that UPV can be used as a non-destructive technique to predict the unconfined compression performance of lime stabilized rammed earth. Regarding cement groups, this technique showed more uncertainty, especially when dealing with full sand substitution (C-100).
Dynamic MOE analysis revealed an increase in stiffness in the cement specimens, which is compatible with the established density increase and porosity reduction and supports the hypothesis of the generation of new cement hydration production boosted by the presence of glass silica.
The authors wish to acknowledge the work of Ángela Pardo and Guillermo López for their contribution during the manufacturing of specimens, as well as CITIUS (University of Seville Research, Technology and Innovation Centre) for the development of X-ray chemical characterization.

