


This study aimed to develop the Brazilian instrument for assessing eating disorders in children and adolescents and test its psychometric quality using item response theory (IRT).
DesignCross-sectional study.
ParticipantsParticipants aged between five and twelve years old of both sexes.
Main measuresIRT logistic model of two parameters was used to evaluate the item's severity and discrimination and test information curve of symptoms of eating disorders’ latent trait symptoms. Content validity and reliability were also assessed. The IRT evaluation suggested that the instrument contained items that performed differently concerning severity, discrimination, and test information curve presented good accuracy.
ResultsThere was agreement on the clarity of language (83.3%) and theoretical relevance (91.7%), indicating good content validity. The value of the Cronbach's Alpha was 0.63 (95% confidence interval), and the result of the Spearman–Brown test was 0.65.
ConclusionThese results indicate good performance of the screening tool in assessing the level of eating disorders in children and adolescents.
Este estudio tuvo como objetivo desarrollar un instrumento brasileño para la evaluación de los trastornos alimentarios en niños y adolescentes, y testar el análisis psicométrico utilizando la teoría de respuesta al ítem (TRI).
DiseñoEstudio observacional, transversal.
ParticipantesIndividuos de ambos sexos entre los 5 y 12 años de edad.
Mediciones principalesSe utilizó el modelo logístico TRI de 2 parámetros para evaluar la gravedad y la discriminación del ítem, y probar la curva características del test (CCT) de los síntomas del rasgo latente de los trastornos alimentarios. También se evaluaron la validez de contenido y la confiabilidad.
ResultadoLa evaluación TRI sugirió que el instrumento contenía ítems que funcionaban de manera diferente en cuanto a severidad, discriminación y la CCT presentando una buena precisión. Hubo concordancia en la claridad del lenguaje (83,3%) y en la relevancia teórica (91,7%), indicando buena validez de contenido. El valor del alfa de Cronbach fue de 0,63 (intervalo de confianza del 95%) y el resultado de la prueba de Spearman-Brown fue de 0,65.
ConclusiónEstos resultados indican un buen desempeño de la herramienta de detección en la evaluación del nivel de los trastornos alimentarios en niños y adolescentes.
Eating disorders (EDs) are multifaceted psychiatric illnesses associated with the interplay of psycho-social, biological, and genetic factors.1 EDs are a growing interest given the increased incidence.2 There are few studies on the prevalence of EDs that encompass the Brazilian population. However, a systematic review and meta-analysis carried out in 2016 described the lifetime prevalence of EDs in the Brazilian population, with 2.0% (0.9%) for bulimia nervosa (BN) and 4.7% (1.8%) for binge eating disorders (BED).3
Among the instruments validated for screening EDs in Brazil are the Eating Attitudes Test4,5; the Bulimic Investigatory Test6; the Children's Eating Attitudes Test,7 the Body Shape Questionnaire,8 and the Disordered Eating Attitude Scale.9 None of these instruments screens AN, BN, and BED together in children.3
In light of this lack of instruments for assessing these EDs, this study aimed to develop the Brazilian instrument for assessing eating disorders in children and adolescents (Brazed) and test the psychometric quality using item response theory (IRT) model.
MethodsStudy designThis is a cross-sectional study that follows the recommendations of the Strengthening the Reporting of Observational Studies in Epidemiology (STROBE) checklist.9
Instrument developmentThe research was conducted in three stages:
- Stage 1
Development the Brazilian instrument for assessing eating disorder in children and adolescents (Brazed).
- Stage 2
Development of IRT model to eating disorder symptoms measurement with Brazed.
- Stage 3
Evaluation of the content validity and reliability of the Brazed.
To develop the instrument, the following characteristics were considered: the feasibility of applying the instrument among the target population, particularly in children over five, a reduced and sufficient number of questions for assessing AN, BN, and BED.
In addition to these characteristics, a search was conducted in main health literature databases to identify the validated questionnaires that aimed to assess risk symptoms of EDs: AN, BN, and BED. Moreover, the symptoms described in the 5th edition of the Diagnostic and Statistical Manual of Mental Disorders2 and International Classification of Diseases10 for EDs were also considered. After this search, the more relevant items to the latent being studied were chosen and adapted to the target population.
ParticipantsParticipants were children and adolescents aged between five and twelve years old.
Ethics approval and consent participantThis study was approved by the ethics committee of the Pontifícia Universidade Católica do Rio Grande do Sul – PUCRS (CAAE: 81021317.9.0000.5336). All children and their parents formally agreed to participate in the study. All parents provided informed consent and children and adolescents assent forms.
Data collectionThe participants were recruited through convenience sampling from private and public schools, sports, and media. The sample included participants from different socioeconomic levels. Data collections were performed using a physical and online version of the instruments. The online version of the instrument was done on the Qualtrics platform and was identical to the physical version (Qualtrics, 2020, Provo, UT, USA).
Latent trait of the instrumentThe latent trait in this study is eating disorder symptomatology.
OutcomesDevelopment and psychometric evaluation of a Brazilian instrument for assessing eating disorder symptoms in children and adolescents (Brazed).
DemographicThe demographic variables were obtained through a structured interview that included age (in years), sex (male, female), self-reported skin color (categorized into white, black, others – brown and yellow), and average family income in Brazilian currency (R$=reais).
Measures: body mass index (BMI)The BMI classification was carried out using the BMI Z score, calculated based on the World Health Organization reference values according to age and sex.11
Data analysisItem response theoryThe development instrument to measure the risk level for EDs in the population of children and adolescents considering the IRT started with the use of 10 items (variables). These items are considered observable facets of this trait. The answer options for the items were dichotomous, where a “0” meant “no” and “1” meant “yes.” However, in the sample of 323 children and adolescents who answered the 10 items, for one of them (“Do you vomit or make yourself vomit to get rid of food after eating?”), there was no variability in the answers, so it had to be eliminated when developing the measure further. The nine items that compose the instrument trait are presented in Table 1.
Description of the items of eating disorder symptoms instrument Brazed.
| Item | Item description | Response categories |
|---|---|---|
| 1 | Do you eat even if you are not hungry? | 0. No1. Yes |
| 2 | After you start eating, is it difficult to stop? | 0. No1. Yes |
| 3 | When you are feeling bad, sad or when you have nothing to do, do you eat to feel better? | 0. No1. Yes |
| 4 | When you do something nice, do you eat something as a prize? | 0. No1. Yes |
| 5 | Have you ever hidden food somewhere to eat afterwards? | 0. No1. Yes |
| 6 | Do you use medicine to get rid food after you have eaten? | 0. No1. Yes |
| 8 | Do you exercise to get of food after you have eaten? | 0. No1. Yes |
| 9 | Have you ever wanted to take a medicine to get thinner? | 0. No1. Yes |
| 10 | Are you afraid of gaining weight and/or getting fat? | 0. No1. Yes |
The two-parameter logistic model was adjusted to create the measure with IRT.12,13 In the context of this study, the two-parameter logistic model predicts the probability of child j, with risk symptoms of eating disorder θj, answering category 1 (yes) for item i (items presented in Chart 1), that is, P(Xij=1|θj), as follows14:
where i=1,2,…,9 and i=1,2,…,323;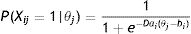
Xij is the dichotomous item, which represents the presence or absence of observable eating disorder symptom i, and takes the values of 1 or 014;
θj represents the risk symptoms of an eating disorder of the jth child, estimated on a scale with a zero mean and standard deviation of 1, called “risk symptoms of an eating disorder”;
bi is the positional parameter of item i, estimated on the same scale as θ, and which represents the severity of the symptom measured in item i, that is, the risk symptoms of an eating disorder needed for the child to answer category 1 (yes) for item i with a probability higher than 0.5 (the higher the estimate for parameter bi, the more serious that symptom is)15; ai is the discrimination (or slope) parameter of item i – low values of this parameter indicate that children and adolescents with different levels of an eating disorder have roughly the same probability of answering category 1 for item i. That is, they have roughly the same probability of presenting the symptom measured by item i. Very high values of this parameter divide the children and adolescents into two primary groups: the group that has risk symptoms of an eating disorder below the value of the bi parameter and the group that has risk symptoms of an eating disorder above the value of the bi parameter; D scale factor (constant, equal to 1, or 1.7).15
The two-parameter logistic model has to meet two assumptions in order for its use: local independence and unidimensionality (a single latent trait determines the item responses). These assumptions are related in that if the measuring instrument is unidimensional, then local independence is fulfilled.12,13 The unidimensionality assumption can be relaxed, which is known as sufficient unidimensionality.16,17 For model can be used considering the sufficient unidimensionality, it needs to have a predominant dimension (proportion of explanation of the first dimension at least equal to 20%).12,13 The verification of the sufficient unidimensionality of the measurement instrument was done through exploratory factor analysis using the tetrachoric correlation matrix, as the items have a dichotomous response. The verification of sufficient unidimensionality was performed with the psych package, version 2.0.7, of the R software.
The IRT models’ products evaluated in this study were item characteristic curves (ICCs), test information curve (TIC), and differential item functioning (DIF).18
The ICCs of the two-parameter logistic this study describes how much changes in the latent trait are related to changes in the probability of saying “yes”. Items with high discrimination values (the items should have estimates for the (ai) parameter that are higher than or equal to “1”) present steeper ICCs. Items with higher thresholds that are more to the right in the ICCs graph present greater severity.18
The TIC is a sum of the item information curves. It shows what levels of an eating disorder the measuring instrument created works best; that is, at what levels of an eating disorder in children and adolescents the measuring instrument created estimates the latent trait most accurately.19
DIF is a statistical characteristic of an item that shows the extent to which the item might be measuring different abilities for members of separate subgroups.12,13 The presence of DIF was assessed for the “version” (physical or online instrument), “sex” (male or female), and “age” (up to seven or over seven years old) variables, using Lord's chi-squared method with Bonferroni adjustment. P values above 0.05 indicate the absence of DIF.12,13 5.1 of the difR package in the R software was used. These analyses were performed using version 2.0.7 of the psych package in the R software.
Content validityThe instrument was assessed in relation to its content by independent expert evaluators with clinical experience in the latent trait being studied. Fifteen professionals participated in this stage, five from each of the areas of psychology, medication, and nutrition, as well as one pedagogue who worked in the classroom with children aged 6–7. In the procedure used to determine the content validity, the professionals assessed the instrument in terms of clarity of language, practical relevance, and theoretical relevance, using a qualitative evaluation (I totally disagree, I partially disagree, I’m indifferent, I partially agree, I totally agree). The instrument was also assessed in relation to its content using a pilot study conducted on 10 families who answered the instrument and made suggestions.20
ReliabilityReliability was assessed by two coefficients: the Cronbach's Alpha measure and the Spearman–Brown coefficient. The Cronbach's Alpha measure was assessed with a 95% (acceptable values ≥0.7) confidence interval (CI) obtained by bootstrapping using the psych R package.21–23 The Spearman–Brown coefficient had acceptable values ≥0.3.24 The Spearman–Brown coefficient was analyzed using the split-halves method.24 For this method, we adopted the following strategies. First, the items were randomly divided into two halves. A mean of the scale was calculated for each half and then the two sets of means of the instrument were correlated to estimate the split-half correlation.25 The split-half correlation was adjusted using the Spearman–Brown formula to create split-half reliability. This procedure was repeated 1000 times and the mean of the split-half correlations was returned as the best single item reliability estimate.25 Meanwhile, the mean of the split-half reliabilities was returned as the best composite reliability estimate for all the items.25 The analyzes were performed on the item, version 1.1-1, and Multicon, version 1.6 packages of the R software.
SamplingConsidering the total number of questions contained in the instrument (10 questions) and given that the area of psychometric suggests 10 participants per question, a sample of 100 participants would be sufficient for psychometric analysis.26
ResultsIn total, 336 participants completed the instrument. Thirteen participants (3%) had more than 50% of the items missing and were therefore excluded from further analysis. Of the 323 children and adolescents who completed all questions, 169 (53%) were female (Fig. 1). The mean age of both sexes was eight years old (standard deviation=2.05). Most of the children and adolescents were classified as healthy weight (53%), they self-identified as white (83%), and they were from the South region of Brazil (87%). The median family income was R$ 5000 (income 2100–12,000) (Table 2).

Demographic characteristics of the studies sample.
| Variable | Boys (n=154) | Girls (n=169) | Total (n=323) |
|---|---|---|---|
| Agea | 8.16 (2.04) | 8.17 (2.07) | 8.16 (2.05) |
| BMI classification (Z score)b | |||
| Underweight | 6 (3.90) | 4 (2.37) | 10 (3.10) |
| Healthy weight | 80 (51.95) | 91 (53.85) | 171 (52.94) |
| Overweight | 37 (24.03) | 46 (27.22) | 83 (25.70) |
| Obesity | 31 (20.13) | 28 (16.57) | 59 (18.27) |
| Skin color (n=321) | |||
| White | 130 (85.53) | 135 (79.88) | 265 (82.55) |
| Black | 5 (3.29) | 11 (6.51) | 16 (4.98) |
| Parda | 0 (0.00) | 2 (1.18) | 2 (0.62) |
| Indigenous | 17 (1118) | 21 (12.43) | 38 (11.84) |
| Regionsb (n=319) | |||
| North | 0 (0.00) | 2 (1.20) | 2 (0.63) |
| North East | 5 (3.3) | 7 (4.19) | 12 (3.76) |
| Midwest | 4 (2.64) | 0 (0.0) | 4 (1.26) |
| Southeast | 4 (2.63) | 10 (5.99) | 14 (4.39) |
| South | 139 (91.46) | 148 (88.62) | 287 (86.97) |
| Income (reais)c | 6500 (2900–15,000) | 5000 (2000–2000) | 5000 (2100–12,000) |
Regarding the number of individual answers “yes” to each question was: item 1 (Do you eat even if you are not hungry?)=42.2%, item 2 (After you start eating, is it difficult to stop?)=21.4%, item 3 (When you are feeling bad, sad or when you have nothing to do, do you eat to feel better?)=25.6%, item 4 (When you do something nice, do you eat something as a prize?)=24.4%, item 5 (Have you ever hidden food somewhere to eat afterward?)=22.0%, item 6 (Have you ever hidden food somewhere to eat afterward?)=1.2%, item 7 (Do you use medication to get rid of food after you have eaten?)=6.8%, item 8 (Have you ever wanted to take medication to get thinner?)=12.8%, and item 9 (Are you afraid of gaining weight and/or getting fat?)=45.2%).
The analysis of sufficient unidimensionality showed that the first factor explains 41% of the total data variation. In other words, the instrument fulfilled the criteria of sufficient unidimensionality.
Item response theoryItem characteristic curvesRegarding discrimination, items 3 (“When you’re feeling bad, sad, or when you have nothing to do, do you eat to feel better?”) and 8 (“Have you ever wanted to take medication to get thin?”) had the highest discrimination values. Items 4 (“When you do something nice, do you eat something as a prize?”) and 5 (“Have you ever hidden food somewhere to eat afterward?”) had the lowest discrimination values (Table 3). Items 3 and 8 had the steepest curves, and items 4 and 5 had the least steep curves (Fig. 2). Higher discrimination values suggest better psychometric performance.
Estimate of the item parameters of the 2-parameter logistic model for the sample of 323 children and adolescents (SAS).
| Item | Item name | Item severity* | Item discrimination* |
|---|---|---|---|
| 1 | Do you eat even if you are not hungry? | 0.24 (0.12) | 1.22 (0.23) |
| 2 | After you start eating, is it difficult to stop? | 1.25 (0.20) | 1.27 (0.25) |
| 3 | When you are feeling bad, sad or when you have nothing to do, do you eat to feel better? | 0.71 (0.10) | 2.68 (0.65) |
| 4 | When you do something nice, do you eat something as a prize? | 1.43 (0.31) | 0.84 (0.19) |
| 5 | Have you ever hidden food somewhere to eat afterwards? | 1.55 (0.31) | 0.91 (0.21) |
| 6 | Do you use medicine to get rid of food after you have eaten? | 4.37 (1.90) | 1.15 (0.64) |
| 7 | Do you exercise to get food after you have eaten? | 2.88 (0.67) | 1.03 (0.31) |
| 8 | Have you ever wanted to take a medicine to get thinner? | 1.43 (0.17) | 2.07 (0.46) |
| 9 | Are you afraid of gaining weight and/or getting fat? | 0.13 (0.13) | 1.06 (0.22) |

Item information curve.
1. Do you eat even if you are not hungry?
2. After you start eating, is it difficult to stop?
3. When you are feeling bad, sad or when you have nothing to do, do you eat to feel better?
4. When you do something nice, do you eat something as a prize?
5. Have you ever hidden food somewhere to eat afterwards?
6. Do you use medicine to get rid of food after you have eaten?
7. Do you exercise to get food after you have eaten?
8. Have you ever wanted to take a medicine to get thinner?
9. Are you afraid of gaining weight and/or getting fat?.
Concerning item severity, items 6 (“Do you use medication to get rid of food after you have eaten?”) and 7 (“Do you exercise to get food after you have eaten?”) were the ones that presented the highest values. Items 9 (“Are you afraid of gaining weight and/or getting fat?”) and 1 (“Do you eat even if you are not hungry?”) had the lowest severity (Table 3). In Fig. 2, we can see this same representation, items 6 and 7 were located more to the right, confirming greater item severity, and items 1 and 9 more to the left were less item severe in the continuous latent trait.
Test information curveThe TIC results indicated that values above one standard deviation presented greater precision for the estimate of risk symptoms of an eating disorder (Fig. 3).
Differential item functioning
The “version” (physical or online instrument), “sex” (male or female), and “age” (up to seven or over seven years old) showed DIF absence (or no differences).
Content validityRegarding content validity, expert evaluators answered that they totally agreed with the clarity of language (83%), practical relevance (75%), and theoretical relevance (91%) for each of the items. With respect to the suggestions, nine of the expert evaluators asked for a change of the word “simply” in question 2, which was originally as follows: “Do you feel that when you start eating, you simply can’t stop?”. This became: “After you start eating, is it hard to stop?”.
ReliabilityThe value of the Cronbach's Alpha was 0.63 (95% CI: 0.56–0.69), and the Spearman–Brown coefficient was 0.65 (standard deviation=0.05).
DiscussionThese results indicated the good performance of the Brazed instrument to assess the level of symptoms of EDs in children and adolescents. The Brazed instrument contains items that perform differently in relation to item discrimination and item severity. This means that the instrument accurately captured the latent trait estimate for the target population.12,13 Moreover, the test information curve suggested that values close to one standard deviation present good accuracy, which indicates the good performance of the tool in assessing the level symptoms of EDs in children and adolescents.
Among the strengths of the instrument developed are the inclusion of young children and questions with yes and no answer options to facilitate the children's understanding. Moreover, the instrument does not need to be applied by a professional from a specific discipline. The good content validity results may stem from how easily the Brazilian population understood the questions. The concise form of the questionnaire may also have contributed to its good content validity performance. Likewise, the input of professionals with different areas of expertise may have also played a contributory role.
Questionnaires continue to be the most used way among the tools to identify symptoms of Eds.27 The Brazed tool was developed directly for Brazilian children and adolescents to precociously screen the risk of developing EDs symptoms.
The present study has several limitations. Most of the respondents were from the South region of Brazil. Despite this, we included children and adolescents from families of different socioeconomic levels and ethnicities to represent the Brazilian population better. Another limitation of the study is that the instrument's performance was not compared with the instrument considered the gold standard for screening EDs. However, there is a lack of questionnaires that assess AN, BN, and BED in the target age group included in the study in the Brazilian population.27
None of the instruments validated for screening and diagnosing EDs in Brazil used the IRT to validate the questionnaire. However, validated instruments evaluated the reliability.4–9 The reliability results of the instruments ranged from 0.697 to 0.96.6 The Brazed Cronbach's Alpha values were close to the expected28 and the Spearman–Brown coefficient had good values.24 Future research is needed to assess the reliability of this questionnaire in other populations.
ConclusionThese results indicate the good performance of the Brazed instrument in assessing the risk symptoms of EDs in children and adolescents. Future studies could validate the Brazed instrument in clinical or specific at-risk and older children.
Ethical approvalThis study was approved by the ethics committee of the Pontifícia Universidade Católica do Rio Grande do Sul – PUCRS (CAAE: 81021317.9.0000.5336).
FundingNone declared.
Competing interestAuthors present no conflict of interest.
Foundation of Rio Grande do Sul (FAPERGS), the National Research Council of Brazil (CNPq), and the Coordination for the Improvement of Higher Education Personnel (CAPES) (Finance Code 001).
