


Chronic hepatitis B (CHB) infection remains a significant global public health issue, affecting approximately 257.5 million people by 2022 [1]. This disease is a major etiology of cirrhosis, hepatocellular carcinoma (HCC) and related deaths [2]. Achieving a complete sterilizing cure for hepatitis B virus (HBV) with the current therapy is unrealistic due to the persistence of covalently closed circular DNA and the integration of HBV DNA into the host genome. [3]. Currently, a functional cure, defined by the sustained loss of hepatitis B surface antigen (HBsAg), is considered a more attainable goal to improve the clinical outcomes [4].
Combination therapy using nucleos(t)ide analogues (NAs) and interferon (IFN) may have higher rates of HBsAg loss than monotherapy [5]. However, the rates of HBsAg loss exhibit substantial variability across different studies, which is largely influenced by disparities in patient characteristics, particularly baseline HBsAg levels [6]. Previous studies demonstrated an inverse relationship between baseline HBsAg levels and the rate of HBsAg loss [7]. However, the optimal baseline HBsAg level for achieving a functional cure remains to be defined, with reported thresholds widely ranging from 1000 to 3000 IU/mL [8–10].
Therefore, in the present study we aimed to fill this gap through a comprehensive systematic review and meta-analysis to identify the most favorable profiles for achieving HBsAg loss in patients receiving monotherapy of IFN and NAs or their combination, with focus on baseline HBsAg levels and other related factors.
2Materials and MethodsThis study was conducted with full adherence to the Preferred Reporting Items for Systematic Review and Meta-analyses (PRISMA) statement (Supplementary Methods) [11] and the protocol was registered with PROSPERO (CRD42023384534).
2.1Search strategyPubMed, Embase and Cochrane Library were searched from their inception to December 31, 2023. The following keywords or descriptors (MeSH & Emtree terms) were used: ‘hepatitis B, chronic’, ‘entecavir’, ‘tenofovir’, ‘tenofovir alafenamide’, ‘interferon’, ‘peginterferon’ and ‘pegylated interferon’. The entire search strategy is available in Supplementary Methods.
2.2Inclusion and exclusion criteriaStudies were eligible for inclusion if they met the following criteria: (1) Population: participants were adults with CHB, typically defined as individuals testing positive for HBsAg for more than six months; (2) Intervention: the studies involved at least one combination regimen of IFN and NAs, including de novo combination, add-on combination, or switch-to therapy, as the intervention group; (3) Control: monotherapy with either IFN or NAs for at least six months; (4) Outcome: studies reported baseline HBsAg levels and the number of individuals who achieved HBsAg loss.
The exclusion criteria were as follows: (1) reviews, editorials, letters, guidelines, protocols, basic research, and articles enrolling patients with a sample size of less than 30; (2) studies enrolled participants who had already developed cirrhosis, decompensation, HCC, previous liver transplantation; (3) studies included participants with co-infection of other viruses (hepatitis A/C/D, human immunodeficiency virus), or tuberculosis; (4) studies enrolled participants with comorbidities such as alcohol-related disease, autoimmune disease, metabolic disease, severe kidney disease, or pregnancy; (5) studies used non-first-line NAs therapies; (6) studies included overlapping data cohorts.
2.3Data extractionTwo investigators (SL and LCS) independently extracted the data, with any disagreements resolved by discussion to reach a consensus or by consulting a senior methodologist (YYK). The extracted information included: basic information of the studies including the name of the first author, year of publication, country, sample size, and study design; characteristics of participants including mean age, sex, baseline levels of HBsAg, alanine aminotransferase (ALT), HBV DNA, and hepatitis B e antigen (HBeAg) status; treatment details including duration of antiviral treatment, follow-up period, types of IFN and NAs used, and combination strategies (such as “de novo combination,” “add-on combination,” or “switch-to”), control regimen (IFN or NAs), and the number of HBsAg loss in each group.
Continuous variables were extracted as mean ± standard deviation (SD) and categorical variables as percentages. For baseline HBsAg levels, the median, quartile 1 (Q1), and quartile 3 (Q3) were obtained. The mean ± SD was subsequently calculated using established statistical methods based on either the median and interquartile range or the median along with maximum and minimum values reported in the original studies [12,13].
2.4Assessment for risk of biasThe risk of bias was assessed using version 2 of the Cochrane Risk-of-Bias tool for randomized trials (RoB 2) for randomized controlled trials (RCTs) [14], and the Risk of Bias in Non-randomized Studies of Interventions (ROBINS-I) tool for non-randomized studies of interventions (NRSI) [15]. Assessments were conducted at the study level. Two investigators (SL and LCS) independently performed the quality assessment. Discrepancies were resolved by consensus or through the involvement of an expert hepatologist (JDJ) and a senior methodologist (YYK).
2.5DefinitionsThe primary outcome was HBsAg loss, defined as the loss of HBsAg (below the lower limit of quantification) with or without the presence of anti-HBs [4].
Combination therapy is classified into three types: de novo combination strategy, which involves simultaneously starting nucleos(t)ide analogues (NAs) and interferon (IFN) for at least six months; add-on combination strategy, which begins with NAs or IFN and is followed by the addition of the other agent; and switch-to combination strategy, which starts with NAs and subsequently switches to IFN, with or without a short period of overlap between the two therapies.[5]
2.6Statistical analysisMedian (Q1, Q3) values were reported for study characteristics. Risk difference (RD) and 95% confidence intervals (CIs) were used to compare HBsAg loss between combination therapy and monotherapy. The Freeman-Tukey double arcsine transformation was applied to compute pooled proportions and corresponding 95 % CIs for HBsAg loss. Heterogeneity between studies was assessed using Q-statistics, and the I² statistic was described the percentage of observed variation due to heterogeneity, with I² values over 50 % indicating substantial heterogeneity. Due to the observed heterogeneity across the primary studies, a random-effects model was used to pool the proportions.
To address zero numerators in control groups, RD was used to compare the efficacy of NAs-IFN combination therapy with monotherapy. The 75th percentile of baseline HBsAg (75th baseline HBsAg) was used to estimate typical participant levels in each study, as the maximum value could be skewed by outliers. Various cutoffs of baseline HBsAg at the 75th percentile were applied to determine the higher proportion of HBsAg loss for combination therapy versus monotherapy.
Further analysis was conducted to examine proportions of HBsAg loss according to different combination strategies and IFN treatment durations within the combination therapy. Additionally, patient characteristics such as male percentage, ALT levels, and HBeAg status were evaluated. Meta-regression was conducted for factors with data from over 10 studies, using means of age, male percentage, levels of HBV DNA and ALT. Analyses were performed on the data at the end of treatment and follow-up, with follow-up durations stratified into six months and one year. Sensitivity analyses excluded NRSI studies.
Publication bias was evaluated using Begg's test, Egger's test, and Funnel plot. All analyses were conducted using R Software version 4.3.1, with a P value <0.05 being considered statistically significant.
2.7Ethical statementsThis study utilized data from previously published research, therefore, ethical approval and patient consent were not required.
3Results3.1The characteristics of the included studies and subjectsInitially, 30,314 studies were identified. After removing 9053 duplicates and excluding 20,947 studies based on title and abstract screening, 314 studies remained for full-text review. Finally, 24 studies comprising 3446 patients were included (Fig. 1).
ide Analogues.")
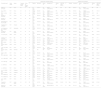
Among these, 17 studies were RCTs [6,10,16–30] and 7 were NRSI studies [9,31–36]). Patients were mainly from Asia, with 14 studies conducted in China. The mean age of participants ranged from 27 to 56 years, with a median male percentage of 75 %. The included studies had a median sample size of 56 (interquartile range: 32 to 85; Table 1). The median of the 75th percentile of baseline HBsAg across the studies was 7436 IU/mL (interquartile range: 2102 to 12906 IU/mL; Table 1). The lower limit of quantification for HBsAg ranged from 0.05 to 0.1 IU/mL in most studies (Supplementary Table S1).
The characteristics of included studies and subjects.
| Subjects with combination therapy | Subjects with monotherapy | |||||||||||||||||
|---|---|---|---|---|---|---|---|---|---|---|---|---|---|---|---|---|---|---|
| First author (year)* | Study design | Region | Treatment duration (week) | Follow-up duration (week) | nӪ | Regimen | Age (year)& | Male(n, %) | HBsAg(IU/mL) Ʊ | HBeAg (±) | HBV DNA (log10 IU/mL) & | nӪ | Regimen | Age (year) & | Male(n, %) | HBsAg(IU/mL) Ʊ | HBeAg (±) | HBV DNA (log10 IU/mL) & |
| Chen, X. F. (2013) [16] | RCT | China | 48 | 0 | 27 | De novo comb | 31.8±7.7 | 20 (74.1) | 4570.9 (2168.2,6974.0) | NR | NR | 30 | NAs | 32.4±7.1 | 21 (70.0) | 4677.4 (1918.7,7436.0) | NR | NR |
| Xie, Q. (2014) [17] | RCT | China | 48 | 24 | 73 | Add-on comb# | 29.2±6.9 | 57 (78.1) | 10000.0 (9992.7,10007.0) | NR | 7.9±2.0 | 72 | NAs | 29.5±8.1 | 56 (77.8) | 12589.3 (12583.5,12595.0) | NR | 7.9±1.6 |
| He, L. T. (2016) [18] | RCT | China | 48 | 0 | 44 | Switch-to IFN | 35.4±12.3 | 30 (68.2) | 6168.9 (4803.3,7534.5) | 29/15 | NR | 44 | NAs | 35.4±10.2 | 30 (68.2) | 5879.5 (4567.3,7191.7) | 27/17 | NR |
| Marcellin, P. (2016) [19] | RCT | France | 48 | 24 | 186 | De novo comb | 38.0±16.7 | 127 (68.3) | 7943.3 (7936.0,7951.0) | 108/78 | 7.1±1.5 | 185 | NAs | 36.0±10.9 | 121 (65.4) | 7943.3 (7936.0,7950.5) | 109/76 | 7.0±1.5 |
| Marcellin, P. (2016) [19] | RCT | France | 48 | 24 | 186 | De novo comb | 38.0±16.7 | 127 (68.3) | 7943.3 (7936.0,7951.0) | 108/78 | 7.1±1.5 | 185 | IFN | 38.0±10.5 | 119 (64.3) | 6309.6 (6302.3,6316.8) | 106/79 | 6.9±1.6 |
| MartinotPeignoux, M. (2016) [20] | RCT | France | 48 | 0 | 32 | De novo comb | 47.0±10.0 | 24 (75.0) | 2113.5 (2109.3,2118.0) | NR | 5.0±1.6 | 30 | IFN | 47.0±9.0 | 20 (66.7) | 3981.1 (3975.0,3987.2) | NR | 5.8±1.5 |
| Tangkijvanich, P. (2016) [21] | RCT | Thailand | 48 | 48 | 63 | De novo comb | 40.3±9.8 | 46 (73.0) | 3162.3 (3158.6,3166.0) | NR | 5.4±0.8 | 63 | IFN | 40.0±9.3 | 43 (68.3) | 2511.9 (2508.2,2515.5) | NR | 5.5±0.8 |
| van Campenhout, M. J. H. (2016) [22] | RCT | Netherlands | 48 | 24 | 85 | Add-on comb | 32.0±10.0 | 63 (74.1) | 15848.9 (15841.7,15856.0) | NR | 7.8±1.3 | 90 | NAs | 31.0±9.0 | 62 (68.9) | 12589.3 (12582.0,12596.5) | NR | 7.8±1.1 |
| Al Ashgar, H. (2017) [23] | RCT | Saudi Arabia | 52 | 52 | 23 | De novo comb | 43.5±11.4 | 22 (95.7) | 4515.0 (2872.3,12924.0) | NR | 1.0±1.3 | 25 | IFN | 44.3±12.2 | 21 (84.0) | 5958.0 (4342.0,14612.1) | NR | 1.9±2.5 |
| Li, H. (2017) [31] | NRSI | China | 48 | 24 | 62 | De novo comb | 28.0±8.0 | 47 (75.8) | 125.9 (121.6,130.0) | 31/31 | 5.9±1.6 | 44 | IFN | 27.0±6.0 | 32 (72.7) | 109.6 (101.9,117.4) | 24/20 | 6.3±1.6 |
| Cannizzo, E. S. (2018) [24] | RCT | Italy | 48 | 36 | 10 | Add-on comb | 48.0 +6.3 | 7 (70.0) | 1905.5 (1894.0,1917.0) | 0/10 | <1.0 | 20 | NAs | 56.0+11.7 | 12 (60.0) | 602.6 (594.0,611.1) | 0/20 | <1.0 |
| Jindal, A. (2018) [32] | NRSI | India | 72 | 36 | 53 | Add-on comb | 29.1±13.0 | 45 (84.9) | 25118.9 (12589.3,79433.0) | 53/0 | 7.1±1.2 | 53 | NAs | 38.0±16.4 | 45 (84.9) | 15848.9 (3162.3,25118.9) | 53/0 | 6.7±1.3 |
| Wu, D. (2019) [25] | RCT | China | 48 | 24 | 33 | Switch-to IFN | 36.5±9.7 | 25 (75.8) | 1659.6 (1655.8,1663.0) | 33/0 | 3.3±1.2 | 27 | NAs | 35.0±10.5 | 21 (77.8) | 776.2 (768.5,784.0) | 27/0 | 3.2±1.3 |
| Zheng, C. (2019) [33] | NRSI | China | 48 | 0 | 77 | De novo comb | 30.3±7.3 | 55 (71.4) | 3.6 (2.2,5.0) | 77/0 | 7.4±5.0 | 66 | IFN | 29.6±5.5 | 48 (72.7) | 3.7 (2.8,4.6) | 66/0 | 7.7±1.9 |
| Yang, J. M. (2020) [26] | RCT | China | 52 | 52 | 73 | Add-on comb | 42.9±12.2 | 48 (65.8) | 1995.3 (831.8,8913.0) | 32/41 | 5.6±1.4 | 56 | NAs | 45.5±12.7 | 35 (62.5) | 1819.7 (660.7,5128.6) | 28/28 | 5.7±1.2 |
| Ahmad, Y. (2021) [34] | NRSI | Indonesia | 48 | 0 | 24 | De novo comb | NR | NR | >100.0 | NR | NR | 29 | NAs | NR | NR | >100.0 | NR | NR |
| Chen, S. (2021) [27] | RCT | China | 52 | 26 | 105 | Add-on comb | 35.0±9.0 | 79 (75.2) | 5011.9 (1995.3,15849.0) | 77/29 | 6.8±1.6 | 46 | NAs | 39.0±11.0 | NR | 5011.9 (1995.3,15848.9) | 36/10 | 6.5±2.3 |
| Hu, C. (2021) [35] | NRSI | China | 48 | 24 | 104 | De novo comb | 29.2±4.7 | 71 (68.3) | 10000.0 (9996.4,10004.0) | 88/16 | 6.9±1.3 | 106 | IFN | 28.9±6.2 | 83 (78.3) | 7943.3 (7939.6,7946.9) | 78/28 | 6.7±1.4 |
| Hu, C. (2021) [35] | NRSI | China | 48 | 24 | 104 | De novo comb | 29.2±4.7 | 71 (68.3) | 10000.0 (9996.4,10004.0) | 88/16 | 6.9±1.3 | 120 | NAs | 30.5±7.1 | 77 (64.1) | 7943.3 (7938.7,7947.9) | 93/27 | 6.6±1.5 |
| Jia, R. (2021) [9] | NRSI | China | 48 | 0 | 72 | De novo comb | 39.7±9.3 | 61 (84.7) | 331.1 (323.0,339.0) | 25/47 | NR | 26 | NAs | 38.9±9.9 | 22 (84.6) | 602.6 (596.7,608.5) | 11/11 | NR |
| Li, J. (2021) [6] | RCT | China | 48 | 48 | 44 | De novo comb | 32.9±5.7 | 30 (68.2) | 12302.7 (12293.1,12312.0) | 44/0 | 7.5±0.9 | 62 | NAs | 34.3±7.8 | 37 (59.7) | 12882.5 (12877.4,12887.6) | 62/0 | 7.5±0.9 |
| Li, J. (2021) [6] | RCT | China | 96 | 0 | 27 | Add-on comb | 33.7±4.8 | 21 (77.8) | 17782.8 (17779.7,17786.0) | 27/0 | 7.6±0.8 | 62 | NAs | 34.3±7.9 | 37 (59.7) | 12882.5 (12877.4,12887.6) | 62/0 | 7.5±0.9 |
| Lim, S. G. (2022) [29] | RCT | Singapore | 48 | 24 | 103 | Switch-to IFN | 47.7±12.0 | 84 (81.6) | 1064.1 (443.1,2155.0) | 37/66 | NR | 51 | NAs | 50.0±12.2 | 40 (78.4) | 726.2 (445.5,2251.3) | 16/35 | NR |
| Lim, S. G. (2022) [29] | RCT | Singapore | 48 | 24 | 99 | Add-on comb | 50.3±12.0 | 80 (80.8) | 707.2 (181.3,2116.0) | 29/70 | NR | 51 | NAs | 50.0±12.2 | 40 (78.4) | 726.2 (445.5,2251.3) | 16/35 | NR |
| Hu, Q. (2022) [10] | RCT | China | 48 | 24 | 50 | Add-on comb | 38.1±10.0 | 40 (80.0) | 1737.8 (891.3,2455.0) | 50/0 | < 1.7 | 51 | NAs | 38.9±8.4 | 39 (76.5) | 1479.1 (933.3,2089.3) | 51/0 | < 1.7 |
| Hu, Q. (2022) [10] | RCT | China | 48 | 24 | 52 | Switch-to IFN | 36.0±9.2 | 39 (75.0) | 1737.8 (891.3,2455.0) | 52/0 | < 1.7 | 51 | NAs | 38.9±8.5 | 39 (76.5) | 1479.1 (933.3,2089.3) | 51/0 | < 1.7 |
| Lian, J. (2022) [28] | RCT | China | 48 | 24 | 97 | De novo comb | 31.0±6.7 | 75 (77.3) | 13182.6 (13178.6,13187.0) | 97/0 | 7.6±1.4 | 84 | IFN | 32.0±6.8 | 60 (71.4) | 9120.1 (9114.7,9125.5) | 84/0 | 7.3±1.3 |
| Terrault, N. A. (2023) [30] | RCT | United States | 24 | 216 | 99 | De novo comb | 41.7±12 | 59 (59.6) | 3981.1 (1000.0,79433.0) | 49/50 | 6.5±2.0 | 102 | NAs | 41.4±11.3 | 71 (69.6) | 7943.3 (1000.0,31622.8) | 54/48 | 6.7±2.3 |
| Wang, W. X. (2023) [36] | NRSI | China | 48 | 0 | 58 | Add-on comb | 39.1±11.3 | 49 (84.5) | 389.0 (93.3,891.0) | 17/41 | < 1.3 | 18 | NAs | 40.1±11.1 | 14 (77.8) | 616.6 (190.5,1071.5) | 8/10 | < 1.3 |
Add-on comb add-on combination, De novo combde novo combination, IFN interferon, NAs nucleos(t)ide analogues, NR not reported, NRSI nonrandomized studies of interventions, RCT randomized controlled trial.
Some studies may have utilized multiple combination strategies or included multiple monotherapies as control groups, therefore presented in multiple rows.
RoB 2 was used to assess bias in RCTs, revealing that 12 studies had some concerns of bias overall, while 5 studies had a low risk of bias overall (Supplementary Table S2). ROBINS-I was employed to evaluate bias in NRSIs, with all studies exhibiting a moderate risk of bias overall (Supplementary Table S3).
3.3The risk difference of HBsAg loss achieved by combination therapy versus monotherapyWe analyzed 24 studies that reported the proportion of HBsAg loss at the end of treatment. Of these, 17 studies and 7 studies used NAs monotherapy and IFN monotherapy as controls, respectively. Overall, combination therapy showed a higher pooled proportion of HBsAg loss than monotherapy, with a RD of 4 % (95 % CI: 2–7 %, I²=59 %). Specifically, when compared with NAs monotherapy, the RD increased to 6 % (95 % CI: 3–9 %, I²=66 %). In contrast, the RD was 2 % (95 % CI: −1–6 %, I²=30 %) when compared with IFN monotherapy (Fig. 2). Sensitivity analysis showed that the RD comparing combination therapy with monotherapy was 7 % (95 % CI: 3–10 %, I²=66 %) in Asian population, 7 % (95 % CI: 3–12 %, I²=67 %) in Chinese population, and 2 % (95 % CI: 1–4 %, I²=22 %) in European population at the end of treatment (Fig. S1).

Additionally, for 13 studies reporting HBsAg loss during follow-up of six months or less, the pooled RD was 6 % (95 % CI: 3–8 %, I² = 62 %) at the end of follow-up and 3 % (95 % CI: 1–5 %, I² = 0 %) at the end of treatment (Fig. S2). For the six studies with follow-up exceeding six months, no significant pooled RD was detected at either the end of follow-up or the end of treatment (Fig. S2).
3.4The impact of baseline HBsAg levels on HBsAg lossWe evaluated the proportions of HBsAg loss at the end of treatment by stratifying studies by their 75th percentile of baseline HBsAg levels. Overall, studies recruiting patients with lower baseline HBsAg levels demonstrated a higher likelihood of achieving HBsAg loss in the combination therapy group as shown in Fig. 3.
ide Analogues.")
Notably, studies recruiting patients with 75th percentile of baseline HBsAg below 500 and 1000 IU/mL had the highest pooled proportions of HBsAg loss at 14 % (95 % CI: 9–21 %) and 17 % (95 % CI: 10–24 %), respectively, for combination therapy group (Fig. 3). In contrast, studies recruiting patients with higher 75th percentile of baseline HBsAg levels (1000-2000 IU/mL, 2000–3000 IU/mL, and above 3000 IU/mL) had significantly lower pooled proportions of HBsAg loss, with point estimates at or below 10 % (Fig. 3).
For studies recruiting patients receiving IFN or NAs monotherapies, we did not observe statistically significant differences in HBsAg loss across different 75th percentile of baseline HBsAg levels (Fig. 3). Similarly, in the 11 studies reporting HBsAg loss at the end of follow-up for six months or less, no significant differences were found based on baseline HBsAg levels (Figure S3). For the 6 studies with a follow-up duration exceeding six months, the 75th percentile of baseline HBsAg levels were all above 3000 IU/mL, precluding further stratification by lower thresholds.
3.5The impact of combination strategies on HBsAg lossNo statistically significant differences in HBsAg loss were observed across the three different combination strategies (de novo, add-on, and switch-to) at the end of treatment (22 studies) or follow-up (17 studies) (Fig. 4 and Fig. S4). However, when the 75th percentile of the baseline HBsAg was ≤ 2000 IU/mL, the add-on combination therapy showed a notably higher pooled proportion of HBsAg loss at 24 % (95 % CI: 14–36 %).
3.6The impact of IFN treatment durations on HBsAg loss in combination therapyide analogues.")
In studies involving NAs-IFN combination therapy, the duration of IFN treatment varied. At the end of treatment, studies with a one-year IFN treatment showed a significantly higher pooled proportion of HBsAg loss (9 %, 95 % CI: 6–12 %) than those with a six-month IFN treatment (1 %, 95 % CI: 0–2 %) (P < 0.01, Table 2 and Fig. S5). Similar results were observed for studies reporting HBsAg loss at the end of follow-up (with follow-up durations of no more than six months). However, no significant differences were found in studies reporting HBsAg loss at the end of follow-up with durations longer than six months (Fig. S6).
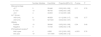
The proportion of HBsAg loss at the end of treatment stratified by the potential risk factors for patients receiving NAs-IFN combination therapy.
| Number ofstudies | Event/total | Proportion[95% CI] | P-value | I2 | |
|---|---|---|---|---|---|
| Male percentage | |||||
| <0.7 | 5 | 20/446 | 0.03 [0.00; 0.09] | 0.11 | 0.76 |
| 0.7-0.8 | 13 | 48/743 | 0.06 [0.03; 0.09] | ||
| >0.8 | 4 | 34/203 | 0.14 [0.05; 0.26] | ||
| ALT (IU/mL) | |||||
| <40 IU/mL | 8 | 48/359 | 0.11 [0.06; 0.17] | 0.02 | 0.77 |
| ≥40 IU/mL | 13 | 52/1023 | 0.04 [0.02; 0.07] | ||
| HBeAg | |||||
| Positive | 10 | 38/646 | 0.05 [0.03; 0.08] | 0.34 | 0.49 |
| Negative | 4 | 14/183 | 0.08 [0.02; 0.18] | ||
| IFN treatment durationα | |||||
| Half a year | 4 | 4/362 | 0.01 [0.00; 0.02] | <0.001 | 0.76 |
| One year | 19 | 101/1054 | 0.09 [0.06; 0.12] |
Among studies with patients receiving NAs-IFN combination therapy, those studies with normal baseline ALT levels (< 40 IU/mL) exhibited a significantly higher proportion of HBsAg loss at 11 % (95 % CI: 6–17 %) than those with elevated baseline ALT levels (P = 0.02). No statistically significant differences were found in HBsAg loss based on male percentage or baseline HBeAg status at the study level (Table 2, Figs. S7-S8).
In meta-regression analysis considering baseline mean age, male percentage, genotype A percentage, mean ALT, and mean HBV DNA of a study, the male percentage and the genotype A percentage were statistically associated with a higher proportion of HBsAg loss (β = 0.79, P = 0.03, 22 studies; β = 2.40, P = 0.01, 5 studies, respectively; Fig. S9).
3.8Publication bias and sensitivity analysisFunnel plots and Egger's tests indicated no significant publication bias (Fig. S10). Sensitivity analyses, excluding non-randomized studies of interventions, showed consistent results with the primary meta-analyses regarding the risk difference in HBsAg loss when compared combination therapy with monotherapy (Figs. S11–S12).
4DiscussionThis systematic review and meta-analysis demonstrated that nearly one-fifth of patients with the 75th percentile of baseline HBsAg levels within 500∼1000 IU/mL achieved HBsAg loss at the end of NAs-IFN combination therapy. Moreover, we observed a positive association between the male percentage in a study and the likelihood of HBsAg loss.
Our findings showed that combination therapy was more effective than monotherapy, particularly NA monotherapy, in achieving HBsAg loss, consistent with previous studies [5]. The overall pooled RD for HBsAg loss was 6 % compared with NAs monotherapy and 2 % compared with IFN monotherapy. However, we observed considerable heterogeneity across studies comparing IFN-NAs combination versus monotherapy (I²=59 %, Fig. 2), likely driven by variations in patient characteristics, study designs, and treatment protocols. Regarding the heterogeneity of the included studies with limited sample sizes, this finding warrants further validation through large RCTs. Sensitivity analysis also showed that this finding was particularly evident for Asian or Chinese populations, rather than European population. These results suggest that genetic factors of different populations may influence the efficacy of combination therapy [37]. Despite the high rate of virologic recurrence and the low HBsAg loss rate associated with NAs monotherapy [38], the majority of CHB patients still benefit from long-term NAs monotherapy through histological improvements and reduced risk of HCC [39].
Although combination therapy was more effective in achieving HBsAg loss, the overall proportions of HBsAg loss were below 10% in all studies, and below 20% even in studies recruiting patients with 75th percentile of baseline HBsAg levels less than 1000 IU/mL. Moreover, we did not find a significant difference across different combination strategies. These findings support the superiority of combination therapy while highlighting the need for developing more potent novel therapy to achieve a higher probability of HBsAg loss [40].
Considering the paucity of cohort studies investigating the optimal HBsAg cut-off and other relevant factors in the literature, we conducted a meta-analysis using the 75th percentile of baseline HBsAg as an estimate to identify the optimal cut-off. Compared with the low rate of HBsAg loss (about 1–3 % per year) [4,41] achieved by long-term NAs monotherapy, our findings indicated that studies with patients having a 75th percentile of baseline HBsAg less than 500∼1000 IU/mL showed the highest HBsAg loss proportion(17 %) by the end of treatment. This inverse trend between baseline HBsAg levels and HBsAg loss is consistent with previous studies [7,42]. These thresholds would of clinical relevance for selecting favorable CHB patients for NAs-IFN combination therapy to achieve a functional cure, as a substantial proportion of the patients on long-term NAs monotherapy could achieve HBsAg levels below 1000 IU/mL [43]. Given the limited effectiveness of current HBV therapy in achieving a functional cure for CHB patients, and the potential side effects associated with IFN, our study offers valuable clinical insights to avoid the futile use in patients with unfavorable profiles. Specifically, we identified a baseline HBsAg level of 500–1000 IU/mL as the optimal threshold for initiating IFN and NAs combination therapy to enhance the likelihood of achieving a functional cure. These results could provide valuable evidence for selecting optimal patients for future clinical trials of new treatments.
Despite a clear positive association between ALT levels and HBeAg loss [44], the precise role of ALT in achieving HBsAg loss remains unclear. Some studies suggest that higher ALT are associated with a higher probability of HBsAg loss [45], while others indicate that normal ALT levels are associated with a higher chance of HBsAg loss [46]. Our findings support the latter, which showed that patients with baseline normal ALT levels had a significantly higher proportion of HBsAg loss. However, the underlying mechanism behind this association remains to be elucidated. Additionally, we did not find a significant difference in HBsAg loss between HBeAg-positive and HBeAg-negative patients at baseline, despite a higher point estimate of pooled HBsAg loss risk in HBeAg-negative patients as reported previously [47].
The meta-regression revealed a positive association between the male percentage in a study and HBsAg loss, though this may not apply at the individual level, where previous findings have been inconsistent [48]. Additionally, we found a positive association between the percentage of genotype A in a study and HBsAg loss, consistent with previous findings [49]. However, given the limited number of studies with HBV genotype included, further research is needed. Similarly, we did not find an association between mean age or HBV DNA levels and HBsAg loss, which does not rule out the possibility that such associations may exist within individual studies. To better understand the potential influences of demographic and baseline clinical characteristics on predicting HBsAg loss, future studies with patients further stratified by novel biomarkers are warranted.
This study has several limitations. First, there are few studies on patients with CHB and very low baseline HBsAg levels, particularly below 100 IU/mL, precluding further investigation into these lower thresholds. Second, due to study-level investigation limitations, we used the 75th percentile of baseline HBsAg as an estimate, which may not represent all participants. Third, some studies only reported overall HBsAg loss during follow-up, precluding the analysis on the persistence of HBsAg loss after treatment cessation. Fourth, regarding the heterogeneity observed in studies comparing combination versus monotherapy, future analysis on results of RCTs with large individual-level data are warranted to better assess the robustness of these findings. Fifth, the characteristics of elite CHB patients identified for IFN-NAs combination therapy in the study, such as normal ALT levels and male gender, indicate that these patients have higher odds of achieving HBsAg loss using IFN-NAs combination strategy. However, this does not imply that other patients should be overlooked; rather, they may benefit from alternative strategies [50]. Further investigation is needed to explore the exorability of these findings into different patient populations.
5ConclusionsIn conclusion, our systematic review and meta-analysis indicate that patients with baseline HBsAg levels below 500∼1000 IU/mL have a higher likelihood of achieving HBsAg loss (17%) when treated with NAs-IFN combination regimen. These findings highlight the importance of quantifying the baseline HBsAg levels in the management of CHB to optimize therapeutic outcomes in terms of HBsAg loss.
None.


