


Liver cancer is a commonly diagnosed malignancy associated with high mortality worldwide [1]. HCC is the most common type of primary liver cancer, accounting for more than 75% of cases [1,2]. Specific risk factors for HCC vary geographically; however, chronic infection with HBV or HCV are among the most common etiologies [2,3]. Estimates suggest that 54% of liver cancer cases globally are caused by HBV infection and another 31% are caused by HCV infection [4]. Therefore, both HBV and HCV are common comorbidities in patients with HCC. Despite the recognition of risk factors and improvements in detection, more than half of patients present with advanced-stage disease (Barcelona Clinic Liver Cancer [BCLC] stage C) in most regions of the world [5].
In recent years, immunotherapy agents are increasingly used in patients with hepatocellular carcinoma, a population of patients with a high prevalence of underlying viral hepatitis [6,7]. In particular, combinations of bevacizumab and atezolizumab, ipilimumab and nivolumab, and durvalumab and tremelimumab are often used in the first-line setting for patients with advanced disease, with tyrosine kinase inhibitors often being used in second-line disease [8–20]. Alterations in HBV and HCV virologic control have been reported in patients with HCC receiving chemotherapy, resulting in disruptions to treatment and occasionally early termination of treatment [21]. Changes in HCV and HBV viral load and serology have also been reported in patients with cancer receiving treatment with immune checkpoint inhibitors (ICIs); however, the effects of programmed cell death protein 1 (PD-1) inhibitors in patients with HCC who have HBV or HCV infection have not been thoroughly evaluated in the prospective setting [22–26]. Therefore, it is vital to understand the safety profile and impact of immunotherapy in patients with HCC who have a history or who are currently infected with HBV or HCV.
Pembrolizumab, a PD-1 inhibitor, is approved in the United States as treatment for patients with HCC secondary to hepatitis B who received prior systemic therapy other than a PD-(L)1–containing regimen [27]. The clinical activity and tolerability of pembrolizumab in patients with advanced HCC previously treated with sorafenib was demonstrated in the KEYNOTE-224, KEYNOTE-240, and KEYNOTE-394 studies [28–30]. In the phase II KEYNOTE-224 study, the objective response rate (ORR) with pembrolizumab was 17% (95% CI, 11.0%–26.0%); median duration of response (DOR) was not reached (3.1 to 14.6+ months) [28]. In longer-term follow-up with a median of 83.0 months (range, 79.3–87.3 months) from randomization to data cutoff, the median DOR was 21.0 months (3.1 to 75.8+ months); 77% of patients had responses lasting ≥12 months by Kaplan-Meier analysis [31]. In the randomized, placebo-controlled, phase III KEYNOTE-240 study, pembrolizumab numerically improved overall survival (OS) and progression-free survival (PFS) compared with placebo; however, the study did not meet prespecified statistical significance criteria for these end points [13,29]. In the randomized phase III KEYNOTE-394 study, second-line pembrolizumab significantly improved OS (HR, 0.79; 95% CI, 0.63–0.99; p = 0.0180), PFS (HR, 0.74; 95% CI, 0.60–0.92; p = 0.0032), and ORR (12.7% vs 1.3%; p < 0.0001) versus placebo in patients from Asia with advanced HCC [30]. In all 3 studies, the safety profile was manageable and consistent with previous findings for pembrolizumab [28–30]. These studies demonstrated a favorable benefit-to-risk profile of pembrolizumab monotherapy in patients with advanced HCC in the second-line setting.
The increasing importance of PD-(L)1 inhibition in HCC emphasizes the need to understand the impact of this type of immunotherapy use on underlying viral hepatitis. This analysis evaluated changes in hepatitis viral load and serologies, as measured by concurrent changes in transaminase levels and hepatitis viral load in sorafenib-treated patients with advanced HCC who had evidence of past or current HBV or HCV infection and who were receiving immunotherapy with pembrolizumab in the KEYNOTE-224 and KEYNOTE-240 studies.
2Materials and Methods2.1Study designThis was a post hoc analysis of the global KEYNOTE-224 (NCT02702414) and KEYNOTE-240 (NCT02702401) studies (Fig. S1) which had common hepatitis enrollment criteria [28,29]. Details of the study designs, eligibility criteria, and final analysis results have been published [28,29]. In brief, KEYNOTE-224 was a nonrandomized, open-label, phase II study. All patients received pembrolizumab 200 mg intravenously once every 3 weeks (Q3W) for ≤35 cycles or until confirmed disease progression, unacceptable toxicity, or withdrawal from the study. The primary end point was ORR, and secondary end points included safety [28]. KEYNOTE-240 (NCT02702401) was a randomized, placebo-controlled, double-blind phase III study. Patients were randomly assigned 2:1 to receive pembrolizumab 200 mg intravenously Q3W or placebo, each in combination with best supportive care, for ≤35 cycles or until confirmed disease progression, unacceptable toxicity, or withdrawal from the study. The primary end points were OS and PFS, and secondary end points included ORR and safety [29].
Both study protocols and all amendments were conducted in accordance with principles of Good Clinical Practice and approved by the appropriate institutional review boards and regulatory agencies. Written informed consent was provided by all participants before enrollment.
2.2PatientsThe KEYNOTE-224 and KEYNOTE-240 studies enrolled adults with radiographically or pathologically confirmed HCC and BCLC stage C or B disease that was not amenable or refractory to locoregional therapy and not amenable to curative treatment. Patients were required to have Child-Pugh A liver disease; Eastern Cooperative Oncology Group performance status 0 or 1; otherwise adequate organ function, including liver function (total bilirubin ≤2 mg/dl or direct bilirubin less than or equal to the upper limit of normal [ULN] for those with total bilirubin >2 mg/dl; aspartate aminotransferase (AST) and ALT ≤5× ULN; albumin ≥3.0 g/dl); and at least one measurable lesion confirmed by blinded central imaging review per Response Evaluation Criteria in Solid Tumors, version 1.1 (RECIST v1.1). Patients in both studies were required to have documented disease progression after sorafenib treatment or intolerance to sorafenib treatment. Patients previously treated with an anti–PD-1, anti–programmed cell death ligand 1 (PD-L1), or anti–PD-L2 agent or who had previously received systemic therapy for advanced HCC (other than sorafenib), with dual HBV and HCV infection, HDV infection, or with a known history of HIV, were excluded.
The current analysis comprised patients with serologic tests that were positive for HBsAg and/or with detectable HBV DNA levels (referred to hereafter as patients positive for HBsAg and/or with detectable HBV); positive for hepatitis B core antibody ([total] anti-HBc), negative for HBsAg, and with undetectable HBV DNA levels (referred to hereafter as patients positive for isolated anti-HBc); positive for HCV antibody (anti-HCV) and with detectable HCV RNA levels (referred to hereafter as patients infected with HCV); and positive for anti-HCV and with undetectable HCV RNA levels (referred to hereafter as patients previously infected with HCV). Patients positive for HBsAg and/or with detectable HBV were required to have received HBV antiviral treatment for ≥3 months and have an HBV viral load <100 IU/ml before the first dose of study treatment and to continue the same antiviral treatment throughout the study. Patients positive for isolated anti-HBc were not required to have received HBV antiviral treatment, and patients infected or previously infected with HCV were not required to have received HCV antiviral treatment or meet a specific viral load threshold.
2.3AssessmentsIn both studies, ALT and AST levels were locally assessed in all patients at baseline, Q3W during treatment, and at 30 days after the final dose. Anti-HBc (total and IgM), HBs antibody (anti-HBs), HBV viral load, and HBsAg were assessed at baseline. In patients with serologic tests that were either positive for HBsAg or positive for anti-HBc, negative for anti-HBs, negative for HBsAg and who had a viral load <100 IU/ml, anti-hepatitis D virus (HDV), hepatitis B early antigen (anti-HBeAg), and HBeAg were assessed (locally in KEYNOTE-224 and centrally in KEYNOTE-240) at baseline. Additionally, in these patients HBsAg and HBV viral load were assessed (locally in KEYNOTE-224 and centrally in KEYNOTE-240) Q3W during treatment and 30 days after the final dose; anti-HBc (total), hepatitis B early antibody (anti-HBe), anti-HBs, and HBeAg levels were assessed every 12 weeks and 30 days after the final dose. In patients with serologic tests that were positive for hepatitis C antibody, HCV genotype and viral load were assessed at baseline, and HCV viral load was assessed by a central laboratory Q3W during treatment and 30 days after the final dose. HBV DNA was considered detectable if it did not meet the lower limit of quantification and was not reported as undetectable.
Laboratory tests for HBV and HCV infection were also conducted for all patients with hepatic events of clinical interest (defined as prespecified elevations in ALT, AST, total bilirubin, and hepatic decompensation). Thresholds for elevations in ALT or AST were defined as follows: baseline ALT or AST <2× ULN and postbaseline ALT or AST ≥5× ULN; baseline ALT or AST ≥2× ULN and postbaseline ALT or AST >3× baseline; and ALT or AST >500 U/l regardless of baseline level. Elevations in total bilirubin were determined by one of the following three criteria: baseline bilirubin <1.5 mg/dl and postbaseline bilirubin >2.0 mg/dl; baseline bilirubin ≥1.5 mg/dl and postbaseline bilirubin ≥2× baseline; and bilirubin >3.0 mg/dl regardless of baseline level. Virally induced hepatitis flare was defined as >1 log increase from baseline and >1000 IU/ml viral load with a concurrent ALT elevation. ALT elevations were defined according to criteria noted above within 7 days of a viral load increase.
2.4Statistical analysisData for this analysis are presented for the as-treated population of KEYNOTE-224, defined as all patients who received ≥1 dose of study treatment (efficacy population), and data are presented for the intention-to-treat population of KEYNOTE-240, defined as all randomly assigned patients (efficacy population). End points were analyzed using descriptive statistics in this post hoc analysis. The data cutoff dates were February 13, 2018, for KEYNOTE-224 and January 2, 2019, for KEYNOTE-240. All statistical analyses were performed using SAS, version 9.4 (SAS, Cary, NC, USA).
2.5Role of the funding sourceThe study sponsor funded the design and conduct of the study and the data collection. All authors had access to the data and vouch for the integrity of the data analyses. All authors were involved in the preparation of this paper and agreed to submit it for publication.
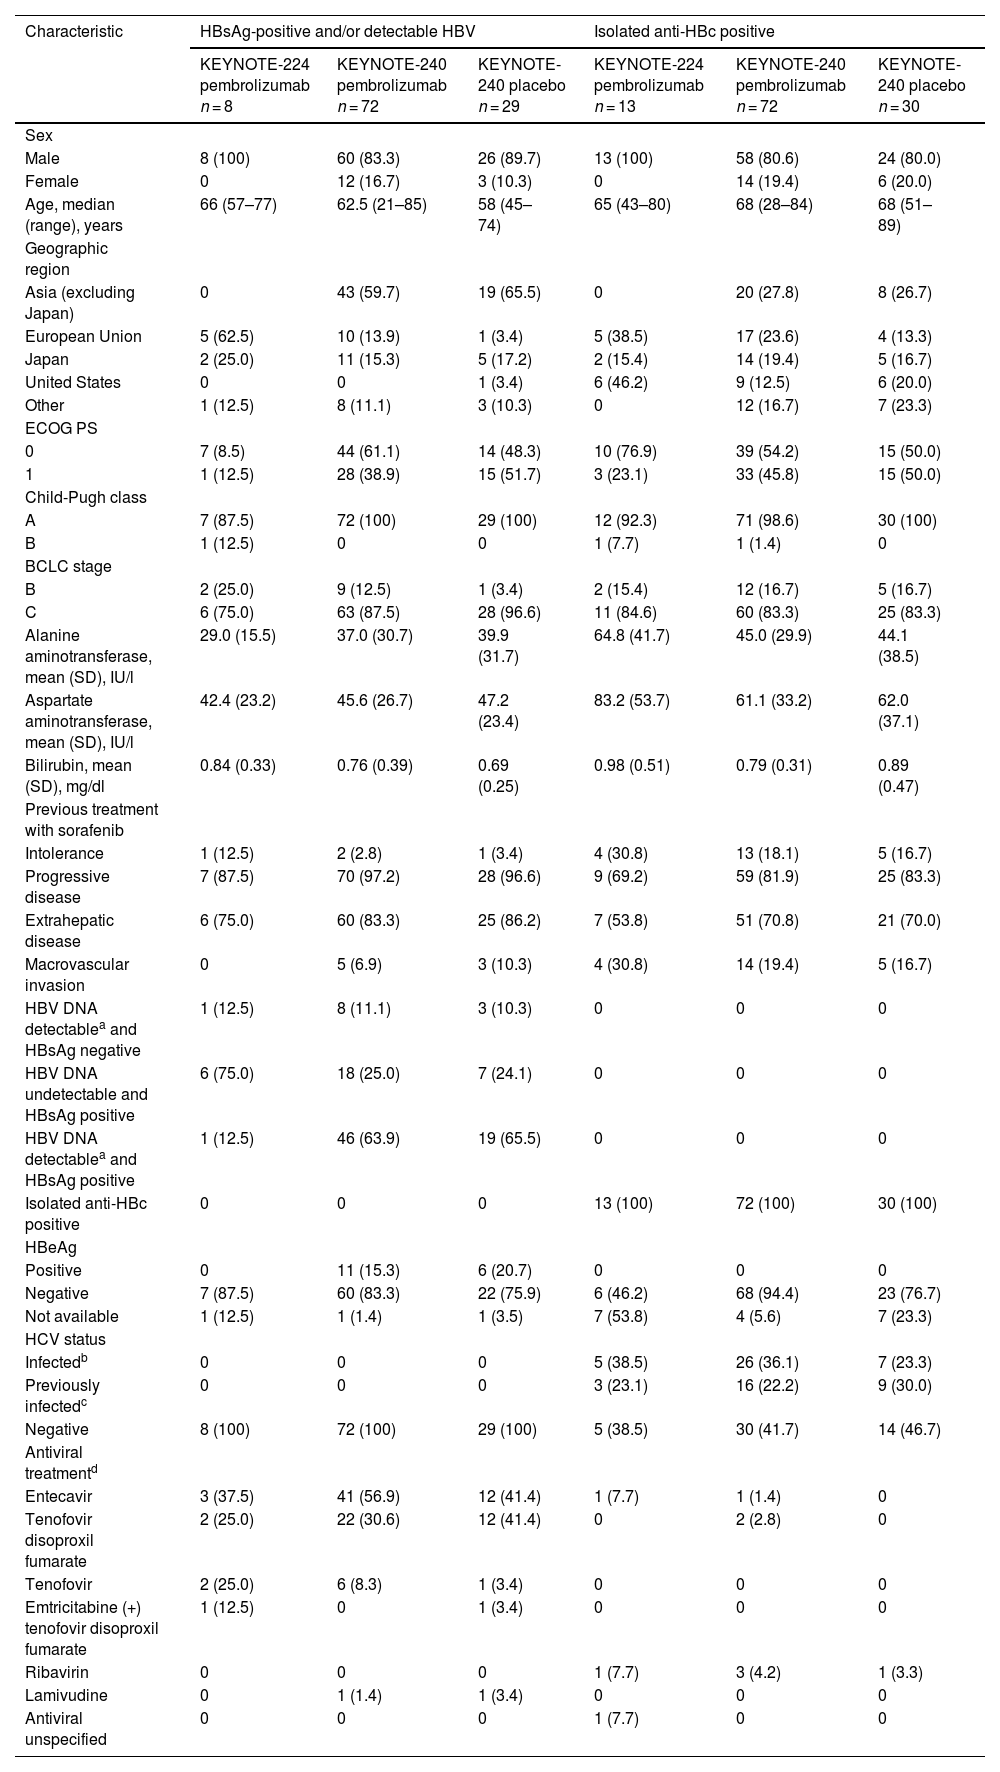
3Results3.1Hepatitis B virus infectionA total of 224 patients positive for HBsAg and/or with detectable HBV or positive for isolated anti-HBc were included (KEYNOTE-224, n = 21; KEYNOTE-240, n = 203) (Table 1). There were 109 patients positive for HBsAg and/or with detectable HBV and 115 patients positive for isolated anti-HBc. Among those positive for HBsAg and/or with detectable HBV, 80 (73.4%) received pembrolizumab and 29 (26.6%) received placebo. Among those positive for isolated anti-HBc, 85 (73.9%) received pembrolizumab and 30 (26.1%) received placebo.
Baseline demographic and clinical characteristics in patients with HBV infection.
| Characteristic | HBsAg-positive and/or detectable HBV | Isolated anti-HBc positive | ||||
|---|---|---|---|---|---|---|
| KEYNOTE-224 pembrolizumab n = 8 | KEYNOTE-240 pembrolizumab n = 72 | KEYNOTE-240 placebo n = 29 | KEYNOTE-224 pembrolizumab n = 13 | KEYNOTE-240 pembrolizumab n = 72 | KEYNOTE-240 placebo n = 30 | |
| Sex | ||||||
| Male | 8 (100) | 60 (83.3) | 26 (89.7) | 13 (100) | 58 (80.6) | 24 (80.0) |
| Female | 0 | 12 (16.7) | 3 (10.3) | 0 | 14 (19.4) | 6 (20.0) |
| Age, median (range), years | 66 (57–77) | 62.5 (21–85) | 58 (45–74) | 65 (43–80) | 68 (28–84) | 68 (51–89) |
| Geographic region | ||||||
| Asia (excluding Japan) | 0 | 43 (59.7) | 19 (65.5) | 0 | 20 (27.8) | 8 (26.7) |
| European Union | 5 (62.5) | 10 (13.9) | 1 (3.4) | 5 (38.5) | 17 (23.6) | 4 (13.3) |
| Japan | 2 (25.0) | 11 (15.3) | 5 (17.2) | 2 (15.4) | 14 (19.4) | 5 (16.7) |
| United States | 0 | 0 | 1 (3.4) | 6 (46.2) | 9 (12.5) | 6 (20.0) |
| Other | 1 (12.5) | 8 (11.1) | 3 (10.3) | 0 | 12 (16.7) | 7 (23.3) |
| ECOG PS | ||||||
| 0 | 7 (8.5) | 44 (61.1) | 14 (48.3) | 10 (76.9) | 39 (54.2) | 15 (50.0) |
| 1 | 1 (12.5) | 28 (38.9) | 15 (51.7) | 3 (23.1) | 33 (45.8) | 15 (50.0) |
| Child-Pugh class | ||||||
| A | 7 (87.5) | 72 (100) | 29 (100) | 12 (92.3) | 71 (98.6) | 30 (100) |
| B | 1 (12.5) | 0 | 0 | 1 (7.7) | 1 (1.4) | 0 |
| BCLC stage | ||||||
| B | 2 (25.0) | 9 (12.5) | 1 (3.4) | 2 (15.4) | 12 (16.7) | 5 (16.7) |
| C | 6 (75.0) | 63 (87.5) | 28 (96.6) | 11 (84.6) | 60 (83.3) | 25 (83.3) |
| Alanine aminotransferase, mean (SD), IU/l | 29.0 (15.5) | 37.0 (30.7) | 39.9 (31.7) | 64.8 (41.7) | 45.0 (29.9) | 44.1 (38.5) |
| Aspartate aminotransferase, mean (SD), IU/l | 42.4 (23.2) | 45.6 (26.7) | 47.2 (23.4) | 83.2 (53.7) | 61.1 (33.2) | 62.0 (37.1) |
| Bilirubin, mean (SD), mg/dl | 0.84 (0.33) | 0.76 (0.39) | 0.69 (0.25) | 0.98 (0.51) | 0.79 (0.31) | 0.89 (0.47) |
| Previous treatment with sorafenib | ||||||
| Intolerance | 1 (12.5) | 2 (2.8) | 1 (3.4) | 4 (30.8) | 13 (18.1) | 5 (16.7) |
| Progressive disease | 7 (87.5) | 70 (97.2) | 28 (96.6) | 9 (69.2) | 59 (81.9) | 25 (83.3) |
| Extrahepatic disease | 6 (75.0) | 60 (83.3) | 25 (86.2) | 7 (53.8) | 51 (70.8) | 21 (70.0) |
| Macrovascular invasion | 0 | 5 (6.9) | 3 (10.3) | 4 (30.8) | 14 (19.4) | 5 (16.7) |
| HBV DNA detectablea and HBsAg negative | 1 (12.5) | 8 (11.1) | 3 (10.3) | 0 | 0 | 0 |
| HBV DNA undetectable and HBsAg positive | 6 (75.0) | 18 (25.0) | 7 (24.1) | 0 | 0 | 0 |
| HBV DNA detectablea and HBsAg positive | 1 (12.5) | 46 (63.9) | 19 (65.5) | 0 | 0 | 0 |
| Isolated anti-HBc positive | 0 | 0 | 0 | 13 (100) | 72 (100) | 30 (100) |
| HBeAg | ||||||
| Positive | 0 | 11 (15.3) | 6 (20.7) | 0 | 0 | 0 |
| Negative | 7 (87.5) | 60 (83.3) | 22 (75.9) | 6 (46.2) | 68 (94.4) | 23 (76.7) |
| Not available | 1 (12.5) | 1 (1.4) | 1 (3.5) | 7 (53.8) | 4 (5.6) | 7 (23.3) |
| HCV status | ||||||
| Infectedb | 0 | 0 | 0 | 5 (38.5) | 26 (36.1) | 7 (23.3) |
| Previously infectedc | 0 | 0 | 0 | 3 (23.1) | 16 (22.2) | 9 (30.0) |
| Negative | 8 (100) | 72 (100) | 29 (100) | 5 (38.5) | 30 (41.7) | 14 (46.7) |
| Antiviral treatmentd | ||||||
| Entecavir | 3 (37.5) | 41 (56.9) | 12 (41.4) | 1 (7.7) | 1 (1.4) | 0 |
| Tenofovir disoproxil fumarate | 2 (25.0) | 22 (30.6) | 12 (41.4) | 0 | 2 (2.8) | 0 |
| Tenofovir | 2 (25.0) | 6 (8.3) | 1 (3.4) | 0 | 0 | 0 |
| Emtricitabine (+) tenofovir disoproxil fumarate | 1 (12.5) | 0 | 1 (3.4) | 0 | 0 | 0 |
| Ribavirin | 0 | 0 | 0 | 1 (7.7) | 3 (4.2) | 1 (3.3) |
| Lamivudine | 0 | 1 (1.4) | 1 (3.4) | 0 | 0 | 0 |
| Antiviral unspecified | 0 | 0 | 0 | 1 (7.7) | 0 | 0 |
Data are n (%) unless otherwise specified.
Abbreviations: BCLC, Barcelona Clinic Liver Cancer; ECOG PS, Eastern Cooperative Oncology Group performance status; HBc, hepatitis B core antibody; HBeAg, hepatitis B early antigen; HBsAg, hepatitis B surface antigen; HBV, hepatitis B virus; HCV, hepatitis C virus.
Baseline disease characteristics were generally similar in pembrolizumab- and placebo-treated patients (Table 1). Most patients positive for HBsAg and/or with detectable HBV received antiviral treatment for HBV before starting study treatment (KEYNOTE-224: pembrolizumab, n = 7/8 [87.5%]; KEYNOTE-240: pembrolizumab, n = 66/72 [91.7%], and placebo, n = 25/29 [86.2%]). The most common antiviral treatment in patients positive for HBsAg and/or with detectable HBV DNA levels was entecavir (KEYNOTE-224: pembrolizumab, 3/8 [37.5%]; KEYNOTE-240: pembrolizumab, 41/72 [56.9%] and placebo, 12/29 [41.4%]) (Table 1). Among patients who were positive for isolated anti-HBc, few received antiviral treatment for HBV before starting study treatment (KEYNOTE-224: pembrolizumab, n = 3/13 [23.1%]; KEYNOTE-240: pembrolizumab, n = 6/72 [8.3%] and placebo, n = 1/30 [3.3%]). There was 1 patient receiving pembrolizumab in KEYNOTE-224 who was positive for isolated anti-HBc who received an unspecified antiviral treatment. All patients who received antiviral therapy for HBV infection at the time of study initiation remained on therapy throughout the study except one. This patient was randomly assigned to the placebo arm and had prolonged interruption of antiviral therapy during receipt of study intervention. Antiviral therapy was reinitiated after discontinuation of study intervention. No patient positive for HBsAg and/or with detectable HBV was infected with HCV; among patients positive for isolated anti-HBc, 38 were infected with HCV (KEYNOTE-224: pembrolizumab, 5/13 [38.5%]; KEYNOTE-240: pembrolizumab, 26/72 [36.1%], and placebo, 7/30 [23.3%]) and 28 were previously infected with HCV (KEYNOTE-224: pembrolizumab, 3/13 [23.1%]; KEYNOTE-240: pembrolizumab, 16/72 [22.2%], and placebo, 9/30 [30.0%]). The median duration of pembrolizumab exposure was 4.0 months (range, 0.0–18.0 months) in KEYNOTE-224 and 3.5 months (range, 0.0–24.4 months) in KEYNOTE-240.
A >2 log increase in HBV DNA without ALT elevation were observed in 4 patients (5.6%) positive for HBsAg and/or with detectable HBV receiving pembrolizumab and 1 (3.4%) receiving placebo. A >3 log increase in HBV DNA without ALT elevation was reported in a single patient receiving placebo in KEYNOTE-240. A >1 log decrease in HBV DNA without ALT elevation was observed in 29 patients (40.3%) positive for HBsAg and/or with detectable HBV receiving pembrolizumab and 8 patients (27.6%) receiving placebo in KEYNOTE-240 (Fig. 1A). No patient in KEYNOTE-224 had a decrease >1 log or an increase >1 log, >2 log, or >3 log in HBV DNA level. Changes in ALT level ≥3× baseline and >100 U/l from baseline or ALT and AST to >5× ULN and/or >3× baseline were generally uncommon and were reported at similar frequencies in patients positive for HBsAg and/or with detectable HBV who were receiving pembrolizumab or placebo (Fig. 1A).
 positive for HBsAg and/or with detectable HBV and (B) positive for isolated anti-HBc. aViral hepatitis flare was defined as a >1 log postbaseline increase and >1000 IU/ml viral load with a concurrent ALT elevation. ALT elevation was one of the following ± 7 days of viral load increase: (1) baseline ALT <2× ULN and postbaseline ALT ≥5× ULN; (2) baseline ALT ≥2× ULN and postbaseline ALT >3× baseline; or (3) ALT >500 U/l regardless of baseline level. Abbreviations: ALT, alanine aminotransferase; BL, baseline; HBc, hepatitis B core antibody; HBsAg, hepatitis B surface antigen; HBV, hepatitis B virus; ULN, upper limit of normal.")
Changes in HBV viral load and incidence of viral hepatitis flare in patients (A) positive for HBsAg and/or with detectable HBV and (B) positive for isolated anti-HBc. aViral hepatitis flare was defined as a >1 log postbaseline increase and >1000 IU/ml viral load with a concurrent ALT elevation. ALT elevation was one of the following ± 7 days of viral load increase: (1) baseline ALT <2× ULN and postbaseline ALT ≥5× ULN; (2) baseline ALT ≥2× ULN and postbaseline ALT >3× baseline; or (3) ALT >500 U/l regardless of baseline level. Abbreviations: ALT, alanine aminotransferase; BL, baseline; HBc, hepatitis B core antibody; HBsAg, hepatitis B surface antigen; HBV, hepatitis B virus; ULN, upper limit of normal.
Among patients positive for isolated anti-HBc, ALT elevations ≥3× baseline and >100 U/L postbaseline were reported in 1 patient (7.7%) receiving pembrolizumab in KEYNOTE-224, 15 patients (20.8%) receiving pembrolizumab in KEYNOTE-240, and 2 patients (6.7%) receiving placebo in KEYNOTE-240 (Fig. 1B). Although ALT elevations were observed in these patients, HBV DNA remained undetectable throughout treatment. The proportions of patients with ALT and AST that were increased to >5× ULN and/or >3× baseline in patients positive for isolated anti-HBc receiving pembrolizumab and placebo were 16.7% and 13.3%, respectively (Fig. 1B). Of patients with baseline assessment of HBeAg (KEYNOTE-224: n = 13; KEYNOTE-240: n = 190), no patient had seroconversion (defined as HBeAg negative at baseline and HBeAg positive postbaseline).
The time courses of changes in ALT and HBV DNA in 7 patients receiving pembrolizumab (KEYNOTE-224, n = 1; KEYNOTE-240, n = 6) with baseline ALT elevations ≥3× baseline and >100 U/L postbaseline are shown in Fig. S2. All 7 patients were receiving antiviral treatment before starting pembrolizumab treatment and continued throughout the study except for 1 patient who stopped during the study (patient 7 [day 15]). The duration of pembrolizumab in these patients ranged from 22 to 166 days. One patient positive for HBsAg and/or with detectable HBV receiving placebo in KEYNOTE-240 met the criteria for HBV viral-induced hepatitis flare.
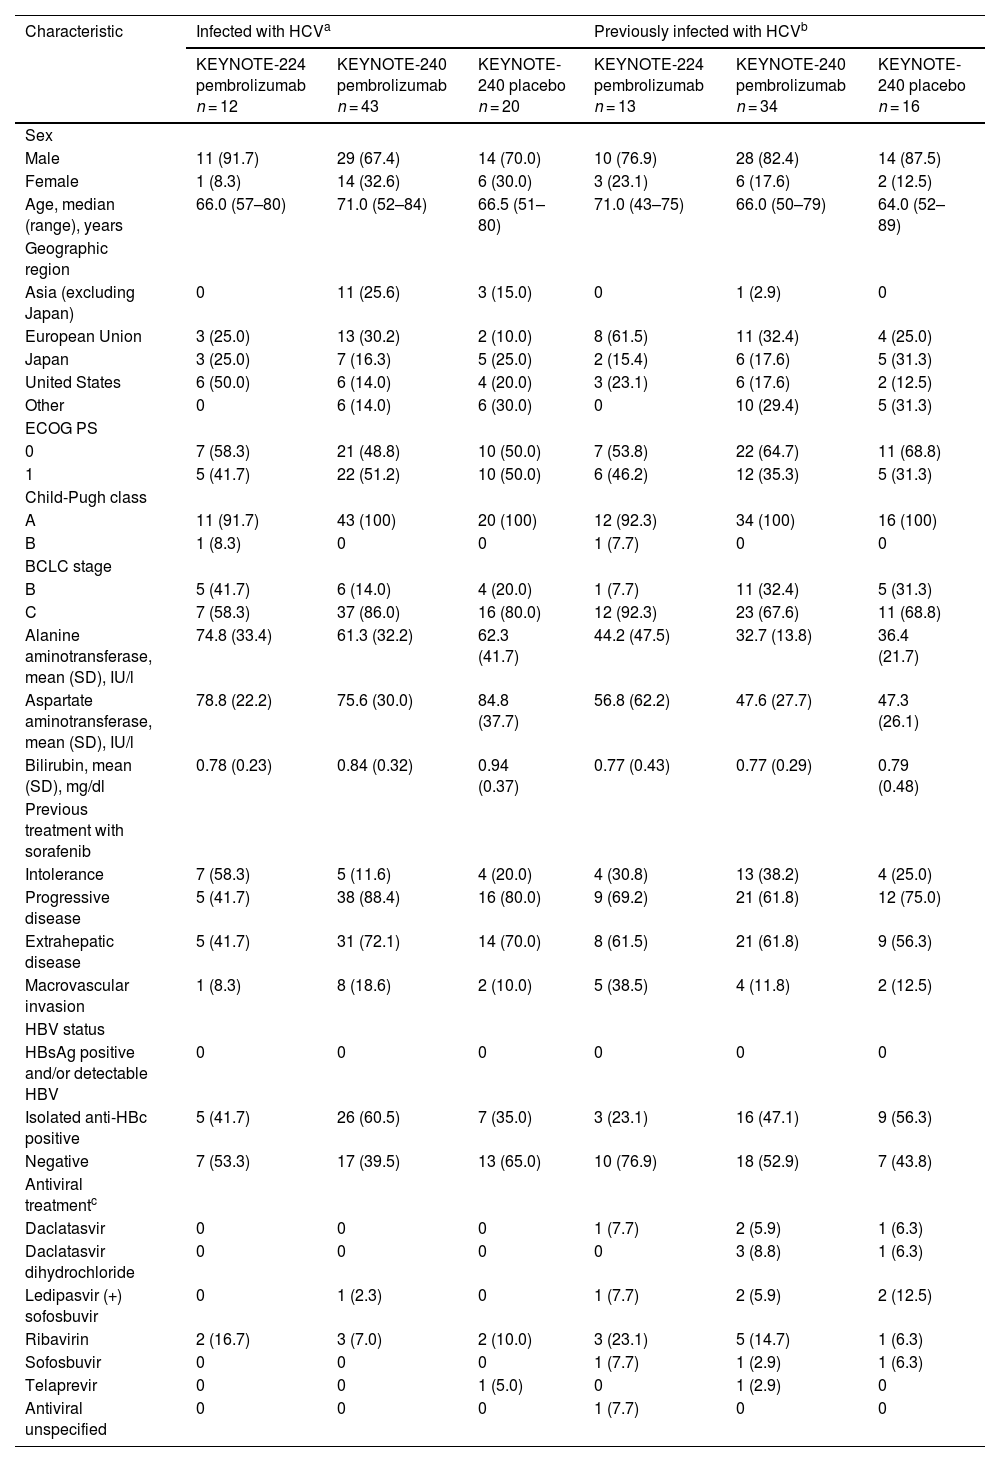
3.2Hepatitis C virus infectionA total of 138 patients infected or previously infected with HCV were included (Table 2). No patient infected or previously infected with HCV was positive for HBsAg and/or had detectable HBV. Among patients infected with HCV, 38 were positive for isolated anti-HBc (KEYNOTE-224: pembrolizumab, 5/12 [41.7%]; KEYNOTE-240: pembrolizumab, 26/43 [60.5%], and placebo, 7/20 [35.0%]). For these 38 patients, the baseline mean viral load was 6.23 log10 IU/ml (range, 5.50–6.99 log10 IU/ml) in KEYNOTE-224 (n = 5) and 5.69 log10 IU/ml (range, 2.47–7.03 log10 IU/ml) in KEYNOTE-240 (n = 33). Among patients previously infected with HCV, 28 were positive for isolated anti-HBc (KEYNOTE-224: pembrolizumab, 3/13 [23.1%]; KEYNOTE-240: pembrolizumab, 16/34 [47.1%], and placebo, 9/16 [56.3%]). Few patients infected or previously infected with HCV received antiviral treatment before starting study treatment (Table 2). The median duration of pembrolizumab exposure for patients infected with HCV at baseline was 5.2 months for those in KEYNOTE-224 and 3.6 months for those in KEYNOTE-240. Among patients previously infected, the median duration of pembrolizumab exposure was 2.1 months for those in KEYNOTE-224 and 3.5 months for those in KEYNOTE-240.
Baseline demographic and clinical characteristics in patients with HCV infection.
| Characteristic | Infected with HCVa | Previously infected with HCVb | ||||
|---|---|---|---|---|---|---|
| KEYNOTE-224 pembrolizumab n = 12 | KEYNOTE-240 pembrolizumab n = 43 | KEYNOTE-240 placebo n = 20 | KEYNOTE-224 pembrolizumab n = 13 | KEYNOTE-240 pembrolizumab n = 34 | KEYNOTE-240 placebo n = 16 | |
| Sex | ||||||
| Male | 11 (91.7) | 29 (67.4) | 14 (70.0) | 10 (76.9) | 28 (82.4) | 14 (87.5) |
| Female | 1 (8.3) | 14 (32.6) | 6 (30.0) | 3 (23.1) | 6 (17.6) | 2 (12.5) |
| Age, median (range), years | 66.0 (57–80) | 71.0 (52–84) | 66.5 (51–80) | 71.0 (43–75) | 66.0 (50–79) | 64.0 (52–89) |
| Geographic region | ||||||
| Asia (excluding Japan) | 0 | 11 (25.6) | 3 (15.0) | 0 | 1 (2.9) | 0 |
| European Union | 3 (25.0) | 13 (30.2) | 2 (10.0) | 8 (61.5) | 11 (32.4) | 4 (25.0) |
| Japan | 3 (25.0) | 7 (16.3) | 5 (25.0) | 2 (15.4) | 6 (17.6) | 5 (31.3) |
| United States | 6 (50.0) | 6 (14.0) | 4 (20.0) | 3 (23.1) | 6 (17.6) | 2 (12.5) |
| Other | 0 | 6 (14.0) | 6 (30.0) | 0 | 10 (29.4) | 5 (31.3) |
| ECOG PS | ||||||
| 0 | 7 (58.3) | 21 (48.8) | 10 (50.0) | 7 (53.8) | 22 (64.7) | 11 (68.8) |
| 1 | 5 (41.7) | 22 (51.2) | 10 (50.0) | 6 (46.2) | 12 (35.3) | 5 (31.3) |
| Child-Pugh class | ||||||
| A | 11 (91.7) | 43 (100) | 20 (100) | 12 (92.3) | 34 (100) | 16 (100) |
| B | 1 (8.3) | 0 | 0 | 1 (7.7) | 0 | 0 |
| BCLC stage | ||||||
| B | 5 (41.7) | 6 (14.0) | 4 (20.0) | 1 (7.7) | 11 (32.4) | 5 (31.3) |
| C | 7 (58.3) | 37 (86.0) | 16 (80.0) | 12 (92.3) | 23 (67.6) | 11 (68.8) |
| Alanine aminotransferase, mean (SD), IU/l | 74.8 (33.4) | 61.3 (32.2) | 62.3 (41.7) | 44.2 (47.5) | 32.7 (13.8) | 36.4 (21.7) |
| Aspartate aminotransferase, mean (SD), IU/l | 78.8 (22.2) | 75.6 (30.0) | 84.8 (37.7) | 56.8 (62.2) | 47.6 (27.7) | 47.3 (26.1) |
| Bilirubin, mean (SD), mg/dl | 0.78 (0.23) | 0.84 (0.32) | 0.94 (0.37) | 0.77 (0.43) | 0.77 (0.29) | 0.79 (0.48) |
| Previous treatment with sorafenib | ||||||
| Intolerance | 7 (58.3) | 5 (11.6) | 4 (20.0) | 4 (30.8) | 13 (38.2) | 4 (25.0) |
| Progressive disease | 5 (41.7) | 38 (88.4) | 16 (80.0) | 9 (69.2) | 21 (61.8) | 12 (75.0) |
| Extrahepatic disease | 5 (41.7) | 31 (72.1) | 14 (70.0) | 8 (61.5) | 21 (61.8) | 9 (56.3) |
| Macrovascular invasion | 1 (8.3) | 8 (18.6) | 2 (10.0) | 5 (38.5) | 4 (11.8) | 2 (12.5) |
| HBV status | ||||||
| HBsAg positive and/or detectable HBV | 0 | 0 | 0 | 0 | 0 | 0 |
| Isolated anti-HBc positive | 5 (41.7) | 26 (60.5) | 7 (35.0) | 3 (23.1) | 16 (47.1) | 9 (56.3) |
| Negative | 7 (53.3) | 17 (39.5) | 13 (65.0) | 10 (76.9) | 18 (52.9) | 7 (43.8) |
| Antiviral treatmentc | ||||||
| Daclatasvir | 0 | 0 | 0 | 1 (7.7) | 2 (5.9) | 1 (6.3) |
| Daclatasvir dihydrochloride | 0 | 0 | 0 | 0 | 3 (8.8) | 1 (6.3) |
| Ledipasvir (+) sofosbuvir | 0 | 1 (2.3) | 0 | 1 (7.7) | 2 (5.9) | 2 (12.5) |
| Ribavirin | 2 (16.7) | 3 (7.0) | 2 (10.0) | 3 (23.1) | 5 (14.7) | 1 (6.3) |
| Sofosbuvir | 0 | 0 | 0 | 1 (7.7) | 1 (2.9) | 1 (6.3) |
| Telaprevir | 0 | 0 | 1 (5.0) | 0 | 1 (2.9) | 0 |
| Antiviral unspecified | 0 | 0 | 0 | 1 (7.7) | 0 | 0 |
Data are n (%) unless otherwise specified.
Abbreviations: BCLC, Barcelona Clinic Liver Cancer; ECOG PS, Eastern Cooperative Oncology Group performance status; HBc, hepatitis B core antibody; HBsAg, hepatitis B surface antigen; HBV, hepatitis B virus; HCV, hepatitis C virus.
Among patients infected with HCV, increases in HCV RNA of >1 log and to levels >1000 IU/ml without ALT elevation were reported in similar proportions of patients receiving pembrolizumab or placebo in KEYNOTE-240 (Fig. 2A). A >1 log decrease in HCV RNA without ALT elevation was observed in 3 patients (25.0%) receiving pembrolizumab in KEYNOTE-224, 10 patients (23.3%) receiving pembrolizumab in KEYNOTE-240, and 2 patients receiving placebo (10.0%) in KEYNOTE-240 (Fig. 2A). One patient (2.3%) infected with HCV who was receiving pembrolizumab in KEYNOTE-240 met the criteria for a viral hepatitis flare. In this patient, HCV RNA decreased from 4449 to 2776 IU/ml at the time of the initial ALT elevation while the patient was receiving pembrolizumab. However, a viral load increase was documented 1 month after pembrolizumab discontinuation and initiation of high-dose steroids. Normalization of ALT and decreasing viral load (to 15 IU/ml) was observed with subsequent antiviral therapy. This event was not considered related to pembrolizumab.
 infected with HCV and (B) previously infected with HCV. aViral hepatitis flare was defined as a >1 log postbaseline increase and >1000 IU/ml viral load with a concurrent ALT elevation. ALT elevation was one of the following ± 7 days of viral load increase: (1) baseline ALT <2× ULN and postbaseline ALT ≥5× ULN; (2) baseline ALT ≥2× ULN and postbaseline ALT >3× baseline; or (3) ALT >500 U/l regardless of baseline level. Abbreviations: ALT, alanine aminotransferase; HCV, hepatitis C virus; ULN, upper limit of normal.")
Changes in HCV viral load and incidence of viral hepatitis flare in patients (A) infected with HCV and (B) previously infected with HCV. aViral hepatitis flare was defined as a >1 log postbaseline increase and >1000 IU/ml viral load with a concurrent ALT elevation. ALT elevation was one of the following ± 7 days of viral load increase: (1) baseline ALT <2× ULN and postbaseline ALT ≥5× ULN; (2) baseline ALT ≥2× ULN and postbaseline ALT >3× baseline; or (3) ALT >500 U/l regardless of baseline level. Abbreviations: ALT, alanine aminotransferase; HCV, hepatitis C virus; ULN, upper limit of normal.
No patient previously infected with HCV in either treatment group of KEYNOTE-240 had a change in HCV RNA level. The proportions of patients with a change in ALT level ≥3× baseline and >100 U/l postbaseline or ALT and AST to >5× ULN and/or >3× baseline are shown in Fig. 2B.
4DiscussionData from this analysis provide insight into changes in HBV and HCV viral load that occur in patients receiving pembrolizumab for advanced HCC previously treated with sorafenib. These findings are particularly relevant given the clinical concerns surrounding ICIs and their potential impact on viral hepatitis reactivation in patients with HCC. Overall, the proportions of patients with increasing viral load were generally low and similar in patients receiving pembrolizumab and placebo. The low incidence of viral load increase provides reassurance for clinicians considering pembrolizumab for patients with chronic HBV or HCV. It is important to note that patients with evidence of active hepatitis B in these studies were required to be maintained on viral suppression. Transaminase elevations were also noted in generally similar proportions of patients positive for HBsAg and/or with detectable HBV or who were positive for isolated anti-HBc and were receiving pembrolizumab or placebo. No events of viral hepatitis flare were attributed to pembrolizumab use. Overall, the results show no clinically significant alterations in HBV DNA or HCV RNA in patients receiving pembrolizumab therapy for advanced HCC.
Published reports regarding an association between immune checkpoint inhibition and viral hepatitis viral load and serology are equivocal. Several reports have documented disruptions to HBV or HCV viral control during treatment with ICIs in patients with cancer, including HCC [22–25]; however, these studies must be interpreted cautiously given missing information, variability in information on the interval of HBV DNA monitoring, selection bias, different cutoffs for viral load, and varied use of antiviral treatment. In contrast, there are reports suggesting that ICI therapy does not directly impact viral hepatitis infection [26,32–35]. Pu and colleagues performed a systematic review of 14 studies that included 89 patients with HBV infection and 98 patients with HCV infection who were receiving an ICI therapy for advanced cancer [25]. Grade 3 or 4 transaminase elevations were reported in 3.4% and 17.3% of patients with HBV and HCV, respectively [25]. Two patients with HBV had increased HBV DNA levels leading to exacerbation of virus-related hepatitis (defined by elevated transaminase levels), and 1 patient with HCV also experienced a marked increase in HCV RNA viral load [25]. In contrast, in another retrospective analysis of patients with advanced cancer and viral hepatitis, there was no difference in pretreatment and posttreatment viral load in 6 patients (HBV, n = 4; HCV, n = 2) during ICI treatment [35]. Tio and colleagues reported that 28 patients with various advanced malignancies and HBV or HCV experienced no viral load increase >1 log during treatment with anti–PD-(L)1 therapy but that 5 patients experienced a decrease in viral load during treatment [34]. Finally, Lee and colleagues reported that among patients with HCC receiving ICI therapy, patients with or without a detectable viral load receiving antiviral treatment maintained optimal viral suppression during their cancer therapy [26]. Among the patients who were not receiving antiviral treatment, 3 experienced a decrease or no change in viral hepatitis load during ICI therapy, whereas 1 patient experienced HBV reactivation with a >10-fold increase in HBV DNA and ALT flare.
The variability in published reports underscores the complexity of interpreting ICI effects in virally-infected populations and highlights the need for standardized monitoring protocols, and the use of antiviral treatment among patients with HBV undergoing treatment for HCC with an ICI remains an area of ongoing research [24–26]. Inclusion criteria for the KEYNOTE-240 and KEYNOTE-244 studies stipulated that patients positive for HBsAg and/or with detectable HBV DNA were required to have received stable antiviral therapy for ≥3 months and have HBV DNA levels <100 IU/ml before initiating treatment. As a result, the proportion of patients who were not receiving antiviral treatment was small, but no events of viral-induced hepatitis occurred.
In the current study, no patient experienced detectable viremia during treatment with pembrolizumab. Sixteen patients positive for isolated anti-HBc had ALT elevations ≥3× baseline and >100 U/l postbaseline, but HBV DNA remained undetectable throughout treatment. The small number of patients prohibits meaningful correlations between HBV suppression and pembrolizumab treatment. Although the current study did not observe viral reactivation, the small sample size and limited number of participants not receiving antiviral therapy suggest that further prospective studies are needed to confirm these findings.
There are no clear data to support a causal relationship between immune checkpoint inhibition and altered viral hepatitis viral load and serology. Evidence suggests inhibition of the PD-(L)1 pathway and subsequent immune system activation may lead to liver damage, destruction of hepatocytes, and release of previously latent virus [24]. However, this hypothesis has not been supported by prospective clinical trial data. It has also been speculated that T-regulatory cells may play a role by enhancing suppression of CD4+ and CD8+ cells and alleviating the immune response to the virus [10]. This might occur because T-regulatory cells express cytotoxic T-lymphocyte–associated protein 4 (CTLA-4), and ICIs that block CTLA-4 may impair the ability of T-regulatory cells to keep the immune system suppressed.
A contrasting scientific rationale has been proposed for the use of PD-(L)1 blockade as a treatment approach for viral infection. Several studies have suggested that T-cell exhaustion in patients with chronic viral infection can be alleviated through blockade of the PD-(L)1 axis, reviving T-cell function, boosting immune response to the virus, and reducing viral hepatitis load [36–41]. The possibility that PD-(L)1 blockade may offer both antitumor and antiviral benefits is intriguing and warrants further exploration, particularly in patients with chronic HBV who may benefit from immune reactivation. This commonality with the tumor microenvironment, in which T-cell exhaustion is thought to contribute to tumor cell evasion of the immune system, has led some researchers to suggest that blockade of the PD-(L)1 pathway in patients with HCC and HBV infection might represent an approach to T-cell reactivation with both antitumor and antiviral benefits. Early-stage clinical trials have reported that in patients with chronic HBV infection receiving antiviral treatment, use of an anti–PD-1 antibody was associated with a decline in HBsAg titer in more than 90% of patients and resulted in a functional cure in 1 patient [39]. Significant reductions in HCV viral load have been shown with the CTLA-4 blocker tremelimumab in patients with HCC and chronic HCV infection [42]. A progressive reduction in viral load was observed in most patients, with 3 patients experiencing a transient complete viral response.
HBV and HCV infection are important etiologies for HCC, and our data support the inclusion of patients with these infections in future clinical trials of HCC with anti–PD-(L)1 therapies as long as the inclusion and monitoring criteria followed in these studies are followed in those future trials. Short-duration (8-12 weeks) highly effective treatments that are curative and that mitigate future risk associated with continued HCV infection are now available for patients with HCV. Thus, HCV infection should not be considered a barrier to the enrollment of patients with cancer in immunotherapy clinical trials [43]. Effective antiviral treatment is also available for patients with HBV, and evidence indicates that treatment can mitigate the risk for HBV-related complications during cancer treatment. As immunotherapy becomes increasingly integrated into HCC treatment paradigms, understanding its interaction with chronic viral infections will be essential for optimizing patient outcomes and guiding clinical decision-making.
5ConclusionsTo our knowledge, this analysis encompasses one of the largest patient populations in whom the impact of PD-(L)1 blockade on HBV or HCV infection in patients with advanced HCC has been evaluated. In addition, the use of data from the KEYNOTE-240 study permitted the evaluation of a placebo-treated population, providing insight on background changes in viral hepatitis load and transaminase levels that occur in patients with advanced HCC. This analysis has several limitations. Definitions of viral flare caused by HBV and HCV can vary across studies, and the criteria used in our analysis may differ from those used in other studies. Comparisons between studies should be made with caution. Patients positive for HBsAg and/or with detectable HBV in this analysis were required to have received antiviral treatment before study entry and have well-controlled infection. Therefore, these results may not be applicable to patients with uncontrolled HBV infection. This study also has several strengths. In conclusion, these results suggest that pembrolizumab does not increase risk of reactivation of hepatitis or cause viral-induced hepatitis flare in patients with advanced HCC.
S. L. Chan reports receiving advisory board fees from AstraZeneca, Eisai, and Merck Sharp & Dohme; reports being an invited speaker for AstraZeneca, Bayer, Bristol Myers Squibb, Eisai, Ipsen, Merck Sharp & Dohme, and Roche; and reports research funding (personal) from Bayer, Eisai, Ipsen, Merck Sharp & Dohme, and Sirtex. R. S. Finn reports grants (to his institution) from Adaptimmune, Bayer, Bristol Myers Squibb, Eli Lilly, Genentech, Novartis, Pfizer, and Roche; consulting fees (to himself) from Bayer, Bristol Myers Squibb, CStone, Eli Lilly, Genentech, Novartis, Pfizer, Roche, and Zai Labs; honoraria (to himself) from Genentech; and participation on a data safety monitoring board for AstraZeneca. J. Edeline reports no conflict of interest. S. Ogasawara reports grants from AstraZeneca, Bayer, Chugai Pharma, Eisai, Eli Lilly, and Gilead Sciences; consulting fees from AstraZeneca, Chugai Pharma, and Merck Sharp & Dohme; honoraria from AbbVie, AstraZeneca, Bayer, Chugai Pharma, Eisai, Eli Lilly, Gilead Sciences, and Takeda; and participation on a data safety monitoring board or advisory board for AstraZeneca, Chugai Pharma, and Merck Sharp & Dohme. J. J. Knox reports receiving a grant for an investigator-initiated trial from Merck Sharp & Dohme, consulting fees from AstraZeneca, Eisai, and Merck Sharp & Dohme, and payment for expert testimony from Incyte and AstraZeneca. B. Daniele reports advisory arrangements from AstraZeneca, Eisai, Merck Sharp & Dohme, Novocure, and Roche; speakers’ bureau for AstraZeneca, Incyte, and Roche; and grants/contracts from AstraZeneca and Roche. B.-Y. Ryoo reports no conflict of interest. P. Merle reports consulting fees from AstraZeneca, Bayer, Eisai, Ipsen, Lilly, and Roche. M. Bouattour reports personal fees for board membership from AbbVie, AstraZeneca, Bayer Pharma, Bristol Myers Squibb, Ipsen, Merck Sharp & Dohme, Roche, and Sirtex Medical. H.-Y. Lim reports a consulting or advisory role at AstraZeneca, Bayer, Bristol Myers Squibb, Eisai, Merck Sharp & Dohme, ONO, and Roche. Y. Chao reports no conflict of interest. T. Yau reports receiving advisory board fees from AstraZeneca, Bristol Myers Squibb, Merck Sharp & Dohme, and Roche. B. A. Haber is an employee of Merck Sharp & Dohme LLC, a subsidiary of Merck & Co., Inc., Rahway, NJ, USA, and owns stock in Merck & Co., Inc., Rahway, NJ, USA. U. Malhotra is an employee of Merck Sharp & Dohme LLC, a subsidiary of Merck & Co., Inc., Rahway, NJ, USA. A. B. Siegel is an employee of Merck Sharp & Dohme LLC, a subsidiary of Merck & Co., Inc., Rahway, NJ, USA. C.-C. Liu is an employee of Merck Sharp & Dohme LLC, a subsidiary of Merck & Co., Inc., Rahway, NJ, USA, and owns stock in Merck & Co., Inc., Rahway, NJ, USA. M. Kudo reports researching funding (to his institution) from AbbVie GK, Chugai Pharmaceutical Co., Ltd, Eisai Co., Ltd, GE Healthcare Japan Corporation, Otsuka Pharmaceutical Co., Ltd, and Taiho Pharmaceutical Co., Ltd; consulting fees from AstraZeneca K.K., Chugai Pharmaceutical Co., Ltd, Eisai Co., Ltd, and F. Hoffman-La Roche, Ltd; and honoraria from AstraZeneca K.K., Chugai Pharmaceutical Co., Ltd, Eisai Co., Ltd, Eli Lilly Japan K.K., and Takeda Pharmaceutical Co., Ltd. A-L. Cheng reports role as independent director for TTY Biopharm; consulting fees for AstraZeneca, Bayer, BeiGene, Bristol Myers Squibb, Eisai, Genentech/Roche, Innovation, Ipsen, Merck Sharp & Dohme, Omega Therapeutics, Ono Pharmaceutical, and Sanofi; advisory arrangements for Abbisko Therapeutics; speakers’ bureau for Amgen Taiwan, Ipsen Innovation, and Roche; grants/contracts from AstraZeneca and Roche; AstraZeneca for travel and Pilatus Biosciences Inc., for grants; received personal fees for consulting from AstraZeneca, Bayer Healthcare, BeiGene, Bristol Myers Squibb, CSR Pharma Group, Eisai, Exelixis, F. Hoffmann–La Roche, Ipsen Innovation, IQVIA, Merck Serono, Merck Sharp & Dohme, Novartis, Nucleix, Ono Pharmaceuticals, and Roche/Genentech; personal fees for speaker bureaus from Bayer Yakuhin, Eisai, Novartis, and Ono Pharmaceuticals; and personal fees for travel support from Bayer Yahukin, IQVIA, and Roche/Genentech.
Funding
This work was supported by Merck Sharp & Dohme LLC, a subsidiary of Merck & Co., Inc., Rahway, NJ, USA.
Author contributions
Conceptualization: S. L. Chan, R. S. Finn, B.-Y. Ryoo, H-Y Lim, Y. Chao, U. Malhotra, A. B. Siegel, and A.-L. Cheng
Formal Analysis: S. L. Chan, H.-Y. Lim, B. A. Haber, U. Malhotra, A. B. Siegel, and C-C. Liu
Investigation: S. L. Chan, R. S. Finn, J. Edeline, S. Ogasawara, B-Y. Ryoo, P. Merle, H-Y Lim, B. A. Haber, U. Malhotra, M. Kudo, T. Yau, and A-L. Cheng
Writing – original draft: S. L. Chan, B-Y. Ryoo, H-Y Lim, B. A. Haber, U. Malhotra, and A. B. Siegel
Writing – review & editing: S. L. Chan, R. S. Finn, J. Edeline, S. Ogasawara, J. J. Knox, B. Daniele, B-Y. Ryoo, P. Merle, M. Bouattour, H-Y Lim, Y. Chao, B. A. Haber, U. Malhotra, A. B. Siegel, C-C. Liu, M. Kudo, T. Yau, and A-L. Cheng
Acknowledgements
We thank Olga Kuznetsova, PhD, Ken Hatogai, MD, PhD, Scot Ebbinghaus, MD, of Merck Sharp & Dohme LLC, a subsidiary of Merck & Co., Inc., Rahway, NJ, USA, and Andrew X. Zhu (Jiahui Health, Shanghai, China) for their contributions to this manuscript. Medical writing and editorial assistance was provided by Tim Ibbotson, PhD, of ApotheCom (Yardley, PA, USA) and was funded by Merck Sharp & Dohme LLC, a subsidiary of Merck & Co., Inc., Rahway, NJ, USA.
Data availability statement
Merck Sharp & Dohme LLC, a subsidiary of Merck & Co., Inc., Rahway, NJ, USA (MSD), is committed to providing qualified scientific researchers access to anonymized data and clinical study reports from the company’s clinical trials for the purpose of conducting legitimate scientific research. MSD is also obligated to protect the rights and privacy of trial participants and, as such, has a procedure in place for evaluating and fulfilling requests for sharing company clinical trial data with qualified external scientific researchers. The MSD data sharing website (available at: https://externaldatasharing-msd.com) outlines the process and requirements for submitting a data request. Applications will be promptly assessed for completeness and policy compliance. Feasible requests will be reviewed by a committee of MSD subject matter experts to assess the scientific validity of the request and the qualifications of the requestors. In line with data privacy legislation, submitters of approved requests must enter into a standard data-sharing agreement with MSD before data access is granted. Data will be made available for request after product approval in the US and EU or after product development is discontinued. There are circumstances that may prevent MSD from sharing requested data, including country or region-specific regulations. If the request is declined, it will be communicated to the investigator. Access to genetic or exploratory biomarker data requires a detailed, hypothesis-driven statistical analysis plan that is collaboratively developed by the requestor and MSD subject matter experts; after approval of the statistical analysis plan and execution of a data-sharing agreement, MSD will either perform the proposed analyses and share the results with the requestor or will construct biomarker covariates and add them to a file with clinical data that is uploaded to an analysis portal so that the requestor can perform the proposed analyses.
articles


![]()