


Metabolic dysfunction-associated steatotic liver disease (MASLD), the most common chronic liver disease, has been increasing in prevalence due to the increased incidence of diabetes and obesity [1]. It is considered the main cause of liver-related adverse events including cirrhosis, hepatocellular carcinoma, and liver-related mortality, leading to a substantial burden of global health issues and economic consequences [2]. Although MASLD is considered the successor to nonalcoholic fatty liver disease (NAFLD), the criteria are distinct from those of NAFLD [3]. To date, our understanding of effective treatments for MASLD remains limited. Consequently, prevention and management strategies rooted in public health approaches should be prioritized.
Clinical and basic research indicates that increased sodium intake is associated with an increased risk of cardiovascular disease, kidney disease, hypertension, obesity, and inflammatory dysregulation [4–6], all of which are associated with liver steatosis [7]. Although there has been a systematic review [8] of the association between a high-salt diet and NAFLD, the association between sodium intake and incident MASLD remains underexplored. Moreover, measures of sodium intake varied across studies [9–12], with few studies evaluating associated hepatic complications or potential mediating effects.
Sodium intake is typically estimated via 24-hour dietary recall (24h-DR) which captures meal times, food types, and quantities consumed throughout the day and are subsequently calculated via food composition tables. However, accurately quantifying sodium intake remains challenging due to inevitable measurement bias in 24h-DRs and incomplete reporting of packaged foods and cooking processes [13,14]. Moreover, 24-h urinary sodium excretion, the ‘gold standard’ for sodium intake, is impractical in large-scale cohorts, and spot urinary-based formulae such as INTERSALT to estimate 24-h urinary sodium excretion may misclassify due to ethnic or intra-daily variability [15,16]. The frequency of adding salt to food is a simple indicator of habitual salt intake [6] and several studies have demonstrated a positive, graded relationship between the frequency of adding salt to food and estimated 24-h urinary sodium excretion and dietary sodium intake [17–19]. However, as a subjective qualitative measurement, the frequency of adding salt may not capture the detailed relationship with the outcome as precisely as quantitative indicators. Therefore, combining the frequency of adding salt to food, dietary sodium intake from 24h-DRs, and estimated 24-hour urinary sodium excretion could provide a more comprehensive assessment of sodium intake.
In this study, we evaluated the associations between different measures of sodium intake and incident MASLD from prospective UK Biobank (UKB). The measures of sodium intake included the self-reported frequency of adding salt to food, estimated 24-h urinary sodium excretion, and energy-adjusted dietary sodium intake from 24h-DRs. Furthermore, the associations between sodium intake and liver-related adverse events were evaluated to determine the underlying biological mechanisms via mediation analysis.
2Materials and Methods2.1Study design and settingThe UKB is a large, population-based prospective cohort study that recruited over 500,000 participants between 2006 and 2010. Participants, aged 37–73 years, were selected from 22 assessment centers across England, Wales, and Scotland. The study design and methodology have been extensively documented elsewhere [20]. Briefly, data were collected via touchscreen questionnaires, physical examinations, and biological specimens at baseline and follow-up assessments. This vast dataset provides a valuable resource for examining a wide range of health-related factors and outcomes.
Of the 502,134 available participants, 1125 participants with incomplete data on the frequency of adding salt to food and 21,447 with incomplete data required for calculating the 24-h urinary sodium excretion based on INTERSALT formulae [21] were excluded. Also, 188,554 participants with major dietary changes in the last 5 years and 4935 participants who had outcome events or alcohol/drug use disorders at or before baseline were excluded resulting in 286,073 participants for the main analysis.
A sub-cohort analysis of 119,073 participants with at least two 24h-DRs was performed to evaluate energy-adjusted sodium intake from 24h-DRs. Participants with extreme (total energy intake of < 600 or >3500 kcal/day for females, and < 800 or >4200 kcal/d for males) or missing energy intake and participants with aforementioned events were excluded. The baseline time in this cohort was defined as 2012 when the last 24h-DR was performed. The flowchart of participant selection is shown in Fig. 1 and the timeline of data acquisition in Figure S1.
2.2Exposure assessment2.2.1Frequency of adding salt to food
Participants were asked ‘Do you add salt to your food? (Do not include salt used in cooking)’ through a baseline touch-screen questionnaire (Data-Field 1478) and could answer ‘never/rarely’, ‘sometimes’, ‘usually’, ‘always’, and ‘prefer not to answer’.
2.2.2Estimated 24-h urinary sodium excretionThe estimated 24-h urinary sodium was calculated from spot urinary sodium, creatinine and potassium based on the sex-specific INTERSALT formulae (Equation S1). Urinary sodium, creatinine and potassium were collected at baseline from random spot urine samples via the Ion Selective Electrode method using a Beckman Coulter AU5400, UK Ltd.
2.2.3Dietary sodium intake from 24h-DRsDietary sodium intake per participant was calculated as the average of up to five 24h-DR assessment questionnaires (waves 2009.04–2010.09; 2011.02–2011.04; 2011.06–2011.09; 2011.10–2011.12; 2012.04–2012.06) and further adjusted for energy intake using the residual method (Methods S1).
2.3Outcome assessmentStudy outcomes were defined through National Health Service records including hospital inpatient and death register records. Hospital admission data were available until October 31, 2022, and mortality data were available until December 19, 2022. Time-to-event was calculated from the baseline to the earliest occurrence of the first outcome diagnosis, death, loss to follow-up, or censorship (October 31, 2022).
MASLD, the primary outcome, was defined as hospitalization or death attributable to MASLD or metabolic dysfunction-associated steatohepatitis (MASH), based on the Expert Panel Consensus Statement and identified using ICD-10 codes K76.0 and K75.8 from hospital inpatient and death registry records [22]. Since MASLD is one of the most important causes of liver-related adverse events, cirrhosis, liver cancer, and liver-related mortality were selected as secondary outcomes. Details of the outcome ICD-10 codes are provided in Methods S2.
Furthermore, 44,609 participants with MRI-derived liver proton density fat fraction (PDFF) measured between January 2016 and February 2020 were included as an independent cohort to investigate the relationship between sodium intake and hepatic fat. PDFF had a skewed distribution and was transformed by using nature logarithm (ln). Outcomes were PDFF-defined liver steatosis (PDFF ≥5 %) and ln(PDFF) as a continuous variable [23]. Details of the liver MRI scanning were provided in Methods S3.
2.4CovariatesThe baseline covariates included age (continuous); sex (male or female); ethnicity (White, Mixed, Asian or Asian British, Black or Black British, other); Townsend deprivation index (TDI) (in quartiles); educational level (college/university/equivalent or none); BMI (<18.5, ≥18.5–<25, ≥25–<30, ≥30); smoking status (never, previous, current); alcohol intake frequency (never or special occasions, 1–3 times/month, 1–4 times/week, daily/almost daily); regular physical activity (no or yes); hypertension (no or yes); and diabetes (no-insulin dependent, insulin dependent or no). Moreover, dietary factors were considered covariates, including red meat intake (beef, pork, lamb/mutton and processed meat intake), fish intake (oily/non-oily fish intake), and vegetable and fruit intake (fresh/dried fruit, cooked and salad/raw vegetable intake). These dietary covariates were categorized into tertiles. Energy intake was calculated as an average from up to five 24h-DRs. Details on the covariates are provided in Methods S4.
2.5Statistical analysisANOVA or Kruskal–Wallis tests for continuous variables [mean± standard deviation or median (P25, P75)] or chi-square tests for categorical variables [n (%)] were applied to compare baseline characteristics categorized by the frequency of adding salt to food.
Cumulative incidence curves were plotted by the frequency of adding salt to food via Kaplan‒Meier method. Cox proportional hazards models were utilized to assess the hazard ratios (HRs) and 95 % confidence intervals (CIs) of MASLD and secondary outcomes ascribed to sodium intake. Schoenfeld residuals were applied to evaluate the proportional hazards assumption and applied time interaction terms for covariates that violated the assumption (p < 0.05). Several confounders were adjusted: Model 1 adjusted for age and sex; Model 2 adjusted for other sociodemographic (ethnicity, TDI, educational level and BMI) and lifestyle covariates (smoking status, alcohol intake frequency, regular physical activity, hypertension, and diabetes); and Model 3 adjusted for dietary covariates (red meat intake, fish intake and vegetable and fruit intake). When using estimated 24-hour urinary sodium, Cox models did not adjust for age and BMI given their presence in the INTERSALT formula. Energy intake was additionally adjusted for in the sensitivity analysis. The dose-response associations of the estimated 24-h urinary sodium and dietary sodium intake with the risk of MASLD and liver-related adverse events were assessed via restricted cubic spline (RCS) with four knots (four knots at the 5th, 35th, 65th, and 95th percentiles) in Model 3. If a nonlinearity relationship was detected, recursive algorithms were used to calculate inflection points [24]. Multivariable logistic regression were utilized for PDFF-defined liver steatosis and multivariable linear regression for ln (PDFF). Results were reported as odds ratios (ORs) and β coefficients with 95 % CIs, respectively. Furthermore, joint association was evaluated in the frequency of adding salt to food and estimated 24-h urinary sodium and dietary sodium intake.
Subgroup analyses were performed according to age, sex, ethnicity, BMI, educational level, TDI, smoking status, alcohol intake frequency, regular physical activity, hypertension, diabetes, and dietary covariates. The interactions between the frequency of adding salt to food and these factors were evaluated by adding multiplicative interaction terms to the Cox models.
Several sensitivity analyses were performed: (1) participants with major dietary changes during the last 5 years were included; (2) participants with excessive alcohol intake at baseline (Methods S5) were excluded; (3) missing covariates were imputed via multiple imputations; (4) landmark analysis was extended to 1 year and 5 years; (5) participants with chronic kidney disease were excluded due to the association with creatinine and estimated 24-h urinary sodium; (6) Fine and Gray competing-risks regression models were used with death treated as a competing risk; (7) Cox models were adjusted for leucocyte telomere length (dichotomized by median) and energy intake, respectively. Additionally, we conducted sensitivity analyses in the sub-cohort of energy-adjusted dietary sodium intake.
Statistical analyses were conducted using R (version 4.2.2). All P values were two-tailed at a type I error rate of 0.05 and a P-value <0.05 was considered significant.
2.6Mediation analysisMediation analysis was used to evaluate the potential mediating effect between the frequency of adding salt to food and incident MASLD in the UKB: (1) two frequencies of adding salt to food: ‘never/ rarely’ and ‘always’ were selected given the dichotomous exposure for mediation analysis; (2) five inflammatory-related values, twenty-two lipids-related values, six insulin resistance (IR)-related values and three renal function-related values were selected as potential mediators based on the evidence of potential pathways between high salt intake and MASLD. Details of potential mediators are provided in Methods S6; (3) raw data of potential mediators were standardized based on z-score; (4) a multiple linear regression model was used to evaluate the association of adding salt to food with mediators; (5) a Cox regression model was applied to evaluate the association between the frequency of adding salt to food, mediators, and MASLD; (6) the aforementioned models were adjusted for covariables in Model 3; (7) potential mediators which simultaneously exhibited significance in the aforementioned models were considered for subsequent mediation analysis; and (8) the proportion mediated (PM) was estimated via the “mediation” package, with the non-parametric bootstrap method (1000 draws) used to calculate the 95 % CIs [25].
2.7Exploratory analysesThe exploratory analysis investigated the association between sodium intake and incident MASLD in the cross-sectional NHANES. Additionally, the association of changes in self-reported adding salt frequency at baseline (2006–2010) and post-baseline (2012–2013) were examined with incident MASLD. To probe causality, a two‑sample Mendelian randomization (MR) used 462,630 UKB participants for the exposure and MASLD summary statistics from Ghodsian et al. [26] (n = 8434), Fairfield et al. [27] (n = 4761), and FinnGen [28] (n = 2275). Detailed protocols and model specifications are provided in Methods S7–S9.
2.8Ethical statementWritten informed consent was obtained from each patient included in the study and the study protocol conforms to the ethical guidelines of the 1975 Declaration of Helsinki as reflected in a priori approval by the NHS National Research Ethics Service (approval letter dated June 17th, 2011, Ref 11/ NW/0382).
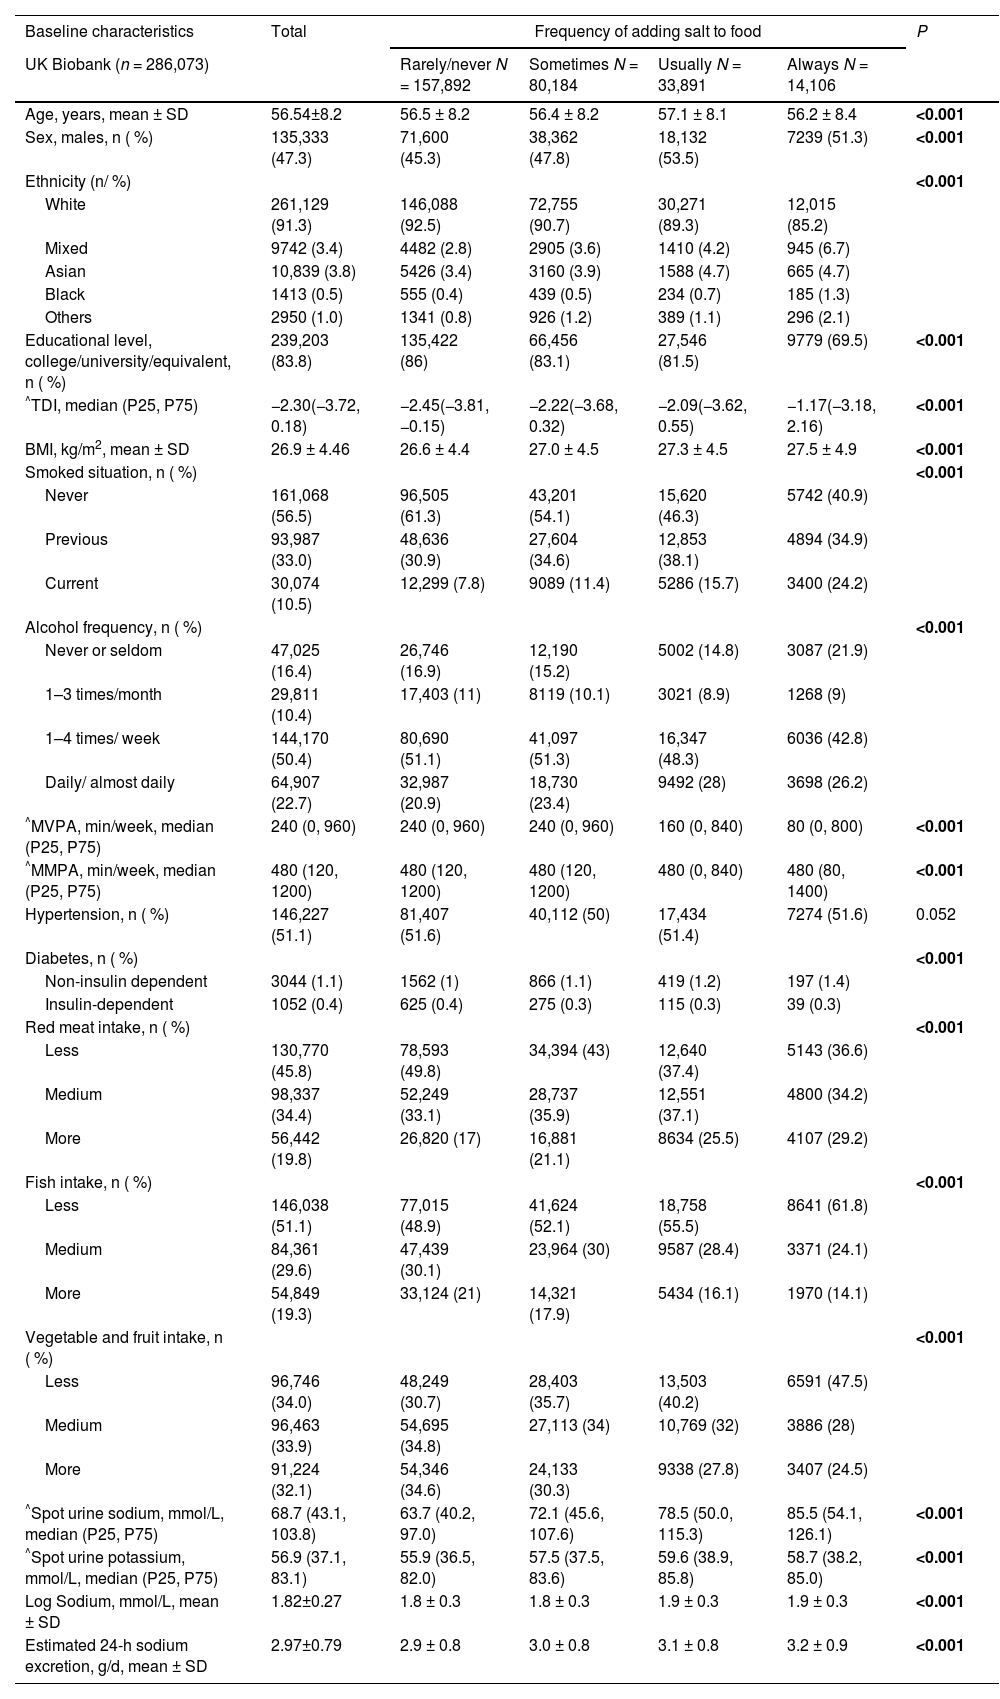
3Results3.1Baseline characteristicsA total of 157,892 participants reported ‘rarely/never’ adding salt to food, 80,184 reported ‘sometimes’, 33,891 reported ‘usually’, and 14,106 reported ‘always’. During a median follow-up of 13.3 years, 3147 (1.10 %) participants developed MASLD, 1354 (0.47 %) developed cirrhosis or liver cancer, and 523 (0.18 %) died due to liver-related diseases. Individuals who reported a higher frequency of adding salt to food were more likely to be male, nonwhite, have lower educational levels, be more deprived, have a higher BMI, be current smokers, either never or daily drinkers, have lower physical activity, suffer noninsulin-dependent diabetes, and consume more red meat and fewer fish, vegetables and fruits (Table 1).
Baseline characteristics categorized by the frequency of adding salt to food.
| Baseline characteristics | Total | Frequency of adding salt to food | P | |||
|---|---|---|---|---|---|---|
| UK Biobank (n = 286,073) | Rarely/never N = 157,892 | Sometimes N = 80,184 | Usually N = 33,891 | Always N = 14,106 | ||
| Age, years, mean ± SD | 56.54±8.2 | 56.5 ± 8.2 | 56.4 ± 8.2 | 57.1 ± 8.1 | 56.2 ± 8.4 | <0.001 |
| Sex, males, n ( %) | 135,333 (47.3) | 71,600 (45.3) | 38,362 (47.8) | 18,132 (53.5) | 7239 (51.3) | <0.001 |
| Ethnicity (n/ %) | <0.001 | |||||
| White | 261,129 (91.3) | 146,088 (92.5) | 72,755 (90.7) | 30,271 (89.3) | 12,015 (85.2) | |
| Mixed | 9742 (3.4) | 4482 (2.8) | 2905 (3.6) | 1410 (4.2) | 945 (6.7) | |
| Asian | 10,839 (3.8) | 5426 (3.4) | 3160 (3.9) | 1588 (4.7) | 665 (4.7) | |
| Black | 1413 (0.5) | 555 (0.4) | 439 (0.5) | 234 (0.7) | 185 (1.3) | |
| Others | 2950 (1.0) | 1341 (0.8) | 926 (1.2) | 389 (1.1) | 296 (2.1) | |
| Educational level, college/university/equivalent, n ( %) | 239,203 (83.8) | 135,422 (86) | 66,456 (83.1) | 27,546 (81.5) | 9779 (69.5) | <0.001 |
| ^TDI, median (P25, P75) | −2.30(−3.72, 0.18) | −2.45(−3.81, −0.15) | −2.22(−3.68, 0.32) | −2.09(−3.62, 0.55) | −1.17(−3.18, 2.16) | <0.001 |
| BMI, kg/m2, mean ± SD | 26.9 ± 4.46 | 26.6 ± 4.4 | 27.0 ± 4.5 | 27.3 ± 4.5 | 27.5 ± 4.9 | <0.001 |
| Smoked situation, n ( %) | <0.001 | |||||
| Never | 161,068 (56.5) | 96,505 (61.3) | 43,201 (54.1) | 15,620 (46.3) | 5742 (40.9) | |
| Previous | 93,987 (33.0) | 48,636 (30.9) | 27,604 (34.6) | 12,853 (38.1) | 4894 (34.9) | |
| Current | 30,074 (10.5) | 12,299 (7.8) | 9089 (11.4) | 5286 (15.7) | 3400 (24.2) | |
| Alcohol frequency, n ( %) | <0.001 | |||||
| Never or seldom | 47,025 (16.4) | 26,746 (16.9) | 12,190 (15.2) | 5002 (14.8) | 3087 (21.9) | |
| 1–3 times/month | 29,811 (10.4) | 17,403 (11) | 8119 (10.1) | 3021 (8.9) | 1268 (9) | |
| 1–4 times/ week | 144,170 (50.4) | 80,690 (51.1) | 41,097 (51.3) | 16,347 (48.3) | 6036 (42.8) | |
| Daily/ almost daily | 64,907 (22.7) | 32,987 (20.9) | 18,730 (23.4) | 9492 (28) | 3698 (26.2) | |
| ^MVPA, min/week, median (P25, P75) | 240 (0, 960) | 240 (0, 960) | 240 (0, 960) | 160 (0, 840) | 80 (0, 800) | <0.001 |
| ^MMPA, min/week, median (P25, P75) | 480 (120, 1200) | 480 (120, 1200) | 480 (120, 1200) | 480 (0, 840) | 480 (80, 1400) | <0.001 |
| Hypertension, n ( %) | 146,227 (51.1) | 81,407 (51.6) | 40,112 (50) | 17,434 (51.4) | 7274 (51.6) | 0.052 |
| Diabetes, n ( %) | <0.001 | |||||
| Non-insulin dependent | 3044 (1.1) | 1562 (1) | 866 (1.1) | 419 (1.2) | 197 (1.4) | |
| Insulin-dependent | 1052 (0.4) | 625 (0.4) | 275 (0.3) | 115 (0.3) | 39 (0.3) | |
| Red meat intake, n ( %) | <0.001 | |||||
| Less | 130,770 (45.8) | 78,593 (49.8) | 34,394 (43) | 12,640 (37.4) | 5143 (36.6) | |
| Medium | 98,337 (34.4) | 52,249 (33.1) | 28,737 (35.9) | 12,551 (37.1) | 4800 (34.2) | |
| More | 56,442 (19.8) | 26,820 (17) | 16,881 (21.1) | 8634 (25.5) | 4107 (29.2) | |
| Fish intake, n ( %) | <0.001 | |||||
| Less | 146,038 (51.1) | 77,015 (48.9) | 41,624 (52.1) | 18,758 (55.5) | 8641 (61.8) | |
| Medium | 84,361 (29.6) | 47,439 (30.1) | 23,964 (30) | 9587 (28.4) | 3371 (24.1) | |
| More | 54,849 (19.3) | 33,124 (21) | 14,321 (17.9) | 5434 (16.1) | 1970 (14.1) | |
| Vegetable and fruit intake, n ( %) | <0.001 | |||||
| Less | 96,746 (34.0) | 48,249 (30.7) | 28,403 (35.7) | 13,503 (40.2) | 6591 (47.5) | |
| Medium | 96,463 (33.9) | 54,695 (34.8) | 27,113 (34) | 10,769 (32) | 3886 (28) | |
| More | 91,224 (32.1) | 54,346 (34.6) | 24,133 (30.3) | 9338 (27.8) | 3407 (24.5) | |
| ^Spot urine sodium, mmol/L, median (P25, P75) | 68.7 (43.1, 103.8) | 63.7 (40.2, 97.0) | 72.1 (45.6, 107.6) | 78.5 (50.0, 115.3) | 85.5 (54.1, 126.1) | <0.001 |
| ^Spot urine potassium, mmol/L, median (P25, P75) | 56.9 (37.1, 83.1) | 55.9 (36.5, 82.0) | 57.5 (37.5, 83.6) | 59.6 (38.9, 85.8) | 58.7 (38.2, 85.0) | <0.001 |
| Log Sodium, mmol/L, mean ± SD | 1.82±0.27 | 1.8 ± 0.3 | 1.8 ± 0.3 | 1.9 ± 0.3 | 1.9 ± 0.3 | <0.001 |
| Estimated 24-h sodium excretion, g/d, mean ± SD | 2.97±0.79 | 2.9 ± 0.8 | 3.0 ± 0.8 | 3.1 ± 0.8 | 3.2 ± 0.9 | <0.001 |
PIR: Poverty income ratio; BMI: Body mass index; MVPA: Moderate-to-vigorous physical activity; Moderate-to-moderate physical activity: MMPA; TDI: Townsend deprivation index.
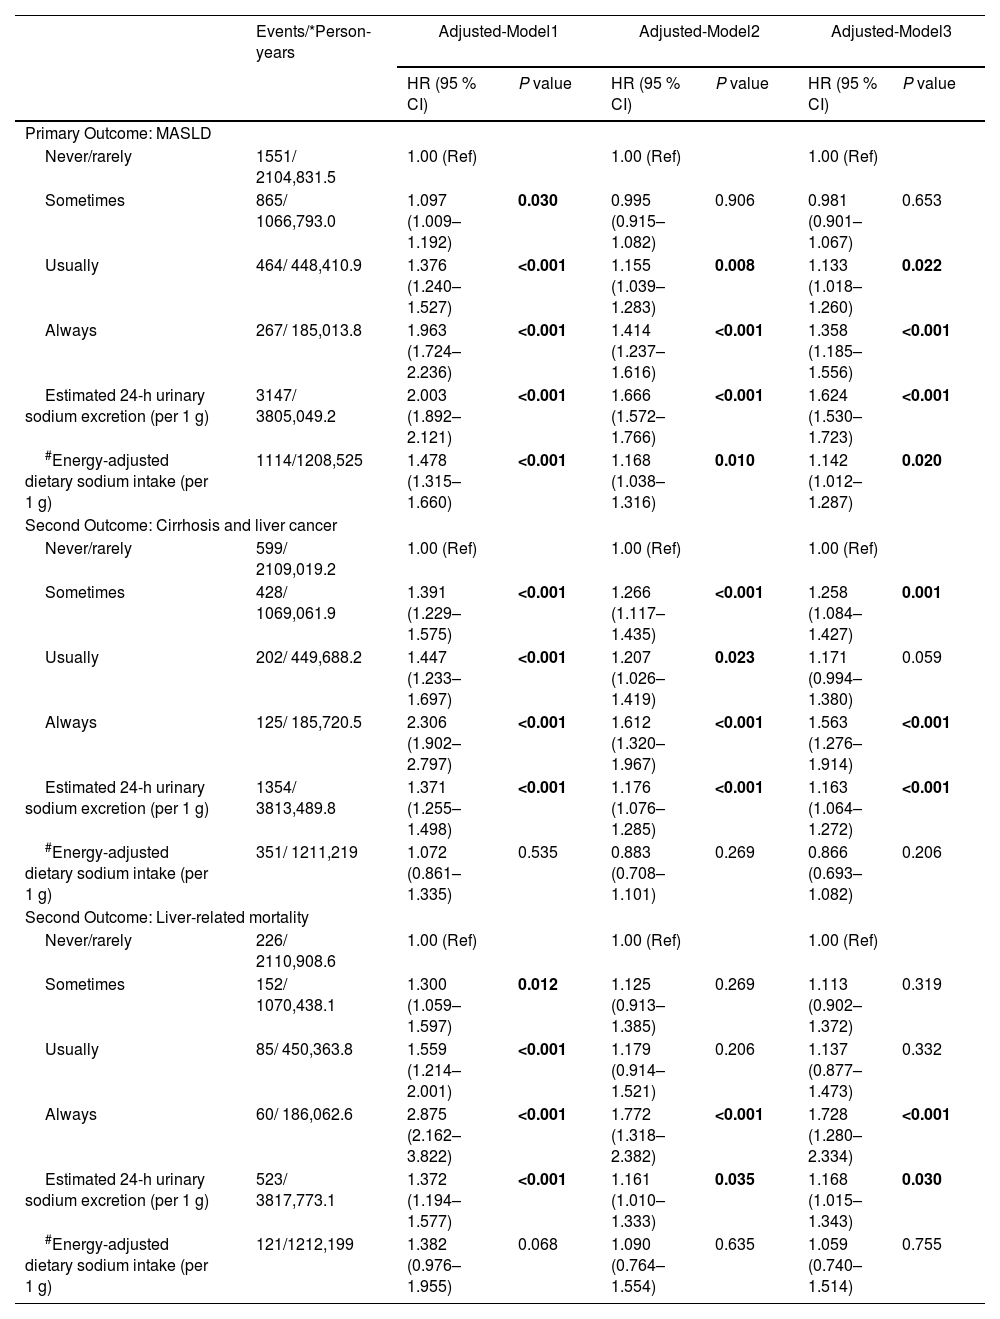
The Kaplan-Meier curves demonstrated a significantly increased cumulative incidence of incident MASLD and other liver-related adverse events across the four frequencies of adding salt to food: (log-rank P < 0.0001, Fig. 2). As shown in Table 2, after adjusting for all covariates, compared with those ‘never/rarely’ adding salt to food, participants who reported ‘always’ (HR=1.36, 95 % CI=1.19–1.56) and ‘usually’ (HR=1.13, 95 % CI=1.02–1.26) had an increased risk of MASLD. Similar hazardous associations were found between the frequency of adding salt to food and other liver-related adverse events (Table 2). Participants ‘always’ adding salt to food had an increased risk of cirrhosis and liver cancer (HR=1.56, 95 % CI=1.28–1.91) and liver-related mortality (‘always’: HR=1.73, 95 % CI=1.28–2.33) compared with those ‘never/rarely’ adding salt.

Cumulative incidence curves of MASLD and other liver-related adverse events in accordance with the frequency of adding salt to food. A. Cumulative incidence curves of MASLD categorized by the frequency of adding salt to food; B. Cumulative incidence curves of cirrhosis and liver cancer categorized by the frequency of adding salt to food; C. Cumulative incidence curves of liver-related mortality categorized by the frequency of adding salt to food.
Association of the different measures of sodium intake with incident MASLD, cirrhosis or liver cancer, and liver-related mortality.
| Events/*Person-years | Adjusted-Model1 | Adjusted-Model2 | Adjusted-Model3 | ||||
|---|---|---|---|---|---|---|---|
| HR (95 % CI) | P value | HR (95 % CI) | P value | HR (95 % CI) | P value | ||
| Primary Outcome: MASLD | |||||||
| Never/rarely | 1551/ 2104,831.5 | 1.00 (Ref) | 1.00 (Ref) | 1.00 (Ref) | |||
| Sometimes | 865/ 1066,793.0 | 1.097 (1.009–1.192) | 0.030 | 0.995 (0.915–1.082) | 0.906 | 0.981 (0.901–1.067) | 0.653 |
| Usually | 464/ 448,410.9 | 1.376 (1.240–1.527) | <0.001 | 1.155 (1.039–1.283) | 0.008 | 1.133 (1.018–1.260) | 0.022 |
| Always | 267/ 185,013.8 | 1.963 (1.724–2.236) | <0.001 | 1.414 (1.237–1.616) | <0.001 | 1.358 (1.185–1.556) | <0.001 |
| Estimated 24-h urinary sodium excretion (per 1 g) | 3147/ 3805,049.2 | 2.003 (1.892–2.121) | <0.001 | 1.666 (1.572–1.766) | <0.001 | 1.624 (1.530–1.723) | <0.001 |
| #Energy-adjusted dietary sodium intake (per 1 g) | 1114/1208,525 | 1.478 (1.315–1.660) | <0.001 | 1.168 (1.038–1.316) | 0.010 | 1.142 (1.012–1.287) | 0.020 |
| Second Outcome: Cirrhosis and liver cancer | |||||||
| Never/rarely | 599/ 2109,019.2 | 1.00 (Ref) | 1.00 (Ref) | 1.00 (Ref) | |||
| Sometimes | 428/ 1069,061.9 | 1.391 (1.229–1.575) | <0.001 | 1.266 (1.117–1.435) | <0.001 | 1.258 (1.084–1.427) | 0.001 |
| Usually | 202/ 449,688.2 | 1.447 (1.233–1.697) | <0.001 | 1.207 (1.026–1.419) | 0.023 | 1.171 (0.994–1.380) | 0.059 |
| Always | 125/ 185,720.5 | 2.306 (1.902–2.797) | <0.001 | 1.612 (1.320–1.967) | <0.001 | 1.563 (1.276–1.914) | <0.001 |
| Estimated 24-h urinary sodium excretion (per 1 g) | 1354/ 3813,489.8 | 1.371 (1.255–1.498) | <0.001 | 1.176 (1.076–1.285) | <0.001 | 1.163 (1.064–1.272) | <0.001 |
| #Energy-adjusted dietary sodium intake (per 1 g) | 351/ 1211,219 | 1.072 (0.861–1.335) | 0.535 | 0.883 (0.708–1.101) | 0.269 | 0.866 (0.693–1.082) | 0.206 |
| Second Outcome: Liver-related mortality | |||||||
| Never/rarely | 226/ 2110,908.6 | 1.00 (Ref) | 1.00 (Ref) | 1.00 (Ref) | |||
| Sometimes | 152/ 1070,438.1 | 1.300 (1.059–1.597) | 0.012 | 1.125 (0.913–1.385) | 0.269 | 1.113 (0.902–1.372) | 0.319 |
| Usually | 85/ 450,363.8 | 1.559 (1.214–2.001) | <0.001 | 1.179 (0.914–1.521) | 0.206 | 1.137 (0.877–1.473) | 0.332 |
| Always | 60/ 186,062.6 | 2.875 (2.162–3.822) | <0.001 | 1.772 (1.318–2.382) | <0.001 | 1.728 (1.280–2.334) | <0.001 |
| Estimated 24-h urinary sodium excretion (per 1 g) | 523/ 3817,773.1 | 1.372 (1.194–1.577) | <0.001 | 1.161 (1.010–1.333) | 0.035 | 1.168 (1.015–1.343) | 0.030 |
| #Energy-adjusted dietary sodium intake (per 1 g) | 121/1212,199 | 1.382 (0.976–1.955) | 0.068 | 1.090 (0.764–1.554) | 0.635 | 1.059 (0.740–1.514) | 0.755 |
For the analyses of the frequency of adding salt to food: Model 1 adjusted for age and sex; Model 2 additionally adjusted for other sociodemographic (ethnicity, TDI, educational level and BMI) and lifestyle covariates (smoking status, alcohol intake frequency, regular physical activity, hypertension and diabetes); Model 3 further adjusted for dietary covariates (red meat intake, fish intake and vegetable and fruit intake).
For the analyses of the estimated 24-h sodium excretion, age and BMI were not adjusted, as they were included in the INTERSALT formulae.
For the analyses of the energy-adjusted dietary sodium intake, energy intake was not adjusted, as it was adjusted based on residual method.
Table 2 showed the significant positive associations of the estimated 24-h urinary sodium excretion with incident MASLD and other liver-related adverse events. Every 1 g increase in the estimated 24-h urine sodium was associated with a 62.4 % increase in the risk of MASLD (HR=1.62, 95 % CI=1.53–1.72), 16.3 % in cirrhosis and liver cancer (HR=1.16, 95 % CI=1.06–1.27), and 16.8 % in liver-related mortality (HR=1.17, 95 % CI=1.02–1.34), respectively.
A nonlinear dose-response relationship was observed between the estimated 24-h urinary sodium excretion and each outcome (P for non-linear <0.05), as shown in Figs. 3A-C. A threshold effect analysis with the inflection point at 1.93 g/d was performed to further investigate the J-shaped between urinary sodium and MASLD. There was no significant association (HR=0.54, 95 % CI=0.35–0.84) when urinary sodium was below 1.93 g/d, whereas there was a significant association (HR=1.68, 95 % CI=1.59–1.79) when urinary sodium exceeded 1.93 g/d. V-shaped associations were observed for cirrhosis and liver cancer, and liver-related mortality, indicating that both excessively high and excessively low sodium excretion levels conferred increased risks for these liver-related adverse events. The corresponding threshold points were 2.53 g/d and 2.78 g/d, respectively.

Dose‒response associations of estimated 24-h urinary sodium and energy-adjusted dietary sodium intake with the risk of MASLD and liver-related adverse events. A-C: Estimated 24-h urinary sodium excretion and MASLD, cirrhosis or liver cancer, and liver-related mortality. The threshold points were 1.93 g/d, 2.53 g/d, and 2.78 g/d, respectively. Adjusted for sex, ethnicity, Townsend deprivation index, educational level, smoking status, alcohol intake frequency, regular physical activity, hypertension, diabetes, red meat intake, fish intake, and vegetable and fruit intake.
Among 119,073 participants in the sub-cohort, 1114 developed MASLD, 351 developed cirrhosis or liver cancer, and 121 died from liver-related diseases. As shown in Table 2 and Figs. 3D-F, every 1 g increase in energy-adjusted dietary sodium intake was associated with a 14 % increase in the risk of MASLD (HR=1.14, 95 % CI =1.01–1.28) with a J-shaped nonlinear relationship (inflection point at 1.93 g/d). There was no significant association (HR=0.84, 95 % CI=0.42–1.69) when dietary sodium intake was below 1.49 g/d but a significant association was observed (HR=1.14, 95 % CI=1.02–1.31) when urinary sodium exceeded 1.49 g/d. However, there were no associations between energy-adjusted sodium intake and other liver-related adverse events.
3.5Association among different measures of sodium intakeAs shown in Figures S2A-D, there was a positive graded association between the self-reported frequency of adding salt to food with log-spot urinary sodium, estimated 24-h urinary sodium, and energy-adjusted dietary sodium intake (P trend <0.001). Moreover, a fully rotatable, interactive 3-D plot simultaneously including energy-adjusted dietary sodium intake (X-axis, continuous), the self-reported frequency of adding salt at the table (Y-axis, four ordered categories), and 24-h urinary sodium excretion (Z-axis, continuous) was generated to visually integrate intake, behavior, and excretion of sodium intake.
3.6Subgroup and sensitivity analysesThe adjusted OR (95 % CI) of PDFF-defined liver steatosis were 1.13 (1.05–1.23), 1.16 (1.10–1.21), 1.15 (1.01–1.31) across the groups of sometimes, usually, and always adding salt to foods. Similarly, compared to the rarely/never adding salt, the adjusted β (95 % CI) were 0.061 (0.047–0.076), 0.070 (0.049–0.091), 0.069 (0.032–0.105) for the comparison groups. The finding was consistent with the association between estimated 24-h urinary sodium excretion and liver steatosis [PDFF-defined steatosis: OR=2.24, 95 % CI=2.13–2.34; ln (PDFF): β=0.25, 95 % CI=0.24–0.27] (Table S1).
As shown in Figure S3, subgroup analyses for age, sex, educational level, smoking status, alcohol intake frequency, regular physical activity, hypertension, diabetes, and dietary intake revealed similar associations. The association between the frequency of adding salt to food and the risk of MASLD was more pronounced in individuals with a BMI<25 kg/m2 (P-trend=0.001) and ≥30 kg/m2 (P-trend<0.001) than in those with 25≤BMI<30 kg/m2 (P for interaction=0.604).
Multiple sensitivity analyses were conducted to validate the robustness of the primary findings as shown in Tables S2–9. The sensitivity analyses for energy-adjusted dietary sodium intake were presented in Table S10.
3.7Mediation analysisThe associations of potential mediators with the frequency of adding salt to food and the associations of MASLD with potential mediators were shown in Table S11, revealing that 3 of the 5 inflammation-related mediators, 16 of the 22 lipid-related mediators, all 6 IR-related mediators, and 2 of the 3 renal function-related significant mediators were associated with the frequency of adding salt to food with MASLD. Fig. 4 and Table S12 demonstrated the indirect effects and PM of these identified potential mediators. Significant mediating effects were observed for CRP, WBC, neutrophil count, apolipoprotein A, HbA1c, IGF-1, TyG, cystatin C, and urate (FDR for PM <0.05), indicating that ‘always’ adding salt to food might increase the risk of MASLD through the induction of inflammatory dysregulation, IR and renal function impairment. Among the inflammatory-related mediators, CRP, WBC, and neutrophil count explained 2.35 %, 0.63 %, and 0.74 % of the associations, respectively. Apolipoprotein A, the only identified lipid-related mediator, explained −1.38 % of the associations, with the IR-related mediators, HbA1c, IGF-1, and TyG explaining 1.49 %, 14.3 %, and 4.11 %, respectively. Cystatin C explained 1.28 % of the associations, whereas urate explained 3.48 %.
 and incident MASLD in the UKB. Association of the adding salt to food and MASLD were analyzed by using Mendelian randomization analysis of the two samples. Overall represents the comprehensive effect of meta-analysis on the MR analysis results of the above different data sets. The diamond point represents the OR value synthesized after meta-analysis, the horizontal line represents the size of 95 % CI, p value <0.05 was considered statistically significant. MASLD, metabolic dysfunction-associated steatotic liver disease; OR, odds ratio.")
Mediation analysis of the associations between the frequency of adding salt to food (never/rarely vs. always) and incident MASLD in the UKB. Association of the adding salt to food and MASLD were analyzed by using Mendelian randomization analysis of the two samples. Overall represents the comprehensive effect of meta-analysis on the MR analysis results of the above different data sets. The diamond point represents the OR value synthesized after meta-analysis, the horizontal line represents the size of 95 % CI, p value <0.05 was considered statistically significant. MASLD, metabolic dysfunction-associated steatotic liver disease; OR, odds ratio.
Similar findings between sodium intake and incident MASLD were observed in NHANES-based cross-sectional analyses (frequency of adding salt to food: OR=1.89, 95 % CI=1.15–3.11; energy-adjusted dietary sodium intake: OR=1.14, 95 % CI=1.01–1.29). Moreover, participants with ‘high adding salt frequency at baseline and post-baseline’ had an increased risk of MASLD (HR=1.61, 95 % CI=1.12–2.33) compared with those with ‘low adding salt frequency at baseline and post-baseline’. In MR analysis, IVW methods indicated that genetically determined adding salt to food was significantly related to the increased risk of MASLD. The meta-analysis revealed an overall significant association between adding salt to food and incident MASLD, with low heterogeneity (overall: OR=1.54, 95 % CI=1.23–1.93). The exploratory analysis results are detailed in Results S1–3.
4DiscussionIt has been reported that high sodium intake is significantly associated with NAFLD. Zhou et al. [12] categorized sodium intake from 24h-DRs by quartiles in 11,022 NHANES participants, reporting that individuals in the highest quartile had an increased risk of FLI-based NAFLD compared with those in the lowest quartile. Van et al. [11] utilized two complete consecutive 24-hour urine collections and reported that high 24-h urinary sodium was a metabolic indicator for NAFLD. However, the aforementioned studies face measurement challenges and lack relevant research on MASLD and liver-related adverse events.
Our study expanded on prior findings by revealing a longitudinal relationship between different measures of sodium intake and incident MASLD. The frequency of adding salt to food has gained increasing attention in public health, with several studies linking it to increased risk of premature mortality, gastric cancer, and psoriasis [18,19,29]. Traditional quantitative indicators of sodium exposure, including estimated 24-hour urinary sodium excretion and dietary sodium intake from 24h-DRs, were integrated into our analysis to provide a comprehensive evaluation of sodium exposure, revealing a consistent positive association between sodium intake and incident MASLD regardless of whether sodium was quantified by the frequency of adding salt, urinary sodium excretion, or energy-adjusted dietary sodium intake. Notably, a J-shaped nonlinear relationship was observed for both 24-h urinary sodium excretion and dietary sodium, with inflection points at 1.93 g/d and 1.49 g/d, respectively, suggesting that very low sodium exposure may also increase MASLD risk. Mediation analysis indicated that inflammatory dysregulation, IR and renal function impairment might partly mediate this association.
In this study, we also investigated liver-related adverse events including cirrhosis, liver cancer, and liver-related mortality, revealing strikingly different risk profiles for each measure. First, participants ‘always’ adding salt to food had an increased risk of adverse liver events, supporting the notion that discretionary salt use may accelerate the inflammation-fibrosis-carcinogenesis cascade through increased oxidative stress and immune activation [30]. Notably, a V-shaped association was observed between estimated 24-h urinary sodium and liver-related adverse events, indicating that both excess and deficit sodium might be harmful. In cirrhotic physiology, overly stringent salt restriction can precipitate arterial under-filling, RAAS hyper-activation, and hyponatremia, factors linked to renal dysfunction, frailty, developed ascites, and higher mortality. Clinical guidelines therefore advocate individualized, moderate targets rather than universal ‘lower-is-better’ advice [31,32]. However, there was no significant association between energy-adjusted dietary sodium intake and adverse liver events, which appeared to contradict conventional opinions. Several factors might explain the discrepancy. First, 24-h dietary recalls underestimated sodium intake, omitting discretionary salt from cooking and other sources, whereas estimated urinary excretion better reflects overall exposure. Second, 24-h recalls were recorded after baseline, introducing temporal misalignment. While re-anchoring baseline in sensitivity analyses yielded consistent results. Third, the rare incidence of liver-related adverse events reduced statistical power and widened CIs, particularly within the dietary sub-cohort.
Multiple mechanisms may contribute to sodium-induced MASLD [8]. High sodium intake exacerbates liver inflammation through oxidative stress, contributing to fat deposition and hepatic injury [33]. It may also alter appetite or hunger hormone secretion, promoting excess fat intake and subsequent hepatic lipid accumulation [34]. IR is considered the key pathogenesis of NAFLD. High sodium intake may contribute to the development of fatty liver by altering insulin signaling pathways, enhancing the hepatic insulin response, and impairing insulin sensitivity, ultimately leading to the progression of fatty liver disease [34]. Concurrently, sodium-induced dysfunction of renin-angiotensin-aldosterone system (RAAS) activation can increase sodium retention and compound NAFLD progression, especially in the presence of insulin resistance [35]. Owing to the lack of RAAS-related indicators in the UKB, indicators of renal function impairment were chosen as substitutes. Consistent with Chen et al. [36], our mediation analyses support partial mediation of the association by inflammatory dysregulation, IR, and renal dysfunction. Among them, IGF-1 explained the most, indicating that IR might be a key mechanism in sodium-induced MASLD. However, the mediating effects of most single-mediators were modest, suggesting that a large portion of the association remains unexplained and may involve unmeasured pathways (e.g., neurohormonal activation, diet quality and patterns, and gut–liver crosstalk). Accordingly, these findings should be interpreted cautiously, which require confirmation in future studies.
Interestingly, the only significant interaction in the subgroup analyses was observed in the BMI subgroup, with a higher frequency of adding salt to food associated with MASLD among individuals whose BMI was either <25 kg/m2 or ≥30 kg/m2. Shen et al. [10] reported a significant association between higher salt intake levels and NAFLD in the BMI<25 kg/m2 subgroup but they did not further stratify those with BMI ≥25 kg/m2. Luo et al. [37] also reported increased odds of sodium-induced MASLD in individuals with lower BMI (<25 kg/m2). However, another study [38] reported a positive correlation between sodium intake and NAFLD only in obese individuals, and the association was attenuated when adjusted for BMI. Thus, BMI might serve as a complex mediator in the association between sodium intake and MASLD, requiring further research.
In the exploratory analysis, cross-sectional, longitudinal, and genetic triangulation using NHANES and MR yielded consistent evidence, supporting a likely causal relationship. The associations detected in the cross-sectional study were confirmed in the cohort study and the causality was validated via the MR study following the epidemiological approach of progressing from observational to causal evidence. Moreover, we explored how the dynamic changes in sodium intake affected the incident MASLD.
Several points merit discussion. First, integrating behavioral, biologic and dietary indicators provides a more comprehensive assessment of sodium’s impact on liver health. This multidimensional approach enhances the potential for targeted public health strategies, as it captures both modifiable behaviors and objective intake measures. Second, MASLD was defined using ICD10 codes and its prevalence was relatively low in the UKB. Zhong et al. previously discussed potential reasons for this lower prevalence [39]. Third, sodium intake is closely associated with dietary habits, therefore, participants with major dietary changes were excluded from the sensitivity analysis involving 469,984 participants yielding consistent findings. Finally, given the link between total energy intake and MASLD, sodium intake from 24-h DRs was adjusted for energy intake using the residual method. Neither the frequency of adding salt to food nor 24-h urinary sodium was adjusted for total energy intake, as the former reflected behavior rather than intake volume, and the latter was traditionally not energy-adjusted in prior studies [9,11].
To our knowledge, this is the first study to explore the association between different measures of sodium intake and incident MASLD. The study strengths include large sample size, prospective cohort, comprehensive assessment of sodium intake, significant public health implications, Mendelian randomization for potential causality, mediation analyses for potential mechanisms, consistent results across most sensitivity and subgroup analyses, and dynamic analysis of exposure. However, several limitations should be noted. First, MASLD was identified via ICD10 codes from hospital inpatient and death register records. ICD10 codes were defined and applied in 1992, whereas MASLD was introduced in 2020 [3], which might lead to diagnostic alignment issues. However, the diagnostic data for each MASLD case were unavailable in a large sample population, and diagnosing MASLD through electronic health records in large population studies is widely accepted [40]. Second, we did not observe positive association between dietary sodium from 24-recalls and liver-related adverse events. The discrepancy might be due to measurement errors, temporal misalignment between recalls and baseline, and residual confounding by diet composition. Extensive sensitivity analyses still yielded negative results. Third, each sodium metric has inherent limitations but analyzing these three complementary indicators together mitigated the shortcomings of any single measure and strengthened confidence in our findings. Fourth, potential confounding unconsidered lifestyle or dietary factors were considered by conducting extensive sensitivity and stratified analyses which yielded consistent results. Finally, prospective analyses were performed on the UKB, in which 90 % of participants were White, and the GWAS data used were also limited to European individuals, so further studies are required to confirm these findings in more diverse cohorts.
5ConclusionsHigher sodium exposure in this large prospective cohort captured behaviorally, biologically, and dietarily was independently associated with an increased risk of MASLD. The habit of always adding salt to food, urinary sodium excretion above 1.93 g/day, and dietary sodium intake above 1.49 g/d typically increase the risk of MASLD, with partial mediation through inflammation, IR, and renal dysfunction. These findings highlight the need for mechanistic and interventional studies across more diverse populations to curb the growing MASLD burden.
FundingThis work was supported by the National Natural Science Foundation of China (82473729), the National Natural Science Foundation of China (82000540), Suzhou Clinical Center of Digestive Diseases (Szlcyxzx202101), Youth Program of Suzhou Health Committee (KJXW2019001), a Project Funded by Priority Academic Program Development of Jiangsu Higher Education Institutions (PAPD).
Authors' contributionsZhu SQ, Liu LH, Shen YP, and Sun HP contributed to manuscript drafting and data analysis. Zhu SQ, Shen YP, and Zhu JZ contributed to data acquisition. Zhu JZ and Sun HP contributed to manuscript revision. Li R, Zhu SQ, and Zhu J. contributed to the design of the work. Lin JX, Liu L and Liu XL contributed to review and editing. Sun HP and Zhu JZ contributed to funding acquisition. All authors contributed to final approval of the completed version.
Availability of data and materialsAll UK Biobank information is available online at the webpage www.ukbiobank.co.uk. Data are available on application. This research was conducted using the application number 373,472. Data from NHANES are available online at National Health and Nutrition Examination Survey | National Health and Nutrition Examination Survey | CDC. Data from GWASs are available online at IEU OpenGWAS project.
None.
This research was conducted by using the UK Biobank resource under Application Number 373472. The authors would like to thank the UK Biobank participants and investigators for making this study possible. Moreover, we want to acknowledge the participants and investigators of the FinnGen study and NHANES. We gratefully acknowledge Proofreading Service UK for their expert language editing of this manuscript.


