metricas
covid
Annals of Hepatology Correlation of Cardiovascular Risk Score with Alterations in Carotid Intima-Medi...
Journal Information
Vol. 30. Issue S1.
Abstracts Asociación Mexicana de Hepatología (AMH) 2024
(April 2025)
Vol. 30. Issue S1.
Abstracts Asociación Mexicana de Hepatología (AMH) 2024
(April 2025)
Full text access
Correlation of Cardiovascular Risk Score with Alterations in Carotid Intima-Media Thickness in Patients with MASLD
Visits
425
José L. Vargas-Basurto1, Ana D. Cano-Contreras2, Héctor R. Ordaz-Alvarez1, Genesis P. Martinez-Perez1, Kevin D. Gonzalez-Gomez1, Jose M. Remes-Troche1
1 Institute of Medical and Biological Research, Universidad Veracruzana, Veracruz, Mexico
2 Master's Degree in Translational Biomedicine, Institute of Medical and Biological Research, Universidad Veracruzana, Veracruz, Mexico
This item has received
Article information
Abstract
Full Text
Download PDF
Statistics
Figures (1)
Tables (1)
Table 1. Characteristics of patients with MASLD according to alterations in carotid intima-media layer thickness.
Tables
Special issue
This article is part of special issue:
Vol. 30. Issue S1

Abstracts Asociación Mexicana de Hepatología (AMH) 2024

More info
Introduction and Objectives

MASLD is associated with cardiovascular disease due to systemic inflammation and endothelial dysfunction. Carotid intima-media thickness (CIMT) and atherosclerosis are considered markers of generalized atherosclerosis and increased cardiovascular risk (CVR). The objective of this study is to describe the correlation between CVR and changes in CIMT in patients with MASLD.

Materials and Patients

This observational, cross-sectional, analytical study was conducted at the Instituto de Investigaciones Médico-Biológicas liver clinic from January 2023 to April 2024. Patients who met the eligibility criteria provided informed consent and underwent the following procedures: transitional liver elastography (TE), carotid Doppler ultrasound (USG), somatometric measurements, and biochemical tests. Cardiovascular risk scores (Framingham, ASCVD, SCORE2) and FIB-4 were calculated. Participants were categorized into two groups based on carotid intima-media thickness, altered CIMT (>1.1 mm) and normal CIMT (<1.1 mm). A TE value >8 Kpa indicated a risk of advanced fibrosis. Numerical variables were reported as measures of central tendency and dispersion, while categorical variables were presented as frequencies and percentages. The Kolmogorov-Smirnov test assessed data distribution and the Levene test evaluated homoscedasticity. For group comparisons, Student's t-test or Wilcoxon test was used for numerical variables, and chi-square or Fisher's exact test for categorical variables. ROC curves were generated to analyze cardiovascular risk and atherosclerosis. Spearman's test was employed to evaluate correlations. Statistical analysis was conducted using SPSS version 26.
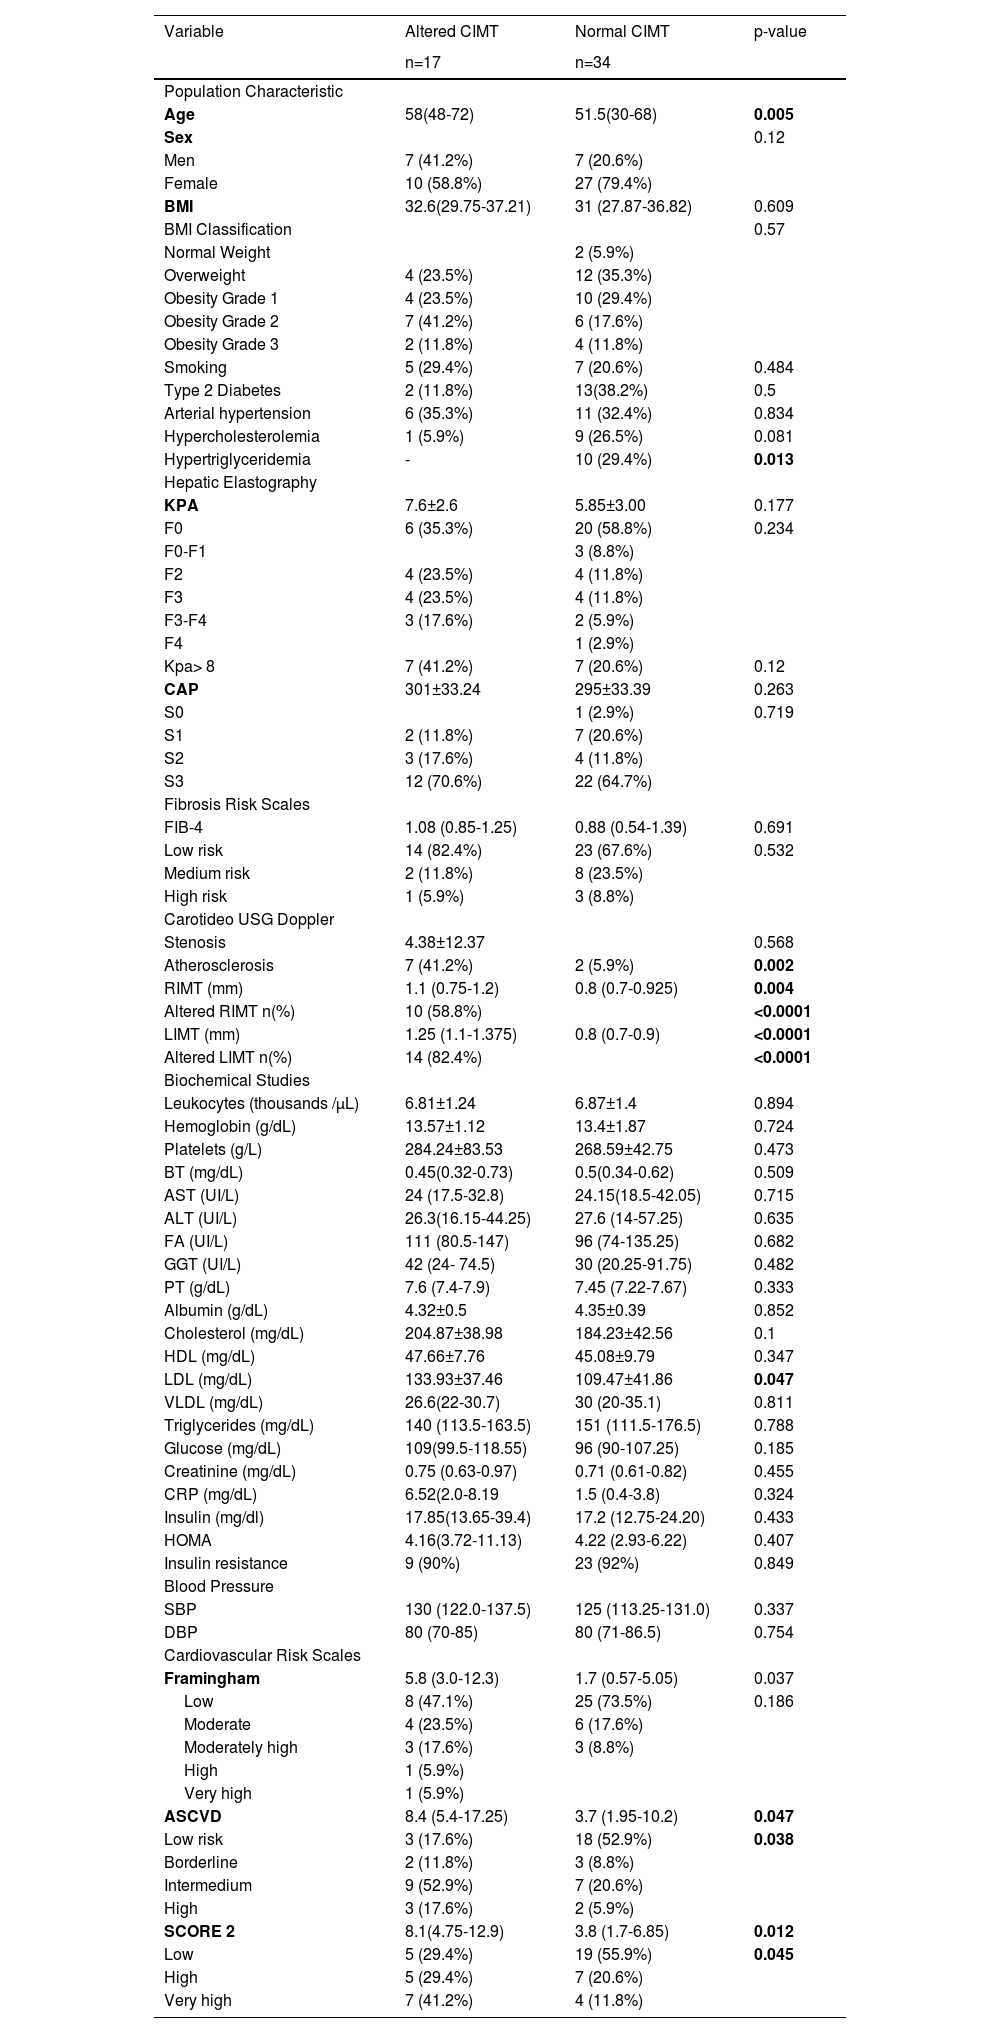
Results

This study included 51 patients: 17 (33.33%) with altered CIMT (age 58 [48-72], 58.8% women) and 34 (66.66%) without alterations (age 51.5 [30-68], 79.4% women). Pathological histories, elastography results, biochemical data, and CVR scores are summarized in Table 1. Patients with altered CIMT exhibited a higher age (58 [48-72] vs. 51.5 [30-68], p=0.005), higher LDL concentrations (133.93±37.46 vs. 109.47±41.86 mg/dL, p=0.047), and elevated CVR scores: Framingham (5.8 [3.0-12.3] vs. 1.7 [0.57-5.05], p=0.037), ASCVD (8.4 [5.4-17.25] vs. 3.7 [1.95-10.2], p=0.047), and SCORE2 (8.1 [4.75-12.9] vs. 3.8 [1.7-6.85], p=0.012). Advanced fibrosis (>8 kPa) was more prevalent among patients with altered CIMT (55.6% vs. 21.4%, p=0.037) and was associated with higher CVR scores: ASCVD (15.7 [7.75-24.75] vs. 4.45 [1.97-9.67], p=0.001) and SCORE2 (11.3 [4.85-17.1] vs. 3.95 [2.3-8.12], p=0.004). Sub-analysis showed significant correlations of >8 kPa and high FIB-4 with SCORE2 (r=0.574, p=0.040) and (r=0.564, p=0.045), respectively. Patients with >8 kPa were more likely to have atherosclerosis (OR 4.58, 95% CI: 1.01-20.6, p=0.037) and altered CIMT (OR 4.2, 95% CI: 1.1-16.2, p=0.026). The area under the curve for detecting atherosclerosis was 0.768 (95% CI: 0.570-0.965, p=0.013) for ASCVD, 0.753 (95% CI: 0.552-0.953, p=0.019) for SCORE2, and 0.662 (95% CI: 0.457-0.867, p=0.133) for Framingham.

Conclusions

In our cohort, MASLD patients with >8 kPa exhibited a significant correlation with SCORE2 and an increased risk of atherosclerosis. These results highlight the importance of assessing cardiovascular risk and carotid alterations in patients with elevated liver stiffness (>8 kPa) and high cardiovascular risk scores.

Full Text

Ethical statement: All patients have informed consent and personal data protection.

Declaration of interests: None.

Funding: This research did not receive any specific grant from funding agencies in the public, commercial, or not-for-pro-fit sectors.

Table 1.

Characteristics of patients with MASLD according to alterations in carotid intima-media layer thickness.

Variable  Altered CIMT  Normal CIMT  p-value 
  n=17  n=34   
Population Characteristic       
Age  58(48-72)  51.5(30-68)  0.005 
Sex      0.12 
Men  7 (41.2%)  7 (20.6%)   
Female  10 (58.8%)  27 (79.4%)   
BMI  32.6(29.75-37.21)  31 (27.87-36.82)  0.609 
BMI Classification      0.57 
Normal Weight    2 (5.9%)   
Overweight  4 (23.5%)  12 (35.3%)   
Obesity Grade 1  4 (23.5%)  10 (29.4%)   
Obesity Grade 2  7 (41.2%)  6 (17.6%)   
Obesity Grade 3  2 (11.8%)  4 (11.8%)   
Smoking  5 (29.4%)  7 (20.6%)  0.484 
Type 2 Diabetes  2 (11.8%)  13(38.2%)  0.5 
Arterial hypertension  6 (35.3%)  11 (32.4%)  0.834 
Hypercholesterolemia  1 (5.9%)  9 (26.5%)  0.081 
Hypertriglyceridemia  10 (29.4%)  0.013 
Hepatic Elastography       
KPA  7.6±2.6  5.85±3.00  0.177 
F0  6 (35.3%)  20 (58.8%)  0.234 
F0-F1    3 (8.8%)   
F2  4 (23.5%)  4 (11.8%)   
F3  4 (23.5%)  4 (11.8%)   
F3-F4  3 (17.6%)  2 (5.9%)   
F4    1 (2.9%)   
Kpa> 8  7 (41.2%)  7 (20.6%)  0.12 
CAP  301±33.24  295±33.39  0.263 
S0    1 (2.9%)  0.719 
S1  2 (11.8%)  7 (20.6%)   
S2  3 (17.6%)  4 (11.8%)   
S3  12 (70.6%)  22 (64.7%)   
Fibrosis Risk Scales       
FIB-4  1.08 (0.85-1.25)  0.88 (0.54-1.39)  0.691 
Low risk  14 (82.4%)  23 (67.6%)  0.532 
Medium risk  2 (11.8%)  8 (23.5%)   
High risk  1 (5.9%)  3 (8.8%)   
Carotideo USG Doppler       
Stenosis  4.38±12.37    0.568 
Atherosclerosis  7 (41.2%)  2 (5.9%)  0.002 
RIMT (mm)  1.1 (0.75-1.2)  0.8 (0.7-0.925)  0.004 
Altered RIMT n(%)  10 (58.8%)    <0.0001 
LIMT (mm)  1.25 (1.1-1.375)  0.8 (0.7-0.9)  <0.0001 
Altered LIMT n(%)  14 (82.4%)    <0.0001 
Biochemical Studies       
Leukocytes (thousands /μL)  6.81±1.24  6.87±1.4  0.894 
Hemoglobin (g/dL)  13.57±1.12  13.4±1.87  0.724 
Platelets (g/L)  284.24±83.53  268.59±42.75  0.473 
BT (mg/dL)  0.45(0.32-0.73)  0.5(0.34-0.62)  0.509 
AST (UI/L)  24 (17.5-32.8)  24.15(18.5-42.05)  0.715 
ALT (UI/L)  26.3(16.15-44.25)  27.6 (14-57.25)  0.635 
FA (UI/L)  111 (80.5-147)  96 (74-135.25)  0.682 
GGT (UI/L)  42 (24- 74.5)  30 (20.25-91.75)  0.482 
PT (g/dL)  7.6 (7.4-7.9)  7.45 (7.22-7.67)  0.333 
Albumin (g/dL)  4.32±0.5  4.35±0.39  0.852 
Cholesterol (mg/dL)  204.87±38.98  184.23±42.56  0.1 
HDL (mg/dL)  47.66±7.76  45.08±9.79  0.347 
LDL (mg/dL)  133.93±37.46  109.47±41.86  0.047 
VLDL (mg/dL)  26.6(22-30.7)  30 (20-35.1)  0.811 
Triglycerides (mg/dL)  140 (113.5-163.5)  151 (111.5-176.5)  0.788 
Glucose (mg/dL)  109(99.5-118.55)  96 (90-107.25)  0.185 
Creatinine (mg/dL)  0.75 (0.63-0.97)  0.71 (0.61-0.82)  0.455 
CRP (mg/dL)  6.52(2.0-8.19  1.5 (0.4-3.8)  0.324 
Insulin (mg/dl)  17.85(13.65-39.4)  17.2 (12.75-24.20)  0.433 
HOMA  4.16(3.72-11.13)  4.22 (2.93-6.22)  0.407 
Insulin resistance  9 (90%)  23 (92%)  0.849 
Blood Pressure       
SBP  130 (122.0-137.5)  125 (113.25-131.0)  0.337 
DBP  80 (70-85)  80 (71-86.5)  0.754 
Cardiovascular Risk Scales       
Framingham  5.8 (3.0-12.3)  1.7 (0.57-5.05)  0.037 
Low  8 (47.1%)  25 (73.5%)  0.186 
Moderate  4 (23.5%)  6 (17.6%)   
Moderately high  3 (17.6%)  3 (8.8%)   
High  1 (5.9%)     
Very high  1 (5.9%)     
ASCVD  8.4 (5.4-17.25)  3.7 (1.95-10.2)  0.047 
Low risk  3 (17.6%)  18 (52.9%)  0.038 
Borderline  2 (11.8%)  3 (8.8%)   
Intermedium  9 (52.9%)  7 (20.6%)   
High  3 (17.6%)  2 (5.9%)   
SCORE 2  8.1(4.75-12.9)  3.8 (1.7-6.85)  0.012 
Low  5 (29.4%)  19 (55.9%)  0.045 
High  5 (29.4%)  7 (20.6%)   
Very high  7 (41.2%)  4 (11.8%)   

RIMT: Right Intima-Media Thickness, LIMT: Left Intima-Media Thickness, GGT: Gamma-Glutamyl Transferase, TB: Total Bilirubin, AST: Aspartate Aminotransferase, ALT: Alanine Aminotransferase, ALP: Alkaline Phosphatase, TP: Total Proteins, HDL: High-Density Lipoproteins, LDL: Low-Density Lipoproteins, VLDL: Very Low-Density Lipoproteins, CRP: C-Reactive Protein, HOMA: Homeostatic Model Assessment, SBP: Systolic Blood Pressure, DBP: Diastolic Blood Pressure

Figure 1. ROC curves of cardiovascular risk and atherosclerosis scales.

Download PDF
Article options
Tools