


Mathematics competencies are critical in the development of the individual. There are several variables that can predict poor performance in this competition. These variables may be related to self-learner and teacher who instructs.
ObjectiveAnalyse the risk of poor performance depending on several variables: attending early childhood education, learning strategies and strategies used by the teacher uses.
MethodNo experimental or ex post facto.
DataWe used the database PISA 2012 for Spain provided by the Ministry of Education, Culture and Sport. The generated data sample consists of 25,313 young Spaniards of both sexes, aged 15 years, belonging to 902 schools that are distributed throughout the national territory of Spain.
Dependent or endogenous variablePerformance in mathematics.
Independent or exogenous variablesDifferent variables were considered: attendance and duration of Early Childhood Education, student learning strategies and teaching strategies.
Analysis of dataBinary logistic regression.
ResultsIt shows that the factor that has greater predictive capability of risk of underperformance is attending Early Childhood Education [β=−.595; ρ<.001]. It is the variable that has more predictive capability of risk of all analysed.
DiscussionThere are variables that increase the risk and others that reduce this risk. It is possible to prevent low performance in Mathematics competencies, for example, we need to pursue a teaching of quality Early Childhood Education knowing their long-term benefits and not only ensure access to it for all children.
Las competencias matemáticas son críticas en el desarrollo del individuo. Existen diversas variables que pueden predecir el bajo rendimiento en este tipo de competencias. Dichas variables pueden estar relacionadas con el auto-aprendiz o con el maestro que imparte instrucción.
ObjetivoAnalizar el riesgo de rendimiento bajo según diferentes variables: educación formal desde edad temprana, estrategias de aprendizaje y estrategias que utiliza el maestro.
MétodoNo experimental o ex post facto.
DatosSe utilizó la base de datos PISA 2012 para España, otorgada por el Ministerio de Educación, Cultura y Deporte. La muestra de datos generada consiste en 25313 jóvenes españoles de ambos sexos, de 15 años, pertenecientes a las 902 escuelas distribuidas a lo largo del territorio nacional de España.
Variable dependienteRendimiento en matemáticas.
Variable independienteDiferentes variables fueron consideradas: asistencia y duración de la educación en edades tempranas, estrategias de aprendizaje del estudiante y estrategias de enseñanza.
Análisis de datosRegresión binaria logística.
ResultadosEstos indican que el factor con mayor capacidad predictiva de rendimiento bajo es la educación formal en edades tempranas (B=–.595; p<.001). Es la variable que tiene mayor capacidad predictiva de todas las que se analizaron.
DiscusiónExisten variables que aumentan el riesgo y otras que lo disminuyen. Es posible prevenir el bajo rendimiento en competencias asociadas a las matemáticas; por ejemplo, se necesita hacer énfasis en la enseñanza de calidad en la educación en edades tempranas sabiendo los beneficios de esto a largo plazo y no solo garantizar el acceso a esta para todos los niños.
The present paper will discuss the Programme for International Student Assessment (PISA) 2012 of the Organisation for Economic Co-operation and Development (OECD) with respect to which factor has the best predictive capacity of low student performance in mathematics in PISA 2012, either attendance in Early Childhood Education or strategies for using strategies by the students themselves and by the teachers.
The focus of interest within the PISA framework in 2012 was based on mathematical competencies, for which two thirds of that framework was dedicated to their evaluation, as was the case for the evaluation of reading literacy skills in 2009 and, also, for the evaluation of scientific skills in 2015.
There are various sources that have analysed the relationship between Early Childhood Education attendance and performance in later stages (see Arteaga, Humpage, Reynolds, & Temple, 2014; Hindman, 2013; Lehrl, Klucznioka, & Rossbachba, 2016; Sylva et al., 2013; Temple & Reynolds, 2015). Particularly, for example, the National Association for the Education of Young Children (NAEYC) considers the Early Childhood Education stage to be essential in supporting the development of mathematical competencies at an early age, especially for pupils who are at risk (see Cebolla Boado, 2011, 2012; Garrido & Cebolla Boado, 2010; Hindman, 2013).
Further, with a focus on mathematical competences, studies indicate that difficulties in mathematics which are detected in Secondary Education cannot be explained by a single factor, but are acquired in a cumulative process that begins at a stage prior to formal education (Geary, Hamson, & Hoard, 2000). Several authors attribute difficulties with mathematical competences pre-academic numeracy skills acquired in early years (see Jordan, Glutting, & Ramineni, 2010). For example, Heckman (2006) analyses the effect of educational stimulation on the three stages of the evolutionary/educational cycle, which are compulsory education, adolescence, and adulthood. That study concludes that early stimulation has greater predictive ability of non-cognitive skills and cognitive stimulation that occur in later developmental stages. Arteaga et al. (2014) and Lehrl et al. (2016) also provide evidence of long-term benefits that entail enrolment in Early Childhood Education. These benefits have been observed in compulsory education after completion of Early Childhood Education and also help to reduce any observed gap between this stage and further stages (Karoly, Kilburn, & Cannon, 2005).
Particularly, mathematical competencies have traditionally been considered as basic skills, and the keys to academic success (Bryant, Bryant, Gersten, Scammacca, & Chavez, 2008). Their success has been linked to several variables (Ahmed, Minnaert, Kuyper, & Van der Werf, 2012; Callejo & Vila, 2009; Chionh & Fraser, 2009; Rosario et al., 2012; Sánchez, 2014). Particularly, early performance in mathematical competency is also considered a highly predictive factor of subsequent performance in mathematics (Grissmer et al., 2013; Jordan et al., 2010; Mazzocco & Thompson, 2005; Taskin & Tugrul, 2014).
The pre-primary education stage, under current regulations in Spain (which establishes the minimum teaching requirements in the second cycle of Early Childhood Education), serves children from birth to six years of age in order to contribute to their physical, emotional, social and intellectual development. It is organised in two cycles of three years each: up to three years (which is not free of charge but not compulsory) and from 3 to 6 years (which is free of charge and not compulsory).
“Assistance with children's education is associated with better academic performance later”, as noted by the OECD in its report “Does Early Childhood Education arrive to those most in need?” (OECD, 2013a, 2013b). The impact of early schooling on the later ages of children has been analysed in several publications within the body of literature (see Lehrl et al., 2016). Thus, Lehrl et al. (2016) associate the high quality of training in Early Childhood Education with the development of children during the later school years, and simply with mere attendance at this educational level. Attendance in Early Childhood Education is also modulated by other variables such as, for example, the family background of a child and their socioeconomic status within the school (see Touron, Hernández, Morera, & Asencio, 2012), which is beyond the scope of this study.
According to the data itself MEC and OCDE (2013a), Spain obtained an average score of 484 points in mathematics, which is 10 points below the OECD average of 494 and 5 points below the European Union average of 489, the difference with the former being statistically significant, but not with the latter. The performance of students in Spain is in the range of 481–488 points, with a confidence level of 95%.
The results for Spanish schools in mathematical competences in PISA 2012 indicate that 19.5% of students have a level of performance in this competition Level 1 in PISA 2012 (MEC & OECD, 2013a,b). Level 1 represents the lowest level of competence or “lowest performers”, with scores in the range of 357.7–420.1. Pupils (or students) who are at this level know how to respond to questions that are related to familiar contexts, within which all relevant information is present and the questions are clearly defined. More precisely, the pupils are able to identify information and to perform routine procedures following direct instruction in explicit situations. Furthermore, they can perform actions that are obvious and follow immediately from the presented stimulus.
With regard to attendance in Early Childhood Education in Spain, the percentage of pupils who attend is 94% (the take up rate of this scheme), which is very close to the international average (93%) in PISA. 85% of students reported that they had attended for a duration of more than one year in Early Childhood Education, while 8% reported that they had attended for a duration of less than one year.
Most of the available empirical evidence on this issue focuses on analysing only the impact of early intervention on performance, without analysing the variables of a cognitive nature that affect both the teaching and the learning, and may be associated with performance in mathematical competences. In the present study, we focus on analysing and comparing the risks that students have in poor performance regarding mathematical literacy in PISA 2012, based on the attendance in Early Childhood Education and their use of strategies by the students themselves and by the teachers.
Identifying risk factors can assist in designing proposals that would reduce those risks and therefore would reduce the number of schoolchildren with low performance. The aim of this study is identify the factor that has the best predictive ability of low performance in mathematical competencies.
MethodA quasi-experimental or an ex post facto descriptive design, based on a questionnaire, was developed by the OECD. In PISA 2012, there are three basic skills in Secondary Education (Reading, Mathematics and Science) that are evaluated.
DataIn this research, the PISA 2012 database for Spain was used, which is available on the Website of the Ministry of Education, Culture and Sport (2012, URL – http://www.mecd.gob.es/inee/Bases-de-datos.html, Date accessed: 28th August 2016). This questionnaire is applied in the final (fourth) year of Secondary Education.
The generated data sample consists of 25,313 young Spaniards of both sexes, aged 15 years, belonging to 902 schools that are distributed throughout the national territory of Spain.
As well as providing competency testing in Reading, Mathematics and Science, PISA 2012 also provides a very extensive set of information on the context of student learning, through questionnaires that are completed by students, parents, teachers and headmasters. With these variables, we studied the effect of student attendance, taking into account the possible additional effect of the teaching and learning strategies as applied by the teacher and student, respectively.
The yield of the three competencies in PISA 2012 is categorised in different levels of competency, with Level 1 (lower level) to Level 6 (upper level). For example, a student is at Level 1 in reading literacy when he or she is able to locate explicit information that figures prominently in a place within a text that has a simple syntactic structure, and a student is at Level 6 when he or she is capable of making inferences, comparisons and contrasts.
It also includes a very extensive set of information on the context of student learning through questionnaires that have been completed by students, parents, teachers, and headmasters.
Variables of the investigationIn light of these studies, we cannot consider a single factor or cause to explain and predict academic performance or, by extension, underperformance as being necessary in opting for a multi-causal model. In the present study, we focus on cognitive and non-cognitive skills that are developed during pre-primary (pre-kindergarten, pre-k or preschool) education, which is considered as one of the main determinants of productivity in school during later educational stages, hence it is particularly important to not underestimate the importance of economic investment at this early stage.
A model is presented which includes the different variables that have been considered as being predictive of low performance in mathematical competences in PISA 2012 (see Fig. 1).
 in PISA 2012 (own elaboration).")
With respect to the particular role in this research, we differentiate between dependent and independent (or endogenous or exogenous) variables.
Dependent or endogenous variable: mathematical competenceThe definition of mathematical competencies in PISA 2012, includes three interrelated aspects (MEC & OCDE, 2013a): (i) mathematical processes that describe how the individuals relate to the context of the problem with mathematics and thereby resolve the problem and capabilities that underlie these processes; (ii) specific mathematical content to be used in the evaluation questions; and (iii) contexts into which the evaluation questions are inserted.
The contents evaluated are: (i) quantity, (ii) space, (iii) change and relationships, and (iv) uncertainty and data.
Along with these contents three processes are considered: (i) Formulating situations mathematically; (ii) Use of concepts, data, procedures and mathematical reasoning; (iii) Interpretation, implementation and evaluation of mathematical results. Table 1 shows the descriptive statistics in the overall context of the mathematical competencies, dimensions and processes that are presented.
Mathematical competences, dimensions and processes (descriptive statistics).
| Minimum | Maximum | Mean | Standard deviation | Variance | Skewness | Kurtosis | |
|---|---|---|---|---|---|---|---|
| Mathematica | 130.06 | 807.30 | 495.44 | 85.79 | 7360.74 | −.194 | −.160 |
| Dimensions | |||||||
| Chance | 48.57 | 806.21 | 493.33 | 90.24 | 8142.67 | −.258 | .007 |
| Quantity | 47.24 | 835.81 | 502.00 | 96.01 | 9217.84 | −.261 | .029 |
| Space | 58.33 | 812.36 | 490.90 | 91.09 | 8298.27 | −.072 | −.100 |
| Uncertainty | 10.88 | 795.23 | 497.76 | 90.62 | 8211.28 | −.290 | .129 |
| Processes | |||||||
| Employ | 66.09 | 748.26 | 492.75 | 83.34 | 6946.30 | −.286 | −.045 |
| Formulate | 31.93 | 856.92 | 490.93 | 97.71 | 9547.45 | −.174 | −.033 |
| Interpret | 72.81 | 819.37 | 503.88 | 94.72 | 8972.54 | −.230 | −.046 |
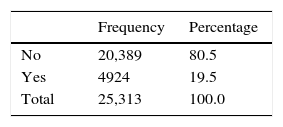
Low performance in mathematics has been dichotomised into Dummy variable: Yes (presence of underperformance) – No (absence of underperformance). 19.5% of schoolchildren have low performance in mathematical competences (see Table 2).
In this study, underperforming at Level 1, as aforementioned, represents the lowest level of competence or “lowest performers”, with scores in the range of 357.7–420.1.
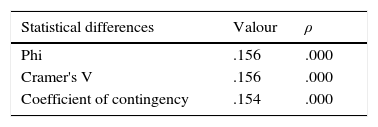
The association between the dependent variable (performance in mathematical competencies) and the main independent variable (attendance in Early Childhood Education), under study had statistical differences (see Table 3), indicating that the association between the variables is weak to very weak.
Independent or exogenous variablesWe consider a number of factors as possible determinants of the scores obtained by students: attendance and duration of Early Childhood Education, student learning strategies and teaching strategies. Then, we focus on operationalisation these variables.
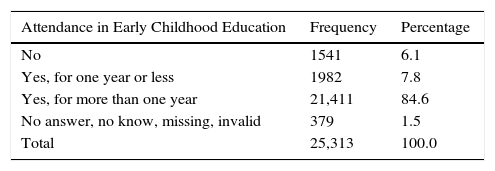
Attendance in Early Childhood EducationEarly Childhood Education attendance has been operationalised with respect to the number of years: (i) No attendance, (ii) Yes, for one year or less y (iii) Yes, for more than one year. Table 4 shows the descriptive characteristics (frequency and percentage) of the participants in the sample presented in the study. From the total number of Spanish students participating in PISA 2012 Early Childhood Education, 98.5% had attended for a period of at least one year.
Attendance in Early Childhood Education (frequency and percentage).
| Attendance in Early Childhood Education | Frequency | Percentage |
|---|---|---|
| No | 1541 | 6.1 |
| Yes, for one year or less | 1982 | 7.8 |
| Yes, for more than one year | 21,411 | 84.6 |
| No answer, no know, missing, invalid | 379 | 1.5 |
| Total | 25,313 | 100.0 |
The analysis of the strategies used by students and teachers themselves was introduced for the first time in PISA 2012.
a) Strategies for student-centred learning in mathematicsThe Spanish PISA 2012 report aims at analysing the issues that focus on knowing the frequency with which students use different strategies in their daily study. These strategies are classified as: (i) Control strategies: the pupil controls the learning process and determines at any time, what they already know and also what they need to know. (ii) Reflective-relationship strategies: the pupil reflects upon what they are studying and seeks to relate that knowledge to other subjects or to real life. (iii) Memorisation strategies: pupil-based learning, especially in memorising the concepts and also repeating the exercises in class.
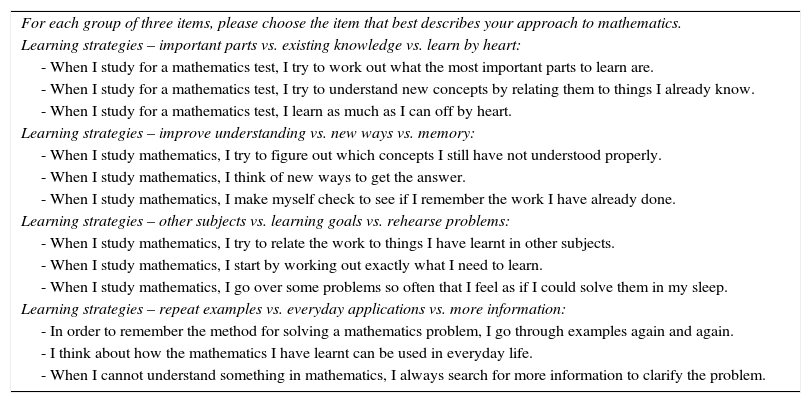
It is a questionnaire consisting of four questions with three possible answers for each question, whereby the first response corresponds to control strategies, the second response corresponds to reflection-related strategies and the third response corresponds to memory strategies. Table 5 shows the questionnaire on learning strategies in mathematics that are presented.
Questions included in the questionnaire on learning strategies for student-centred learning in mathematics.
| For each group of three items, please choose the item that best describes your approach to mathematics. |
| Learning strategies – important parts vs. existing knowledge vs. learn by heart: |
| - When I study for a mathematics test, I try to work out what the most important parts to learn are. |
| - When I study for a mathematics test, I try to understand new concepts by relating them to things I already know. |
| - When I study for a mathematics test, I learn as much as I can off by heart. |
| Learning strategies – improve understanding vs. new ways vs. memory: |
| - When I study mathematics, I try to figure out which concepts I still have not understood properly. |
| - When I study mathematics, I think of new ways to get the answer. |
| - When I study mathematics, I make myself check to see if I remember the work I have already done. |
| Learning strategies – other subjects vs. learning goals vs. rehearse problems: |
| - When I study mathematics, I try to relate the work to things I have learnt in other subjects. |
| - When I study mathematics, I start by working out exactly what I need to learn. |
| - When I study mathematics, I go over some problems so often that I feel as if I could solve them in my sleep. |
| Learning strategies – repeat examples vs. everyday applications vs. more information: |
| - In order to remember the method for solving a mathematics problem, I go through examples again and again. |
| - I think about how the mathematics I have learnt can be used in everyday life. |
| - When I cannot understand something in mathematics, I always search for more information to clarify the problem. |
In relation to these strategies we noted: 26.9% consider most important the “Important Parts vs. Existing Knowledge vs. Learn by Heart”; 30.8% consider “Improve understanding the Improve Understanding vs. New Ways vs. Memory”; 34.8% considerer “Learning goals the Other Subjects vs. Learning Goals vs. Rehearse Problems”; 39.2% consider “Repeat examples the Repeat Examples vs. Everyday Applications vs. More Information”.
b) Teaching strategiesTeaching strategies can be classified according to the study in PISA 2012 (MEC & OCDE, 2013a; MEC & OCDE, 2013b): traditional or teacher-led strategies, pupil-centred strategies, cognitive activation strategies and finally, formative assessment strategies.
In this study, we focus on the four strategies, as discussed in PISA 2012, which are analysed below.
b.1. Cognitive activation strategiesCognitive activation strategies are those in which the student is the one who must first seek an answer to any questions that are posed in class. In these strategies, the teacher becomes both the assistant and the motivator, in instigating pupil curiosity, fostering the ability of a pupil to think and to seek alternative ways of solving the same problem and, ultimately, stimulating the critical capacity of the pupil.
Strategies for the teaching of pupils and for cognitive activation represent the teaching that is based upon the constructivist paradigm.
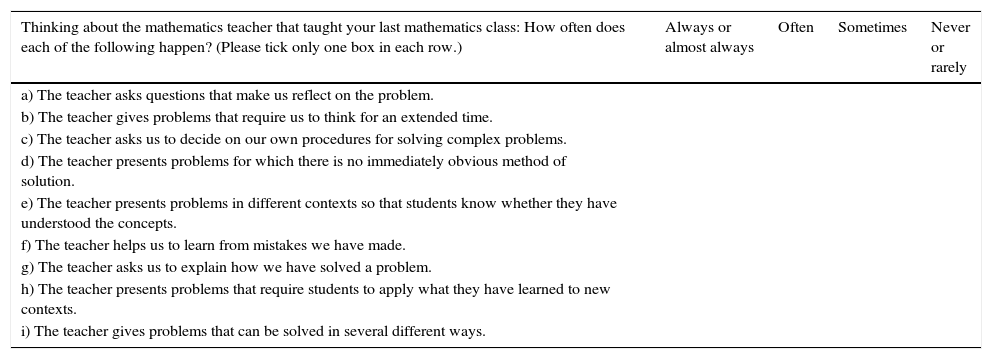
The scale of cognitive activation was constructed using responses that gave pupils the frequency of a number of situations that occur with the teaching of mathematics by the teacher. The frequency scale is the Likert Scale (always or almost always, often, sometimes, never or rarely), which is derived from the psychometric scale proposed by Baumert et al. (2010). The questionnaire on cognitive activation strategies is presented in Table 6.
Questions related to cognitive activation strategies.
| Thinking about the mathematics teacher that taught your last mathematics class: How often does each of the following happen? (Please tick only one box in each row.) | Always or almost always | Often | Sometimes | Never or rarely |
|---|---|---|---|---|
| a) The teacher asks questions that make us reflect on the problem. | ||||
| b) The teacher gives problems that require us to think for an extended time. | ||||
| c) The teacher asks us to decide on our own procedures for solving complex problems. | ||||
| d) The teacher presents problems for which there is no immediately obvious method of solution. | ||||
| e) The teacher presents problems in different contexts so that students know whether they have understood the concepts. | ||||
| f) The teacher helps us to learn from mistakes we have made. | ||||
| g) The teacher asks us to explain how we have solved a problem. | ||||
| h) The teacher presents problems that require students to apply what they have learned to new contexts. | ||||
| i) The teacher gives problems that can be solved in several different ways. |
In relation to these strategies we noted: (i) 23.8% apply often the “Teacher Encourages to Reflect Problems”. (ii) 23.5% sometimes apply “Gives Problems that Require to Think”. (iii) 23.3% sometimes apply “Asks to Use Own Procedures”. (iv) 24.6% sometimes apply “Presents Problems with No Obvious Solutions”. (v) 24.6% often apply “Presents Problems in Different Contexts”. (vi) 21.8% often apply “Helps Learn from Mistakes”. (vii) 21.3% often apply “Asks for Explanations”. (viii) 22.9% often apply “What We Learned”. (ix) 25.1% often apply “Problems with Multiple Solutions”.
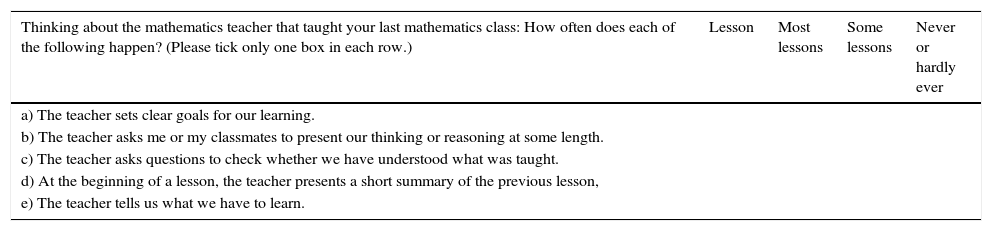
b.2. Teacher-directed instructionTraditional teacher-led strategies are based on the lecture and repetition until students master the protocol resolution of those exercises or tasks or specific knowledge they have memorised. The teacher sets learning objectives globally for all students and indicates what they have to learn.
Teaching strategies of subtype Teacher-Directed Instruction are presented in Table 7. These strategies are evaluated through a Likert scale (Lesson, Most Lessons, Some Lessons, Never or Hardly Ever).
Questions related to Teacher-Directed Instruction.
| Thinking about the mathematics teacher that taught your last mathematics class: How often does each of the following happen? (Please tick only one box in each row.) | Lesson | Most lessons | Some lessons | Never or hardly ever |
|---|---|---|---|---|
| a) The teacher sets clear goals for our learning. | ||||
| b) The teacher asks me or my classmates to present our thinking or reasoning at some length. | ||||
| c) The teacher asks questions to check whether we have understood what was taught. | ||||
| d) At the beginning of a lesson, the teacher presents a short summary of the previous lesson, | ||||
| e) The teacher tells us what we have to learn. |
In relation to these strategies we noted: (i) 27.1% apply most lessons “Sets Clear Goals”. (ii) 22.0% apply some lessons “Encourages Thinking and Reasoning”. (iii) 26.2% apply every lessons “Checks Understanding”. (iv) 22.6% apply some lessons “Summarises Previous Lessons”. (v) 22.3% apply most lessons “Informs about Learning Goals”.
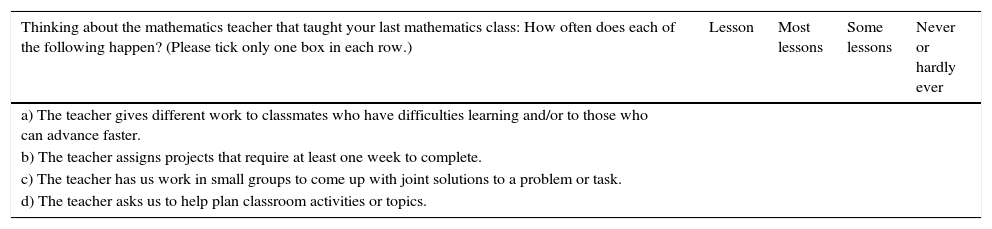
b.3. Student orientationTeaching strategies that focus on the pupil recognise the heterogeneity among pupils in their learning strategies. Examples of student-centred teaching strategies: working in small groups, having different tasks for pupils with disabilities or instructing pupils who perform tasks that require at least a week to resolve.
Teaching strategies of subtype Student Orientation are presented in Table 8. These strategies are evaluated through a Likert scale (lesson, most lessons, some lessons, never or hardly ever).
Questions related to student orientation.
| Thinking about the mathematics teacher that taught your last mathematics class: How often does each of the following happen? (Please tick only one box in each row.) | Lesson | Most lessons | Some lessons | Never or hardly ever |
|---|---|---|---|---|
| a) The teacher gives different work to classmates who have difficulties learning and/or to those who can advance faster. | ||||
| b) The teacher assigns projects that require at least one week to complete. | ||||
| c) The teacher has us work in small groups to come up with joint solutions to a problem or task. | ||||
| d) The teacher asks us to help plan classroom activities or topics. |
In relation to these strategies we noted: (i) 37.37% never or hardly ever apply “Differentiates between Students When Giving Tasks”. (ii) 36.9% never or hardly ever apply “Assigns Complex Projects”. (iii) 33.6% never or hardly ever apply “Has Students Work in Small Groups”. (iv) 38.1% never or hardly ever apply “Has Students Work in Small Groups”. (v) 35% never or hardly ever apply “Plans Classroom Activities”.
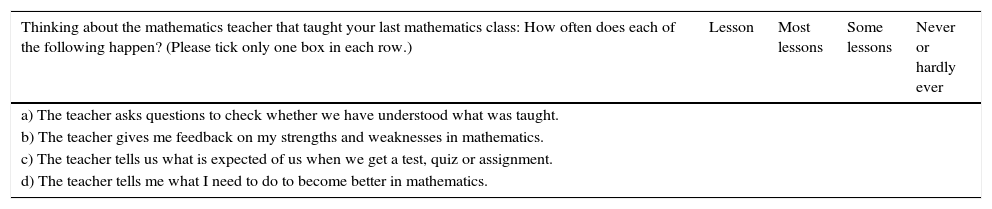
b.4. Formative assessmentFormative assessment strategies are related to intensive practices such as, checking the workbooks of pupils, making written comments on the work of pupils in addition to scores, or observing pupils when they work and making appropriate comments.
Teaching strategies of the subtype Student Orientation are presented in Table 9. These strategies are evaluated through a Likert scale (lesson, most lessons, some lessons, never or hardly ever).
Questions related to formative assessment.
| Thinking about the mathematics teacher that taught your last mathematics class: How often does each of the following happen? (Please tick only one box in each row.) | Lesson | Most lessons | Some lessons | Never or hardly ever |
|---|---|---|---|---|
| a) The teacher asks questions to check whether we have understood what was taught. | ||||
| b) The teacher gives me feedback on my strengths and weaknesses in mathematics. | ||||
| c) The teacher tells us what is expected of us when we get a test, quiz or assignment. | ||||
| d) The teacher tells me what I need to do to become better in mathematics. |
With respect to Formative Assessment, we note: 24.1% apply some lessons “Gives Feedback”. (ii) 24.6% apply never or hardly Ever “Gives Feedback on Strengths and Weaknesses”. (iii) 22.1% apply some lessons “Informs about Expectations”. (iv) 20% apply some lessons “Tells How to Get Better”.
Data analysisIn order to predict the occurrence of low performance, based on a set of predictor variables, we opted for a binary logistic regression analysis (Logistic Probability Unit) (Method=Enter). We believe that this technique is best suited to meet the objective of the research and the nature of the dependent variable (nominal – bivariate), underperforming versus non-underperforming (Level 1) in mathematical competences in PISA 2012. The considered predictor variables are: attendance in Early Childhood Education, learning strategies used by pupils and teaching strategies.
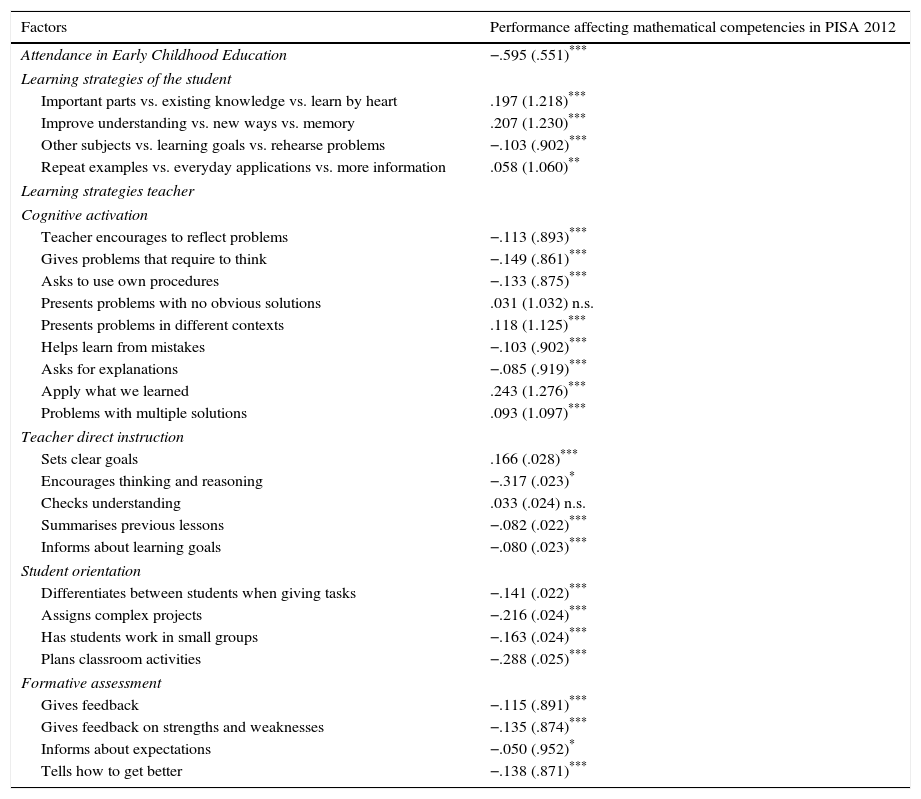
ResultThe results of the binary logistic regression analysis are presented in Table 10. Such results inform us of the predisposition of attendance factors in Early Childhood Education, learning strategies used by pupils, and teaching strategies used by teachers on underperforming (Level 1) in mathematical competencies in PISA 2012. When the values of Exp (β) are greater than 1 (i.e. β>0), the ratio between the probabilities of underperformance grows with the variables, and equivalently high values of these variables suggest a greater tendency to underperformance in mathematical competencies. If, conversely, if the values of Exp (β) are less than 1 (i.e. β<0), the ratio of the probabilities of underperformance decreases when the analysed variables are increased, and equivalently high values of these factors suggest a lower tendency towards underperformance in mathematical competencies.
Influence of factors of attendance in Early Childhood Education and the strategies of the student and the teacher him/herself low performance affecting mathematical competencies in PISA 2012 (β Exp (β) and the degree of significance statistical.
| Factors | Performance affecting mathematical competencies in PISA 2012 |
|---|---|
| Attendance in Early Childhood Education | −.595 (.551)*** |
| Learning strategies of the student | |
| Important parts vs. existing knowledge vs. learn by heart | .197 (1.218)*** |
| Improve understanding vs. new ways vs. memory | .207 (1.230)*** |
| Other subjects vs. learning goals vs. rehearse problems | −.103 (.902)*** |
| Repeat examples vs. everyday applications vs. more information | .058 (1.060)** |
| Learning strategies teacher | |
| Cognitive activation | |
| Teacher encourages to reflect problems | −.113 (.893)*** |
| Gives problems that require to think | −.149 (.861)*** |
| Asks to use own procedures | −.133 (.875)*** |
| Presents problems with no obvious solutions | .031 (1.032) n.s. |
| Presents problems in different contexts | .118 (1.125)*** |
| Helps learn from mistakes | −.103 (.902)*** |
| Asks for explanations | −.085 (.919)*** |
| Apply what we learned | .243 (1.276)*** |
| Problems with multiple solutions | .093 (1.097)*** |
| Teacher direct instruction | |
| Sets clear goals | .166 (.028)*** |
| Encourages thinking and reasoning | −.317 (.023)* |
| Checks understanding | .033 (.024) n.s. |
| Summarises previous lessons | −.082 (.022)*** |
| Informs about learning goals | −.080 (.023)*** |
| Student orientation | |
| Differentiates between students when giving tasks | −.141 (.022)*** |
| Assigns complex projects | −.216 (.024)*** |
| Has students work in small groups | −.163 (.024)*** |
| Plans classroom activities | −.288 (.025)*** |
| Formative assessment | |
| Gives feedback | −.115 (.891)*** |
| Gives feedback on strengths and weaknesses | −.135 (.874)*** |
| Informs about expectations | −.050 (.952)* |
| Tells how to get better | −.138 (.871)*** |
n.s. non-significant.
Attendance in Early Childhood Education is the variable that has greater predictive value compared to the other analysed [β=−.595; ρ<.001].
Regarding the strategies used by the pupils themselves there are “Improve Understanding strategies vs. New Ways strategies vs. Memorisation strategies”, which have the greatest capacity of all to augment potential [β=.207; ρ<.001].
Regarding teaching strategies in each of the subtypes, the following variables are included: (a) Cognitive activation: “Apply what we learned” [β=.243; ρ<.001]. (b) Teacher direct instruction: “Sets Clear Goals” [β=.166; ρ<.001]. (c) Student orient: “Assigns complex projects” [β=−.216; ρ<.001]. (d) Formative assessment: “Gives feedback on strengths and weaknesses” [β=−.135; ρ<.001].
Not all variables have the same impact on the tendency towards the probability of underperformance in mathematical competencies in PISA 2012. The probability of underperformance in mathematical competencies in PISA 2012 augments significantly with the following variables: (i) Pupil Learning strategies: “Important Parts vs. Existing Knowledge vs. Learn by Heart”, “Improve Understanding vs. New Ways vs. Memory” and “Repeat Examples vs. Everyday Applications vs. More Information”. (ii) With respect to Teaching methods employing cognitive activation strategies, we can foreground: “Presents problems in different contexts and Apply what we learned” and “Problems with multiple solutions”.
The probability of underperformance in mathematical competencies in PISA 2012 attenuates significantly with the following variables: (i) Attendance in Early Childhood Education. (ii) With respect to student learning strategies such as “Other Subjects vs. Learning Goals vs. Rehearsal of Problems”. (iii) With respect to Teaching strategies: (a) Cognitive activation: “Teacher encourages to reflect problems”, “Gives problems that require to think”, “Asks to use own procedures”, “Helps learn from mistakes” and “Asks for explanations”. (b) Teacher direct instruction: “Encourages thinking and reasoning”, “Summarises previous lessons and Informs about learning goals”. (c) Student orientation: “Differentiates between students when giving tasks”, “Assigns complex projects” and “Has students work in small groups y plans classroom activities”. (d) Formative assessment: “Gives feedback”, “Gives feedback on strengths and weaknesses”, “Informs about expectations” and “Tells how to get better”.
The analysis of binary logistic regression permits a correct classification of pupils who show underperformance in mathematical competencies and those without underperformance in mathematical competencies, particularly in relation to: (i) Attendance in Primary Education at 81.2%; (ii) Pupil learning strategies at 81.4%; (iii) Well-defined with respect to teaching strategies: (a) Cognitive activation strategies at 81.6%, (b) Teacher Directed Instruction at 81.4%, (c) Student Orientation at 81.5% and (d) Formative assessment at 81.3%.
Discussion and conclusionsThe aim of this study was to identify which factor has more predictive ability with respect to underperformance in mathematical competencies. For this purpose, two factors were selected whose occurrence in the life of the pupil occurs at two different stages. The first stage is attendance in Early Childhood Education (the initial stage of the Education System). The second stage is related to the use of strategies by the pupils themselves and by teaching strategies linked to the secondary stage of education.
The results of the analysis of binary logistic regression clearly show that the factor with the greater predictive capability of the probability of underperformance is attendance in Early Childhood Education, having a significantly greater probability than the other variables which were analysed in this study.
These results link with the results that were obtained by other researchers that impinge upon the association between underperformance in mathematical competences and attendance in Early Childhood Education (see Hindman, 2013; Lehrl et al., 2016; Temple & Reynolds, 2015).
Furthermore, predictive variables do exist that are related to the use of learning strategies and mathematical competencies (see Ramirez, Chang, Maloney, Levine, & Beilock, 2016). Ramirez et al. (2016) condition the use of strategies for the pupil with respect to other variables, such as anxiety, which escapes from the object of this study. In particular, the results of the Spanish National Institute of Educational Evaluation (INEE) itself, suggest that teaching strategies contribute negatively to performance in mathematics, while the learning strategies of pupils have a positive impact.
Notwithstanding, we completed this research, but note that we have found that, to the best of our knowledge, there are no studies that analyse and compare the predictive ability of the three factors in an interrelated manner (attending Early Childhood Education, learning strategies of pupils and teaching strategies). Hence, the obtained results cannot be compared with other evidence. However, the originality and novelty of the data and the contribution of this study to this field of knowledge are all noteworthy.
This study confirms that attendance in Early Childhood Education is the variable that has greater predictive capacity of underperforming in mathematical competencies in PISA 2012. These data complement the aforementioned data in considering that Early Childhood Education provides the prerequisite skills upon which will be established a good foundation for further learning. But, with respect to the acquisition (or deficiency thereof) of the prerequisite skills, they cannot be exclusively associated with underperformance in mathematical competencies in Secondary Education.
Programmes in Primary School can be designed to provide special attention for children who did not attend programmes of Early Childhood Education, in order to prevent social inequalities in academic performance that are noted in several studies within the body of literature, see, for example: Cebolla Boado (2012), Garrido and Cebolla Boado (2010) or Segretin et al. (2014).
At the same time, it is necessary to aim at a good quality of Early Childhood Education, that shall provide evidence of whether it is solely the attendance, or of it is solely the quality of the education that permits the prediction of performance in later stages.
Furthermore, bet on a stage of quality Early Childhood Education is important to employ a psycho-educational design for Secondary Education programmes that focus on the use of learning strategies by the pupil. Teachers also decide what strategies to use, what role these strategies they will play in the class, and especially that which strategy is to be used, as needed. Thus, cognitive activation strategies, for example, represent just one facet of the recommended strategies for the development of mathematical competencies (OECD, 2013c). The effectiveness of strategies is linked to numerous variables, such as the structuring of the contents, classroom climate or level of anxiety that motivates the student towards mathematics.
In this study, we have not considered variables that are intrinsic to the pupils themselves (for example, self-efficacy, anxiety, motivation, etc.) that can explain the use of strategies by the pupils. That is why, in future studies, structural equation modelling techniques can be developed and include these variables. The results, for example, of the study by Kriegbaum, Jansen, and Spinath (2015) confirm that motivation plays a very important role in predicting academic performance.
It is also important, as a potential future line of research, to compare the results obtained in this study using the Spanish sample, with those results that have been obtained in other cultures. Zhang, Khan, and Tahirsylaj (2015) suggest that culture is an important predictor when comparing and contrasting different school systems.
FundingThis study was completed during the research stay, conducted in July 2016 at the Spanish National Institute for Educational Evaluation (INEE), under the auspices of the Spanish Ministry of Education, Culture and Sport (MECD).
Conflict of interestThe authors have no conflicts of interest to declare.
Peer Review under the responsibility of Universidad Nacional Autónoma de México.