


This paper presents an analysis of the data of the technical team (psychologist, social worker and educator) of the juvenile court of Toledo (Spain) from 2001 to 2012.
MethodologyDescriptive study of the annual series of a sample of 3333 juvenile offenders and their psychosocial, educational and criminal characteristics.
ResultsIn the latter years of the series there tends to be infractions of greater gravity committed by older boys.
ConclusionsJuvenile delinquency in the province of Toledo remained constant from 2001 until 2009, when a sharp increase was observed, which lowered again during the years 2011 and 2012. However, in the latter years of the series (starting 2008) an increase in the gravity of the acts is noted, with the number of crimes increasing more significantly than the misdemeanours. The team has also detected that perhaps institutions underestimate the diagnosis of the juvenile misdemeanours, even in mental health issues, such as abuse of alcohol and other substances. Therefore, these minors may not achieve the benefits of the justice youth system.
En este artículo se analizan los datos del equipo técnico (psicólogo, trabajador social y educador) del juzgado de menores de Toledo (España) desde el año 2001 a 2012.
MetodologíaEstudio descriptivo de la serie anual de una muestra de 3.333 menores infractores y de sus características psicosociales, educativas y delictivas.
ResultadosEn los últimos años de la serie se tiende a infracciones de mayor gravedad cometidas por chicos de mayor edad.
ConclusionesLa delincuencia de menores en esta provincia desde el año 2001 se mantuvo constante hasta el año 2009, en el que se observa un destacado repunte para volver a bajar durante los años 2011 y 2012. Sin embargo, en los últimos años de la serie (a partir de 2008) se constata un aumento de la gravedad de los hechos, al ser significativamente más numerosos los delitos que las faltas. También se ha detectado que probablemente el sistema infradiagnostica a los menores infractores, tanto en problemas de salud mental como en consumo de alcohol y otras drogas. Por lo tanto, estos menores no se beneficiarían adecuadamente de las medidas impuestas por el sistema de justicia juvenil.
Juvenile delinquency is internationally considered a social problem of great impact in our neighbouring countries.1–6 However, the crimes committed by minors in Spain and other European countries are not as numerous as generally perceived by public opinion.2 In a recent study,3 using data from the Spanish National Office of Statistics (INE) from 2007 to 2012, obtained a rate of juvenile offenders (aged from 14 to 18) of 1.64%. The main conclusions of this research study were that juvenile delinquency in the period under consideration is not occurring increasingly earlier, that it is generally not very serious, and it is not correct to link insecurity with immigration.3
International directives on the issue emphasise the need to investigate this phenomenon.4 In this regard, an international study with an ample sample (2100 pupils per country) from several countries (31 countries) that investigated the impact of schooling on juvenile delinquency, using regression models, concluded that gender, school disorganisation (which has to do with the school's control, for example, vandalism and drug sales at school are measured) and school performance are the variables that best predict juvenile delinquency.5 Likewise, in a recent article with a sample of 1035 juvenile offenders and non-offenders from Spain, Mexico and El Salvador, it was found through regression that the variables of age, gender and educational level were the best predictors of offending behaviour.6
Empirical evidence from both European and American samples indicates that early onset of alcohol and drug use predicts behavioural problems, delinquency and substance misuse culminating in drug addiction.7–12 The treatment of young people with mental health problems in the juvenile justice system has posed a challenge for intervention, although investigation in this field has traditionally been sparse, providing no conclusive data. However, there now seems to be some consensus that cumulative data imply that between 65% and 70% of young people who come into contact with the juvenile justice system would meet some of the diagnostic criteria of DSM-IV.1,13–15 In a recent paper using a sample of 144 young people attended in the Juvenile Justice Therapeutic Unit (UTJJ) of Parc Sanitari Sant Joan de Deu, which attends the mental health and drug addiction treatment needs of young offenders (who are complying with some measure imposed by a juvenile court judge) in Catalonia, it was found that 65.3% of the sample had an axis I disorder (DSM-IV-R)13 and 78.5% consumed toxic substances.10 This is a very high figure, but should be viewed in the context of this sample, which was already being attended by the therapeutic unit. Therefore these data need to be related to community samples. Thus, according to the White Paper on Child and Adolescent Psychiatry, it is estimated that one fifth of Spanish adolescents under the age of 18 suffer an emotional development or behavioural problem of some sort, and that one in 8 (12.5%) currently has a mental disorder.16 Objective 5 of the 2nd Strategic Plan for Children and Adolescents 2013–2016,17 specifically deals with youth offenders, recommending research into their profiles and interventions, suggesting more in-depth study how delinquent behaviour arises and is maintained.17–19 In this regard, a recent research study with a sample of 595 minors sentenced in the Juvenile Court of Almeria, studied reoffending at 2 years. In this sample, 85.4% were males, 79% were of Spanish nationality, 11.6% had absenteeism from school, and 12.6% had some mental health problem. At the end of the 2-year follow-up, it was found that the latter 2 variables, together with age, lack of parental supervision and the existence of delinquent relatives were the variables most strongly associated with reoffending.20
The Children's Act21 limits the measures that the juvenile justice system can impose on youth offenders (between 14 and 18 years of age) and bases them on the best interests of the minor, which must be upheld by the teams of non-legal professionals that make up the technical teams (educator, social worker and psychologist) in all the juvenile prosecutor's offices and courts in Spain.2 These measures include outpatient treatment, which may be imposed on its own or complementary to any other in cases where minors might benefit from a “therapeutic programme to help them overcome addictive processes or significant mental dysfunction”.21 There is also what is considered therapeutic internment for minors with addiction and mental health problems.2,21 However, a decision by the juvenile judge to impose a therapeutic measure (outpatient treatment or internment under a therapeutic regime) must be based on the report of the technical team, otherwise it is highly unlikely that the juvenile judge will make a judgement to that effect. 2,10,21
There are few longitudinal research studies on how this law functions.2,3,10,21 Among the most noteworthy, in addition to those already mentioned, we can cite the analysis of the official statistics on juvenile delinquency in the Canary Islands that, with data from reports, concludes a slight downward trend over the period studied (from 2000 to 2009).22 There is the study on reoffending in Asturias from 2001 to 2004 with a sample of 382 minors (86% male, mean age 16.7 years), which presents global data without distinguishing them by year, concluding that 70% did not reoffend in the follow-up period of one year and 6 months.23 A research study that fundamentally sought to study the time taken by the system to complete the files of juvenile offenders in Catalonia found that in 2005 67.6% of juvenile offenders had Spanish nationality, and this had dropped to 61.2% by 2008.24 In the Basque Country, a retrospective study of 240 files compared the measures imposed on juvenile offenders from 2000 to 2004, finding a sustained increase in open-environment measures and a decrease in internment during the period studied. This paper also concluded that academic failure is the best predictor of reoffending.25 The data on internment would be similar to those provided with data from the Regional Government of Andalusia from 2007 to 2010. In this series, internment went from a minimum of 12.22% in 2010, to a maximum of 14.02% recorded in 2009. Taken as a whole over these 4 years, internment accounted for 13.35% of the total.26 In this same study, the progression of female offenders was 49% compared to 19% of boys (in 2010, the last year of the series and the year with the highest number of young offenders, there were 5185 boys compared to 791 girls). In terms of nationality, there was a variation from 2007 to 2010 of 81% of foreigners compared to 20% of Spanish nationals, although with much higher absolute figures than those of Spanish nationals (in 2010, which was the year with the highest number of young offenders, there were 5199 Spaniards compared to 777 foreign nationals).26 In a sample of 456 files from the province of Jaen from 2000 to 2010, it was found that family breakdown and drug abuse were linked to reoffending.27,28 In the same province, with data from 2001 to 2010 of 654 minor offenders (568 males, mean age of 15.87 years), it was found that most of the minors consumed some type of substance, polyabuse being most common (32.2%), which was considered to be the combined consumption of 3 or more legal and/or illegal substances.29
The aim of this article was to study the annual series (from 2001 to 2012), year by year of the data on offences and the minors committing them in the province of Toledo (Spain).
The variables considered were the classification of the offence (damage, injury, misdemeanour of injury and theft) and whether it was committed in a group. With regard to the classification of minors, consideration was given to their background, gender and age, nationality and whether they were from a dysfunctional family. Consideration was also given to whether the minor was studying, their absenteeism and their years of school delay, and whether he or she had a diagnosis of mental health or drug abuse, consistent with the outpatient treatment measure provided under the Children's Act.21 As a consequence, the aim was to explore whether there was any longitudinal relationship over the years considered between acts of delinquency and the descriptive variables of the young offenders.
MethodologyProcedureThe first signatory, as a forensic psychologist, created a file in the Access database30 in 2001 to meet the recording needs of the technical team of the juvenile prosecutor's office in Toledo (Spain). The data analysed for this article reached 2012, and represented forensic acts that the technical team has been recording in this register as part of their daily work. These data were analysed using SPSS/21, studying the relationship between the variables and the years by means of the χ2 test for nominal data, paying attention to corrected typified residuals and using Spearman's coefficient correlation for ordinal data.31 Unless otherwise indicated, a significance level of .05 was used.
ParticipantsAs described in a previous article,2 the participants were minors attended between 10 April 2001 and 25 June 2012. Because in the province of Toledo there is only one technical team, one prosecutor's office and one juvenile court, the data in this register corresponds to all the minors in the province with a “reform file” (a file opened by the juvenile prosecutor when he or she sees signs of criminal conduct in a minor) because they have been involved in some offending conduct (misdemeanour or felony), and therefore are population data. There are a total of 6549 entries of forensic acts recorded by the technical team from 2001 to 2012. These entries of forensic acts correspond to 3333 juvenile offenders attended in person by the technical team in a first intervention during the period under study. It should be noted that the same minor could have been involved in several cases and several minors could have been involved in the same case. The same minor could also have been attended by the technical team several times, or comprise a new entry to the register without requiring a new summons by the team, in application of the principle of minimum intervention as enshrined by law.2,21
ResultsOffenceThe global data of entries in the register by the technical team year by year are shown in Fig. 1 (with a mean of 545.75 per year).

The technical team records the facts as they appear in the prosecutor's reform file because they have been qualified to do so by the relevant juvenile prosecutor in each case. Thus, 51.1% (3346) of the entries in the register correspond to offences committed in a group.2 Establishing 3 categories in the offending group (group of 2, 3 or 4 or more minors), the Spearman correlation coefficient was calculated between the years and the number of minors in the offending group, resulting in a significant value of .048 (p<.01), although with a very small absolute value.
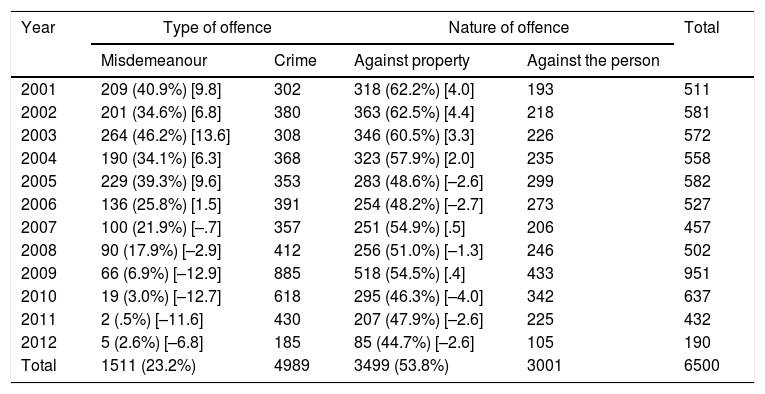
Regarding the type and nature of the crime, complementary distribution patterns are shown over the years. Thus, misdemeanours were over-represented from 2001 to 2005, as were offences against property in 2001 to 2004. However, from 2008 to 2012 the number of misdemeanours was significantly under-represented, as were property offences between 2010 and 2012, and earlier in 2005 and 2006 (Table 1).
Type and nature of offence.
| Year | Type of offence | Nature of offence | Total | ||
|---|---|---|---|---|---|
| Misdemeanour | Crime | Against property | Against the person | ||
| 2001 | 209 (40.9%) [9.8] | 302 | 318 (62.2%) [4.0] | 193 | 511 |
| 2002 | 201 (34.6%) [6.8] | 380 | 363 (62.5%) [4.4] | 218 | 581 |
| 2003 | 264 (46.2%) [13.6] | 308 | 346 (60.5%) [3.3] | 226 | 572 |
| 2004 | 190 (34.1%) [6.3] | 368 | 323 (57.9%) [2.0] | 235 | 558 |
| 2005 | 229 (39.3%) [9.6] | 353 | 283 (48.6%) [–2.6] | 299 | 582 |
| 2006 | 136 (25.8%) [1.5] | 391 | 254 (48.2%) [–2.7] | 273 | 527 |
| 2007 | 100 (21.9%) [–.7] | 357 | 251 (54.9%) [.5] | 206 | 457 |
| 2008 | 90 (17.9%) [–2.9] | 412 | 256 (51.0%) [–1.3] | 246 | 502 |
| 2009 | 66 (6.9%) [–12.9] | 885 | 518 (54.5%) [.4] | 433 | 951 |
| 2010 | 19 (3.0%) [–12.7] | 618 | 295 (46.3%) [–4.0] | 342 | 637 |
| 2011 | 2 (.5%) [–11.6] | 430 | 207 (47.9%) [–2.6] | 225 | 432 |
| 2012 | 5 (2.6%) [–6.8] | 185 | 85 (44.7%) [–2.6] | 105 | 190 |
| Total | 1511 (23.2%) | 4989 | 3499 (53.8%) | 3001 | 6500 |
Percentages of rows expressed in brackets and corrected residuals in square brackets.
χ2=890.116 (gl=11), p<.001 (type of offence).
χ2=87.855 (gl=11), p<.001 (nature of offence).
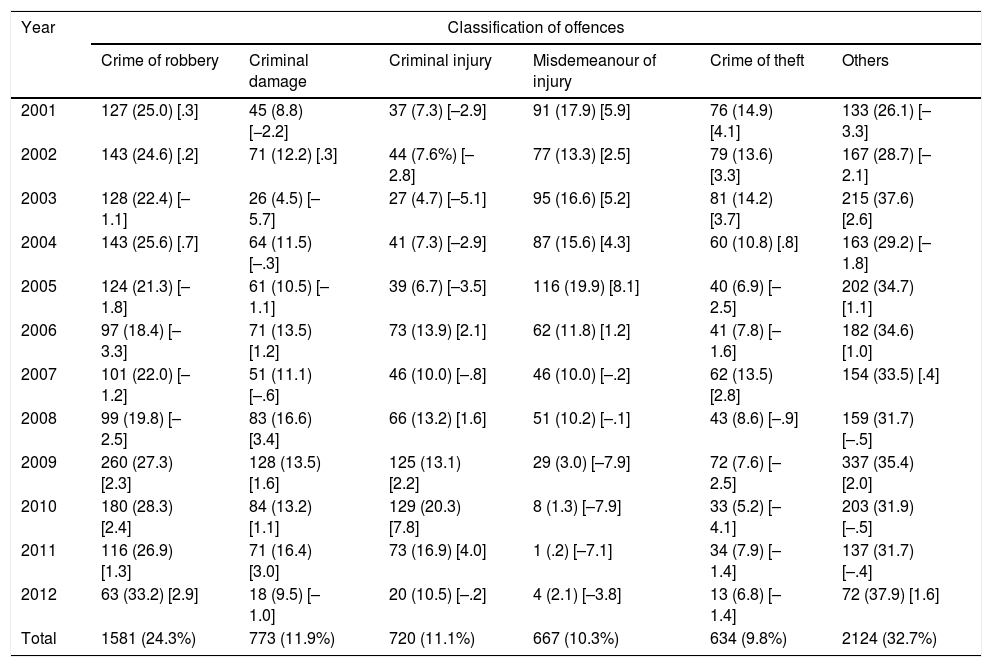
In the “Other” category of Table 2, heterogeneous offences were grouped ranging from criminal damage (the most numerous) to the crime of concealment, which only occurred on one occasion.
Offences.
| Year | Classification of offences | |||||
|---|---|---|---|---|---|---|
| Crime of robbery | Criminal damage | Criminal injury | Misdemeanour of injury | Crime of theft | Others | |
| 2001 | 127 (25.0) [.3] | 45 (8.8) [−2.2] | 37 (7.3) [–2.9] | 91 (17.9) [5.9] | 76 (14.9) [4.1] | 133 (26.1) [–3.3] |
| 2002 | 143 (24.6) [.2] | 71 (12.2) [.3] | 44 (7.6%) [–2.8] | 77 (13.3) [2.5] | 79 (13.6) [3.3] | 167 (28.7) [–2.1] |
| 2003 | 128 (22.4) [–1.1] | 26 (4.5) [–5.7] | 27 (4.7) [–5.1] | 95 (16.6) [5.2] | 81 (14.2) [3.7] | 215 (37.6) [2.6] |
| 2004 | 143 (25.6) [.7] | 64 (11.5) [–.3] | 41 (7.3) [–2.9] | 87 (15.6) [4.3] | 60 (10.8) [.8] | 163 (29.2) [–1.8] |
| 2005 | 124 (21.3) [–1.8] | 61 (10.5) [–1.1] | 39 (6.7) [–3.5] | 116 (19.9) [8.1] | 40 (6.9) [–2.5] | 202 (34.7) [1.1] |
| 2006 | 97 (18.4) [–3.3] | 71 (13.5) [1.2] | 73 (13.9) [2.1] | 62 (11.8) [1.2] | 41 (7.8) [–1.6] | 182 (34.6) [1.0] |
| 2007 | 101 (22.0) [–1.2] | 51 (11.1) [–.6] | 46 (10.0) [–.8] | 46 (10.0) [–.2] | 62 (13.5) [2.8] | 154 (33.5) [.4] |
| 2008 | 99 (19.8) [–2.5] | 83 (16.6) [3.4] | 66 (13.2) [1.6] | 51 (10.2) [–.1] | 43 (8.6) [–.9] | 159 (31.7) [–.5] |
| 2009 | 260 (27.3) [2.3] | 128 (13.5) [1.6] | 125 (13.1) [2.2] | 29 (3.0) [–7.9] | 72 (7.6) [–2.5] | 337 (35.4) [2.0] |
| 2010 | 180 (28.3) [2.4] | 84 (13.2) [1.1] | 129 (20.3) [7.8] | 8 (1.3) [–7.9] | 33 (5.2) [–4.1] | 203 (31.9) [–.5] |
| 2011 | 116 (26.9) [1.3] | 71 (16.4) [3.0] | 73 (16.9) [4.0] | 1 (.2) [–7.1] | 34 (7.9) [–1.4] | 137 (31.7) [–.4] |
| 2012 | 63 (33.2) [2.9] | 18 (9.5) [–1.0] | 20 (10.5) [–.2] | 4 (2.1) [–3.8] | 13 (6.8) [–1.4] | 72 (37.9) [1.6] |
| Total | 1581 (24.3%) | 773 (11.9%) | 720 (11.1%) | 667 (10.3%) | 634 (9.8%) | 2124 (32.7%) |
Percentages in rows expressed in brackets and corrected residuals in square brackets.
χ2=577.737 (gl=55); p<.001.
The crime of robbery was under-represented in 2006 and 2008, while in 2010 and 2012 it was significantly higher. Criminal injury was under-represented in the first years of the series (2001–2005), whereas the opposite occurred in 2009–2011. Criminal damage was under-represented in 2001 and 2003, whereas in 2008 and 2011 it was the opposite. Misdemeanour of injury was more frequent in the first years of the series (2001–2005), changing the trend from 2009 to the end of the series. The crime of theft accumulated more cases in the first years of the series, until 2003 and in 2007.
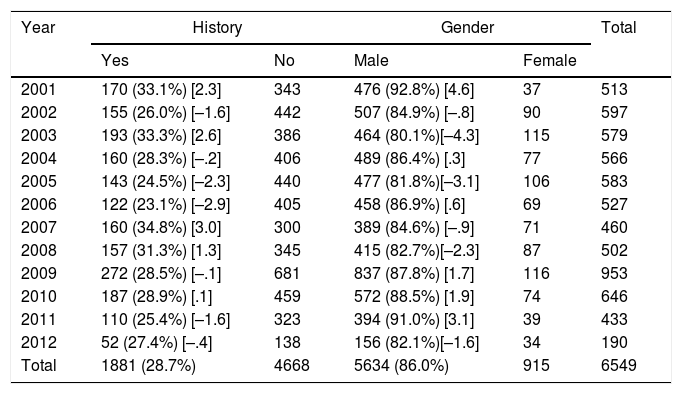
MinorsAs Table 3 shows, the overwhelming majority of the juvenile offenders were males (86%). It could be said that despite the few girls, a significantly higher number of female offenders were recorded in 2003, 2005 and 2008.
History and gender.
| Year | History | Gender | Total | ||
|---|---|---|---|---|---|
| Yes | No | Male | Female | ||
| 2001 | 170 (33.1%) [2.3] | 343 | 476 (92.8%) [4.6] | 37 | 513 |
| 2002 | 155 (26.0%) [–1.6] | 442 | 507 (84.9%) [–.8] | 90 | 597 |
| 2003 | 193 (33.3%) [2.6] | 386 | 464 (80.1%)[–4.3] | 115 | 579 |
| 2004 | 160 (28.3%) [–.2] | 406 | 489 (86.4%) [.3] | 77 | 566 |
| 2005 | 143 (24.5%) [–2.3] | 440 | 477 (81.8%)[–3.1] | 106 | 583 |
| 2006 | 122 (23.1%) [–2.9] | 405 | 458 (86.9%) [.6] | 69 | 527 |
| 2007 | 160 (34.8%) [3.0] | 300 | 389 (84.6%) [–.9] | 71 | 460 |
| 2008 | 157 (31.3%) [1.3] | 345 | 415 (82.7%)[–2.3] | 87 | 502 |
| 2009 | 272 (28.5%) [–.1] | 681 | 837 (87.8%) [1.7] | 116 | 953 |
| 2010 | 187 (28.9%) [.1] | 459 | 572 (88.5%) [1.9] | 74 | 646 |
| 2011 | 110 (25.4%) [–1.6] | 323 | 394 (91.0%) [3.1] | 39 | 433 |
| 2012 | 52 (27.4%) [–.4] | 138 | 156 (82.1%)[–1.6] | 34 | 190 |
| Total | 1881 (28.7%) | 4668 | 5634 (86.0%) | 915 | 6549 |
Percentages in rows expressed in brackets and corrected residuals in square brackets.
χ2=38.559 (gl=11), p<.001 (history).
χ2=68.632 (gl=11), p<.001 (gender).
As explained in a previous study with the same data considered globally without differentiating by the different years,2 it was coded as a history when consultation of the register showed that the technical team of the Public Prosecutor's Office of Toledo had already had some previous intervention with the juvenile offender.2 Obviously if the minor had passed through a different technical team from another province “it will not be recorded in the register of Toledo's technical team, therefore their entry will be recorded as having no history. Consequently data of a history are under-estimated with respect to any history that might have been recorded in any other province” (p. 100).2 Thus, only 28.7% of the records show any history with the technical team of Toledo. In 2001, 2003 and 2007 there was a significant disproportion of records with a history. By contrast, in 2005 and 2006 records with a history were under-represented.
In the analysis of age throughout the series, it should be noted that this was not recorded systematically until 2004.2 Spearman's correlation coefficient was calculated (.126; p<.01) indicating that the minors tended to be older in the final years of the time series considered.
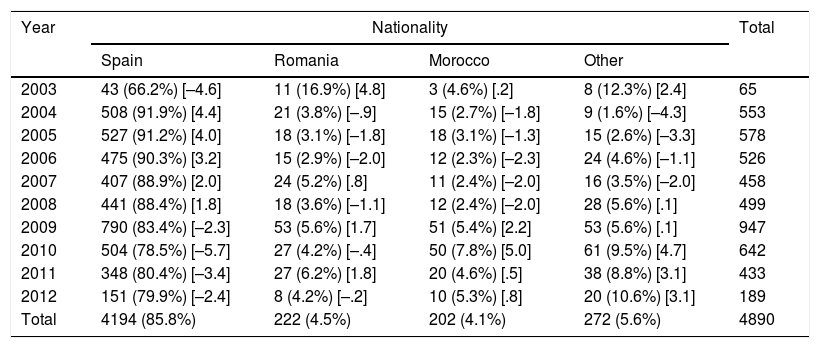
The same occurred in the case of nationality (Table 4). It only began to be registered in 2003 in a non-systematic manner. This is why the annual series begins in that year with such a low total (65).
Nationality.
| Year | Nationality | Total | |||
|---|---|---|---|---|---|
| Spain | Romania | Morocco | Other | ||
| 2003 | 43 (66.2%) [–4.6] | 11 (16.9%) [4.8] | 3 (4.6%) [.2] | 8 (12.3%) [2.4] | 65 |
| 2004 | 508 (91.9%) [4.4] | 21 (3.8%) [–.9] | 15 (2.7%) [–1.8] | 9 (1.6%) [–4.3] | 553 |
| 2005 | 527 (91.2%) [4.0] | 18 (3.1%) [–1.8] | 18 (3.1%) [–1.3] | 15 (2.6%) [–3.3] | 578 |
| 2006 | 475 (90.3%) [3.2] | 15 (2.9%) [–2.0] | 12 (2.3%) [–2.3] | 24 (4.6%) [–1.1] | 526 |
| 2007 | 407 (88.9%) [2.0] | 24 (5.2%) [.8] | 11 (2.4%) [–2.0] | 16 (3.5%) [–2.0] | 458 |
| 2008 | 441 (88.4%) [1.8] | 18 (3.6%) [–1.1] | 12 (2.4%) [–2.0] | 28 (5.6%) [.1] | 499 |
| 2009 | 790 (83.4%) [–2.3] | 53 (5.6%) [1.7] | 51 (5.4%) [2.2] | 53 (5.6%) [.1] | 947 |
| 2010 | 504 (78.5%) [–5.7] | 27 (4.2%) [–.4] | 50 (7.8%) [5.0] | 61 (9.5%) [4.7] | 642 |
| 2011 | 348 (80.4%) [–3.4] | 27 (6.2%) [1.8] | 20 (4.6%) [.5] | 38 (8.8%) [3.1] | 433 |
| 2012 | 151 (79.9%) [–2.4] | 8 (4.2%) [–.2] | 10 (5.3%) [.8] | 20 (10.6%) [3.1] | 189 |
| Total | 4194 (85.8%) | 222 (4.5%) | 202 (4.1%) | 272 (5.6%) | 4890 |
Percentages in rows expressed in brackets and corrected residuals in square brackets.
χ2=161.027 (gl=27); p<.001.
As Table 4 shows, 85.8% of the total entries in the register correspond to offending minors of Spanish nationality. Minors of Spanish nationality were over-represented from 2004 to 2007. However, in 2003 and from 2009 to 2012, the trend was the opposite.
Minors of Romanian nationality were over-represented in 2003, and in 2006 it was the opposite.
Only in 2009 and 2010 were there a significant number of minors of Moroccan nationality, which indicated over-representation. However, from 2006 to 2008 their number was under-represented.
With respect to the other nationalities, in 2004, 2005 and 2007 they were under-represented, while in 2003 and from 2010 to 2012 the trend reversed.
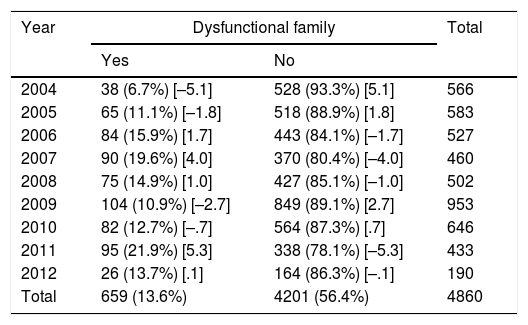
On reading the data on dysfunctional families shown in Table 5, the first thing to mention is that the technical team started to systematically gather this data from 2004 onwards, and therefore the table shows the annual series from that year. The technical team use conservative criteria when registering a family as dysfunctional, so that if there is any doubt, or if the team considers that the family is still functional, it is registered as not dysfunctional. Thus, 13.6% of the families were noted as dysfunctional. Examining the annual series, fewer dysfunctional families were classified in 2004 and 2009, while dysfunctional families were more highly represented in 2011 than would be statistically expected.
Dysfunctional family.
| Year | Dysfunctional family | Total | |
|---|---|---|---|
| Yes | No | ||
| 2004 | 38 (6.7%) [–5.1] | 528 (93.3%) [5.1] | 566 |
| 2005 | 65 (11.1%) [–1.8] | 518 (88.9%) [1.8] | 583 |
| 2006 | 84 (15.9%) [1.7] | 443 (84.1%) [–1.7] | 527 |
| 2007 | 90 (19.6%) [4.0] | 370 (80.4%) [–4.0] | 460 |
| 2008 | 75 (14.9%) [1.0] | 427 (85.1%) [–1.0] | 502 |
| 2009 | 104 (10.9%) [–2.7] | 849 (89.1%) [2.7] | 953 |
| 2010 | 82 (12.7%) [–.7] | 564 (87.3%) [.7] | 646 |
| 2011 | 95 (21.9%) [5.3] | 338 (78.1%) [–5.3] | 433 |
| 2012 | 26 (13.7%) [.1] | 164 (86.3%) [–.1] | 190 |
| Total | 659 (13.6%) | 4201 (56.4%) | 4860 |
Percentages in rows expressed in brackets and corrected residuals in square brackets.
χ2=75.094 (gl=8); p<.001.
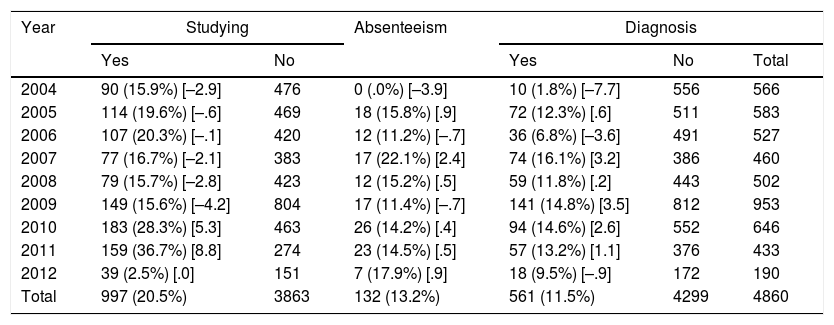
Starting in 2004, data were collected on any diagnosis of mental health or drug abuse among the minors. It is coded in this way, grouping together both mental health and drug use, because both guide the outpatient treatment measure that the technical team might recommend in their forensic report and oral confirmation before the juvenile court. In order for these to be registered in this way the technical team adopts very conservative criteria, and therefore only when a diagnosis is very salient, or there is documentary evidence of such a diagnosis, is it reflected in the register.2 As Table 6 shows, in 2004 and 2006 fewer minors were registered with a diagnosis, and in 2007, 2009 and 2010 minors with a diagnosis were significantly over-represented.
Studies and diagnosis at the time of the offence.
| Year | Studying | Absenteeism | Diagnosis | |||
|---|---|---|---|---|---|---|
| Yes | No | Yes | No | Total | ||
| 2004 | 90 (15.9%) [–2.9] | 476 | 0 (.0%) [–3.9] | 10 (1.8%) [–7.7] | 556 | 566 |
| 2005 | 114 (19.6%) [–.6] | 469 | 18 (15.8%) [.9] | 72 (12.3%) [.6] | 511 | 583 |
| 2006 | 107 (20.3%) [–.1] | 420 | 12 (11.2%) [–.7] | 36 (6.8%) [–3.6] | 491 | 527 |
| 2007 | 77 (16.7%) [–2.1] | 383 | 17 (22.1%) [2.4] | 74 (16.1%) [3.2] | 386 | 460 |
| 2008 | 79 (15.7%) [–2.8] | 423 | 12 (15.2%) [.5] | 59 (11.8%) [.2] | 443 | 502 |
| 2009 | 149 (15.6%) [–4.2] | 804 | 17 (11.4%) [–.7] | 141 (14.8%) [3.5] | 812 | 953 |
| 2010 | 183 (28.3%) [5.3] | 463 | 26 (14.2%) [.4] | 94 (14.6%) [2.6] | 552 | 646 |
| 2011 | 159 (36.7%) [8.8] | 274 | 23 (14.5%) [.5] | 57 (13.2%) [1.1] | 376 | 433 |
| 2012 | 39 (2.5%) [.0] | 151 | 7 (17.9%) [.9] | 18 (9.5%) [–.9] | 172 | 190 |
| Total | 997 (20.5%) | 3863 | 132 (13.2%) | 561 (11.5%) | 4299 | 4860 |
Percentages in rows expressed in brackets and corrected residuals in square brackets.
χ2=91.641 (gl=8); p<.001 (diagnosis).
χ2=126.626 (gl=8); p<.001 (studying).
χ2=21.804 (gl=8); p=.005 (absenteeism).
Table 6 shows how in 2004, and from 2007 to 2009, young offenders who were studying were fewer than one would expect under the hypothesis of independence, whereas only in 2010 and 2011 did the opposite occur. Of those who were studying, 13.2% had absenteeism. Examining the annual series it could be said that there was less absenteeism in 2004 and there was more in 2007. It should be noted here that in this category the technical team also uses very conservative criteria when recording absenteeism.
Considering under primary education both the minors who were illiterate, and those whose last academic year was in primary education, grouping all minors whose last academic year was one for which it is required to have completed secondary education: baccalaureate, intermediate, higher and university degree; and considering the number of minors in each year of secondary education (from 1st to 4th) Spearman's correlation coefficient (.020) was calculated between the variables year and last academic year completed by the minors, resulting as non-significant.
With respect to the minors’ years of school delay, the technical team also follows very conservative criteria with regard to recording, so that if there is any doubt, the minimum option of school delay is always recorded. In this way, even if the minor was not studying, if when he dropped out of school he did so in the year corresponding to his age, it is recorded as no school delay. Considering the categories of no school delay, one year delay, 2 years’ delay and 3 or more years’ delay in school, a Spearman's correlation coefficient was obtained of -.003 without being significant.
ConclusionsData collection and research are essential for the periodic assessment of the practical functioning of juvenile justice systems.3,4,10,21
Summarising the results obtained in our study we can state that there was an increase in the number of juvenile offenders in 2009, which coincides with the national data provided by Montero-Herranz.3 In recent years, there has been a tendency for criminal acts to be more serious (an increase in the number of offences compared to misdemeanours), with an increase in crimes against the person (a reverse of the trend of crime and misdemeanour leading to injury) committed each year by older children.3 In part it is probably a reflection of the decisions of the Public Prosecutor's Office to file in cases of increasing seriousness and refer more misdemeanours for extrajudicial solutions, in compliance with the principle of minimum intervention of LO 5/0021 and the recommendations of the United Nations4 on the rights of the child in juvenile justice. In any case, future studies will have to go into this aspect in depth providing empirical evidence to build on this explanation.18 In terms of gender, and although boys always constitute the vast majority every year, a gradual increase in the number of girls is observed, although there is no regular pattern over the years studied, going from 7.2% in 2001 to 18% in 2012,2,30,32,33 similar to that found by Montero-Herranz,3 with global data from Spain going from 2051 (15.05% of those convicted) girls convicted in 2007 to 2828 (17.49% of those convicted) in 2012. These increases in the proportion of female offenders would coincide with that obtained in the study by the Regional Government of Andalusia between 2007 and 2010.26 In terms of schooling, there has been an increase in the number of minors studying in recent years, probably linked to the financial crisis that has closed the labour market to many young people and reduced to zero the employment expectations of those not yet working.34–36 Due to the importance of schooling in the delinquent behaviour of adolescents, future studies should study this aspect in more depth.5,6,19,20,25,27,28
In another order of things, analysis of the data on the “treatment” variable that represents a diagnosis of mental health or drug abuse indicates to us that many juvenile offenders do not enter the juvenile justice system with a diagnosis in a number compatible with that suggested in the various studies reviewed. Only 11.5% of the entries in the register of the technical team include a diagnosis, which would be consistent in terms of a diagnosis of mental health with that found recently in a sample of minors accused in the juvenile court of Almeria (12.6%) but not with that reported in this same study with respect to minors who use drugs (36.7%).20 Along these same lines, in the reviewed data of 654 minors in the province of Jaen, 6% were cannabis users and 32.2% polyconsumers.29 On the other hand, both the White Paper on Child and Adolescent Psychiatry, which puts minors with an emotional development or behavioural problem at around 20% of the general population, and those with a mental health problem at 12.5%,16 and the international studies on juvenile offenders that raise the cases of mental health or drug problems to 70%,1,11,12,14,15 would indicate that in our population there must be a higher percentage of diagnoses than those detected by the system. In the same vein are the figures provided by the recent article published in this same journal,10 which, using a sample of minors admitted to a specialised treatment unit (mental health and drug addiction) for juvenile offenders found that 65.3% had an axis I disorder, and 78.5% were toxic substance users. However, the sample used comprised minors already admitted to a specialist therapeutic internment facility, and therefore high data were to be expected. In this regard, the data presented in this paper represent an earlier stage, since they represent the initial assessment of the juvenile justice system of the entire offending population of a province (Toledo). However all this empirical data should make us reflect on the adequacy of the assessments of the technical teams dealing with juvenile offenders within Spain's juvenile justice system.
It is likely, due to the dynamics of the technical team's work in which the normality (in terms of mental health and alcohol and drug use) of underage offenders is taken as the starting point, together with care pressure and the need for the technical team's actions and forensic reports to stigmatise as little as possible, that many minors have gone through the system without an appropriate diagnosis (of mental health or drug dependence). The work of the technical team taking place in this context means that diagnostic tools have not been used systematically in this population. For this reason, it is suggested that this perspective of normalising by the technical team should be rethought to be more specific in the detection and diagnosis of mental health and drug addiction problems that young offenders might have and that might have previously gone unnoticed by the health and social services system. Consequently, the data seem to indicate that there is a failure of the system as a whole (mental health, social services and juvenile justice system) in diagnosing juvenile offenders in our population.20,37 Therefore, it is recommended that future research studies should aim to quantify the rate of mental illness and drug dependence in this population by the systematic diagnosis of samples of juvenile offenders. If these studies confirm that young offenders are under-diagnosed in terms of mental health and drug dependence, the best setting for such a diagnosis must be explored. The forensic action of the technical team does not seem to be the appropriate clinical context, and neither does LO 5/0021 make such a provision. Consequently, the technical team do not include clinical diagnosis as one of their functions, but the data appear to indicate that the health and social services system are not quantitatively diagnosing a percentage of cases consistent with the data provided in the studies reviewed, so that these cases reach the juvenile justice system without an adequate diagnosis. The juvenile justice system is also subsequently failing to detect minors who require an addiction or mental health diagnosis for them to be referred to the health system, recommending outpatient treatment so that a diagnosis can be made with sufficient time and resources, and neither is it making diagnoses within its sphere of action. As a consequence, juvenile offenders will not properly benefit from the measures provided for in legislation,2,20,21 therapeutic measures in particular. Therefore it can be assumed that the measures imposed by the juvenile justice system will not be effective in such cases, and this compromises meeting the objectives of the measure imposed in the sentence (which is an obligation placed on juvenile judges under the law)2 and, ultimately, compromises the process itself of resocialising minors who have not been property diagnosed. Therefore it is in the interest of the juvenile justice system and society as a whole to investigate this aspect to improve the level that the objectives of the juvenile offender measures are being met, which will benefit minors and society.
All the conclusions of this article should be taken with caution, since the register that has served as its source was not designed for research, but rather to manage the forensic actions of the technical team. Another significant limitation, in part derived from the above, is that the minors were not followed up over the long period studied. The purely quantitative nature of the study also invites the design of qualitative studies that allow for further research into the issues raised in this article. It is hoped that future research studies will be able to overcome these limitations.
In this regard, and although the results set out here are subject to the above limitations, the authors suggest a proposal for improvement for the technical team of Toledo(Spain) which could serve as a pilot study for potential generalisation. The systematic introduction to the working routine of the technical team of a questionnaire or semi-structured interview on mental health and drug use would constitute such an improvement.
Conflict of interestsThe authors have no conflict of interests to declare, apart from the first signatory, in their capacity as a member of the technical team of the Public Prosecutor's Office and the juvenile court of Toledo when the data were collected.
The first author (M.A. A-C) would like to thank the Ministry of Education, Culture and Sport of the Spanish Government for granting a José Castillejo mobility stay abroad for young doctors 2017 (CAS17/00312) in the Monash Institute of Cognitive and Clinical Neurosciences (MICCN) of Monash University (Melbourne, Australia) where this article was concluded.
Please cite this article as: Alcázar-Córcoles MÁ, Bouso-Saiz JC, Revuelta J, Hidalgo Rasmussen CA, Ramírez Lira E, Calderón-Guerrero C. Los delincuentes juveniles en Toledo (España) desde el año 2001 a 2012: características psicosociales, educativas y delictivas. Rev Esp Med Legal. 2019;45:98–107.