


The aim of the present study was to determine the prevalence of excess weight and analyze eating habits in relation to cardiovascular disease in adolescents from the city of Vitória de Santo Antão, state of Pernambuco, northeast Brazil.
MethodsA cross-sectional study was carried out with male and female students (10–19 years old) enrolled at public and private schools in Vitória de Santo Antão. Sociodemographic, anthropometric and lifestyle variables were collected. Food consumption was evaluated using a Food Frequency Questionnaire and subsequently converted to monthly intake pattern scores, obtaining the intake distribution for a group of foods associated with the risk of developing cardiovascular disease and for a group of protective foods. The significance level for the statistical tests was set at 5.0%.
ResultsThe sample consisted of 2866 students. The female gender accounted for 54.2% of the sample, and median age was 14 years (interquartile range: 12–16 years). The food intake scores showed greater dispersion in the group of protective foods (51.1%). Higher median scores for consumption of risk foods were found among adolescents whose mothers had more than 9 years of schooling (p<0.001).
ConclusionsExcess weight was prevalent among the students analyzed. The consumption of risk foods was only associated with maternal schooling, which shows the need for nutritional interventions directed at families, regardless of socioeconomic status.
Determinar a prevalência de excesso de peso e analisar o consumo alimentar de risco e proteção para doenças cardiovasculares em adolescentes escolares da cidade de Vitória de Santo Antão, Pernambuco, Brasil.
MétodosEstudo transversal com adolescentes de ambos os sexos entre 10 e 19 anos, matriculados em 39 escolas públicas e privadas de Vitória de Santo Antão (PE). Foram obtidas variáveis sociodemográficas, antropométricas e do estilo de vida. O consumo alimentar foi avaliado por meio de questionário de frequência alimentar e posteriormente convertido em escores de padrão de consumo mensal. Obtiveram-se a distribuição de consumo para um grupo de alimentos associados ao risco de desenvolvimento de doenças cardiovasculares (Grupo Risco) e um grupo de alimentos protetores (Grupo Proteção). O nível de significância usado na decisão dos testes estatísticos foi de 5%.
ResultadosA amostra foi constituída por 2.866 escolares; 54,2% do sexo feminino, com idade mediana de 14 anos (Intervalo Interquartílico=12–16). A análise dos escores de consumo alimentar mostrou maior dispersão no grupo de alimentos protetores (51,1%) e maiores medianas de consumo de alimentos de risco nos adolescentes com mães de escolaridade >9 anos (p<0,001).
ConclusõesO excesso de peso foi frequente nos adolescentes estudados. Os escores de consumo alimentar do grupo risco revelaram associação apenas com a escolaridade materna e evidenciaram a necessidade de maior conhecimento de educação nutricional as famílias, independentemente das condições socioeconômicas.
In recent years, Brazil has experienced a significant change in the eating patterns of the population, a phenomenon that is part of the nutritional transition context, with a significant increase in the prevalence of overweight and obesity.1
It is a fact of concern that excess weight affects individuals since early ages, especially in adolescence. Data from the Household Budget Survey (POF – Pesquisa de Orçamento Familiar) by the Brazilian Institute of Geography and Statistics – IBGE show that between 1974–1975 and 2008–2009, the prevalence of overweight among adolescents increased from 11.3% to 20.5%, and the obesity rate increased from 1.1% to 4.9%.2,3
Due to this change in the nutritional pattern, assessment of food consumption in adolescence has received attention, particularly considering propositions that associate inadequate eating habits in childhood and adolescence to the development of chronic diseases in adulthood, especially cardiovascular diseases.4
In spite of the existing information on the prevalence of overweight and obesity in different age groups, data from Northeast Brazil adolescents are still scarce and more research is needed outside the metropolitan area, where the behavior of adolescents occurs in a differentiated manner. Additionally, analysis of the eating habits of this population group allows the identification of dietary factors associated with the genesis of excess weight, with the possibility of creating interventions and public policies for control and prevention of obesity and associated diseases. Therefore, the aim of this study was to determine the prevalence of overweight and analyze risk and protective food consumption for cardiovascular disease (CVD) among adolescent students in the city of Vitória de Santo Antão, state of Pernambuco, in northeast Brazil.
MethodThis was a cross-sectional study with adolescents of both genders, aged between 10 and 19 years, enrolled in public and private schools of Vitória de Santo Antão, Pernambuco, from April 2010 to August 2011. The adolescents present at the time of enrollment were eligible for the study, and we excluded those who had/reported mental health problem (reported by parents or school teachers), physical problem (due to the impossibility of obtaining anthropometric measurements), consumptive diseases, pregnancy or use of drugs that interfered with glucose or lipid metabolism and/or blood pressure levels.
Sample size was estimated using the SampleXS program (Brixton Health, Brixton UKI2, UK) using the formula: n=A/[E*E+(A/N)], where n=sample size; A=3.8416PQW; P=prevalence of the population in percentage; Q=(100−P); E=maximum acceptable sample error; w=likely effect of design; N=population size. For the calculation, an estimated prevalence of metabolic syndrome of 3.0% was taken as reference,5 as it was calculated by a previous research project entitled “Profile of Metabolic Syndrome and Apolipoproteins in School Adolescents with Excess Weight in the Municipality of Vitoria de Santo Antao, Pernambuco”, which has excess weight as one of the outcome variables. The reference population consisted of 21,515 adolescents enrolled in the schools; confidence level of 95%, sampling error of 1% and effect of design of 2.5 were used. The minimum sample size was 2473 students. To correct any losses or refusals, identified in the pilot study, this amount was increased by 15%, and thus the final sample consisted of 2844 students.
For sample selection, we identified the total number of public (n=31) and private (n=8) schools, which offered classes from the 6th grade of Elementary School and/or High School in the municipality of Vitória de Santo Antão, in 2009. In order to obtain the required proportionality in a stratified sample, schools were organized by grades as urban public, rural public and private and randomly selected using the Randomizer program (Social Psychology Network Association, Middletown, CT, USA). The grades were defined as the study conglomerates, considering a maximum of 40 students per class.
Data were collected by nursing and nutrition professionals and students at the Federal University of Pernambuco. The entire staff was appropriately trained and monitored by the project coordinators and the study was carried out only after approval by the Institutional Review Board of the Health Sciences Center of Universidade Federal de Pernambuco (CEP/CCS/UFPE), according with Resolution 196/96 of the National Health Council-Brazil, under protocol n. 262/2009. The parents/guardians of the students received information about the project, its objectives and the procedures to be performed and signed the informed consent form.
Demographic and socioeconomic data of the participants were obtained following the recommendations of the Brazilian Institute of Geography and Statistics (IBGE),6 with the socioeconomic class classified according to Brazilian Association of Research Companies [Associação Brasileira de Empresas de Pesquisa]-ABEP,7 which divides socioeconomic classes into categories from A to E.
Weight and height were measured according to the technique recommended by Lohman et al.,8 using a Balmak® scale with capacity of up to 150kg and 100g precision, calibrated and tested by the National Institute of Metrology, Standardization and Industrial Quality [Instituto Nacional de Metrologia, Normalização e Qualidade Industrial – INMETRO] of Pernambuco. Height was measured with a stadiometer attached to the scale with a precision of 1mm and accuracy of 0.5cm.
Body mass index (BMI) was classified in percentiles according to gender and age group.9 Those with BMI<85 percentile were considered individuals without excess weight, and those with BMI≥85 percentile were classified as having excess weight (including overweight and obesity).
Waist (WC) and neck (NC) circumference measurements were obtained according to the techniques proposed by Sarah et al.10 and Olubukola et al.11 These procedures were performed using a Sanny® inelastic measuring tape in duplicate, with a maximum variation of 0.1cm between the two measurements, which were repeated if this variation was exceeded. The cutoffs used for the NC analysis were those proposed by Hingorjo et al.,12 adapted for adolescents, which define as having excess weight individuals with NC>35.5cm and NC>32cm for males and females, respectively. For WC, the cutoffs used were those recommended by the International Diabetes Federation,13 which identifies abdominal obesity as WC≥P90. With the measures of WC and height it was possible to calculate the waist/height ratio (WHtR), establishing as cutoff for abdominal obesity values ≥0.5.14,15
To determine the level of physical activity, we used the International Physical Activity Questionnaire-IPAQ,16 being categorized as “physically active” those subjects who reported participating in at least 60min of moderate to vigorous physical activities for five or more days a week, and as “insufficiently active” the other adolescents.
Regarding smoking and alcohol consumption, we used the version for students, translated into Portuguese, of the questionnaire proposed by the Centers for Disease Control and Prevention in its annual survey.17 Smokers were those individuals who reported they smoked at least once a week or daily in the last month, and former smokers who, at the time of the interview, were nonsmokers, but had been in the past. Alcohol use was inferred based on alcohol intake in the last 72h and the last 30 days, with risk consumption representing the intake of five doses of alcoholic beverages within a 2-h period, at least once in the last 30 days and the sensation of being drunk at least once at the same time interval.
This study assessed the consumption of risk and protective foods for CVD. For that purpose, 30 foods or food preparations were recorded through the Food Frequency Questionnaire (FFQ) and classified into five categories of frequency of consumption: F1=never; F2=less than once/week; F3=once or twice/week; F4=three to four times/week and F5=five or more times/week.
For the frequency of consumption to be treated as a quantitative variable, we used the model of the scores proposed by Fornes et al.,18 with conversion of the categories into monthly consumption frequency, assigning a weight (S) to each category of frequency. Maximum weight was defined as S5=1 for daily consumption, and the others were calculated using the equation: Sn=(1/30) [a+b/2] (with a and b being the number of days of the frequency).
Therefore, the consumption frequency scores were obtained for two food groups:
- 1
Risk group (consisting of risk foods for CVD): fatty and cured meats, viscera, poultry with skin, whole milk and its products, canned food and cold meats, soft drinks, fried foods and fast foods (chips, burgers, French fries, hot dogs and pizza), artificial juice and desserts (chocolate, sweets, cakes and ice cream).
- 2
Protective group (including protective foods or those not considered a risk for CVD): cereals and cereal products (rice, bread, couscous, noodles), tubers, legumes, fish, fruits and salads.
The frequency score of each group was obtained by adding the weight of each item. The food consumption model was subsequently assessed based on socioeconomic, anthropometric and lifestyle variables.
The tabulation of the data was performed using Epidata program, release 3.1 (EpiData Association, Odense, DK). In order to detect errors, data entry was repeated, and using the comparison function for duplicate files, validate, typing errors were detected and corrected. Data were analyzed with Statistical Package for the Social Sciences, release 13.0. (SPSS, Inc., Chicago, IL, USA). When describing proportions, an approximation of the binomial distribution to normal distribution was performed using the confidence interval (95% CI). Pearson's chi-square test was used in the comparison of proportions. As the food consumption frequency scores showed ordinal scale measurements, they were described as median and their respective interquartile range (IQR). The association of consumption with explanatory variables was performed using Mann–Whitney U test. Significance level for the statistical tests was set at 5.0%.
ResultsOf the 2994 eligible students, 128 adolescents were excluded for refusing to participate or due to technical difficulties in collecting anthropometric data.
The final sample consisted of 2866 students, of which 54.2% were females, with a median age of 14 years (IQR: 12–16). The prevalence of overweight was 11.0% (95% CI: 9.8–12.2), whereas obesity was 6.8% (95% CI: 5.9–7.8), according to BMI. According to the WC and WHtR criteria, 4.2% (95% CI: 3.5–5) and 11.4% (95% CI: 10.2–12.5) of the adolescents had abdominal obesity, respectively. As for the NC, the prevalence of overweight was more important, with 30.1% (95% CI: 28.4–31.8) of the adolescents being diagnosed with excess weight (Table 1).
Prevalence of excess weight and abdominal obesity, according to gender and anthropometric variables of adolescent students. Vitória de Santo Antão, Pernambuco, Brazil 2012.
| Nutritional status | Gender | p-value | |||||
|---|---|---|---|---|---|---|---|
| Male 1312 (45.8%) | Female 1554 (54.2%) | Total | |||||
| n (%) | 95% CI | n (%) | 95% CI | n (%) | 95% CI | ||
| BMIa | |||||||
| With excess weight | 231 (17.6) | 15.5–19.7 | 279 (18.0) | 16.0–19.9 | 510 (17.8) | 16.4–19.2 | 0.80 |
| Without excess weight | 1081 (82.4) | 80.2–84.4 | 1.275 (82.0) | 80.0–83.9 | 2.356 (82.2) | 80.7–83.5 | |
| WCb | |||||||
| Abdominal obesity | 58 (4.4) | 3.3–5.6 | 63 (4.1) | 3.1–5.1 | 121 (4.2) | 3.5–5.0 | 0.62 |
| Normal weight | 1.254 (95.6) | 94.3–96.6 | 1.491 (95.9) | 94.8–96.8 | 2.745 (95.8) | 94.9–96.4 | |
| WHtRc | 0.74 | ||||||
| Abdominal obesity | 152 (11.6) | 9.9–13.4 | 174 (11.2) | 9.6–12.8 | 326 (11.4) | 10.2–12.5 | |
| Normal weight | 1.160 (88.4) | 86.5–90.0 | 1.380 (88.8) | 87.1–90.3 | 2.540 (88.6) | 87.4–89.7 | |
| NCd | <0.001 | ||||||
| Excess weight | 522 (40.8) | 38.1–43.5 | 319 (21.0) | 19–23.2 | 841 (30.1) | 28.4–31.8 | |
| Normal weight | 757 (59.2) | 56.4–61.9 | 1.197 (79.0) | 76.8–81 | 1.954 (69.9) | 68.2–71.6 | |
BMI, body mass index; 95% CI, confidence interval; WC, waist circumference; WHtR, waist/height ratio; NC, neck circumference.
Regarding the food consumption scores, food consumption medians for the risk and protective groups were similar (p=0.271) (Fig. 1). However, the analysis of the interquartile coefficient of variation (ICV) showed a greater dispersion in the group of protective foods (ICV=51.1%) compared to risk food group (ICV=30.5%).
 for risk group=30.5%; CIQR for protective group=51.1%.")
The data concerning the association between scores of food consumption and socioeconomic, anthropometric and lifestyle variables are shown in Tables 2 and 3. A significant association was observed between risk food consumption and maternal schooling, as higher medians in the risk group were observed among teenagers whose mothers had higher schooling (>9 years) (p<0.001). The distribution of scores with other explanatory variables was similar.
Scores of the groups of risk and protective foods according to socioeconomic variables and the life style of the adolescents. Vitória de Santo Antão, Pernambuco, Brasil 2012.
| Variables | Groups of foods | |||
|---|---|---|---|---|
| Risk group | Protective group | |||
| Median | IQR | Median | IQR | |
| Gender | ||||
| Male | 0.2553 | 0.1567–0.3338 | 0.3980 | 0.1537–0.5073 |
| Female | 0.2559 | 0.1957–0.3236 | 0.3854 | 0.1659–0.4870 |
| p-valuea | 0.776 | 0.729 | ||
| Age range | ||||
| 10–14 years | 0.2712 | 0.1939–0.3393 | 0.3854 | 0.1715–0.4959 |
| 15–19 years | 0.2434 | 0.1476–0.3123 | 0.3956 | 0.1448–0.4969 |
| p-valuea | 0.327 | 0.954 | ||
| Area of residence | ||||
| Urban area | 0.2642 | 0.1835–0.3343 | 0.3967 | 0.1599–0.5087 |
| Rural area | 0.2447 | 0.1389–0.3020 | 0.3640 | 0.1546–0.4566 |
| p-valuea | 0.327 | 0.564 | ||
| Socioeconomic class | ||||
| A/B | 0.2760 | 0.1979–0.3426 | 0.4016 | 0.1656–0.5599 |
| C | 0.2707 | 0.1851–0.3332 | 0.3956 | 0.1620–0.4914 |
| D/E | 0.2371 | 0.1467–0.3145 | 0.3803 | 0.1545–0.4748 |
| p-valuea | 0.613 | 0.813 | ||
| Maternal schooling | ||||
| ≤9 years | 0.2556 | 0.1662–0.3235 | 0.3820 | 0.1589–0.4792 |
| >9 years | 0.2717 | 0.1885–0.3349 | 0.4021 | 0.1652–0.5247 |
| p-valuea | <0.001 | 0.683 | ||
| Level of physical activity | ||||
| Active | 0.2649 | 0.1747–0.3677 | 0.3743 | 0.1702–0.5757 |
| Sedentary | 0.2613 | 0.1754–0.3225 | 0.3938 | 0.1602–0.4848 |
| p-valuea | 0.635 | 0.773 | ||
| Smoking status | ||||
| Smoker | 0.2520 | 0.1996–0.2989 | 0.3534 | 0.1664–0.4952 |
| Non-smoker | 0.2621 | 0.1742–0.3279 | 0.3907 | 0.1605–0.4970 |
| p-valuea | 0.849 | 0.954 | ||
| Alcohol consumption | ||||
| Yes | 0.2578 | 0.2039–0.3242 | 0.3972 | 0.1493–0.5396 |
| No | 0.2615 | 0.1740–0.3277 | 0.3909 | 0.1607–0.4954 |
| p-valuea | 0.874 | 0.954 | ||
IQR, interquartile range.
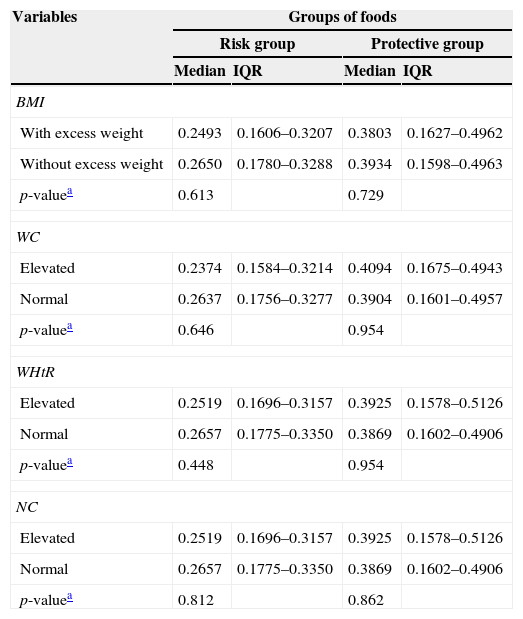
Scores of risk and protective food groups according to anthropometric variables of adolescent students. Vitória de Santo Antão, Pernambuco, Brasil 2012.
| Variables | Groups of foods | |||
|---|---|---|---|---|
| Risk group | Protective group | |||
| Median | IQR | Median | IQR | |
| BMI | ||||
| With excess weight | 0.2493 | 0.1606–0.3207 | 0.3803 | 0.1627–0.4962 |
| Without excess weight | 0.2650 | 0.1780–0.3288 | 0.3934 | 0.1598–0.4963 |
| p-valuea | 0.613 | 0.729 | ||
| WC | ||||
| Elevated | 0.2374 | 0.1584–0.3214 | 0.4094 | 0.1675–0.4943 |
| Normal | 0.2637 | 0.1756–0.3277 | 0.3904 | 0.1601–0.4957 |
| p-valuea | 0.646 | 0.954 | ||
| WHtR | ||||
| Elevated | 0.2519 | 0.1696–0.3157 | 0.3925 | 0.1578–0.5126 |
| Normal | 0.2657 | 0.1775–0.3350 | 0.3869 | 0.1602–0.4906 |
| p-valuea | 0.448 | 0.954 | ||
| NC | ||||
| Elevated | 0.2519 | 0.1696–0.3157 | 0.3925 | 0.1578–0.5126 |
| Normal | 0.2657 | 0.1775–0.3350 | 0.3869 | 0.1602–0.4906 |
| p-valuea | 0.812 | 0.862 | ||
IQR, interquartile range; BMI, body mass index; WC, waist circumference; WHtR, waist/height ratio; NC, neck circumference.
The problem of overweight and obesity in adolescence has been demonstrated by several studies.1–3,19 Even though this disorder has a multifactorial origin, inadequate eating habits constitute one of the modifiable factors most often associated with the development of excess weight.1,4,19 The excessive consumption of fast food and processed foods (rich in calories, refined carbohydrates, saturated fat, cholesterol, and sodium, which also have low dietary fiber and micronutrients) is associated with the disorder.
The score method for the assessment of dietary intake, initially proposed by Fornés et al.,18 constitutes a relatively simple measure that reflects a qualitative aspect of the diet. According to the method, higher scores mean higher consumption of certain food groups, allowing the statistical analysis of an association between consumption patterns and explanatory variables. In the present study, although no statistically significant difference was found between the intake of protective and risk foods for the development of CVD, the data may suggest, based on the analysis of the ICV, that there was probably a greater intake of protective foods, a fact that differs from the literature studies showing increasing consumption of an atherogenic diet by the adolescent population.1,19,20 However, further studies are needed regarding this specific aspect of food consumption in order to assess the presence or absence of such an event.
In a study by Levy et al.,19 with data from the I National Survey on Schoolchildren's Health (PeNSE), the high consumption of an unhealthy diet was identified (ranging from 18.0% to 50.9%) in adolescents attending public and private schools in 26 Brazilian state capitals and the Federal District, with emphasis on the consumption of sweets and soft drinks.
Zanini et al.,20 evaluating the consumption of soft drinks, sweets and fried foods in adolescents from northeast Brazil, disclosed results that are of concern regarding the weekly frequency of consumption of these items: 90.9%, 95.4% and 89.6% of the adolescents analyzed in the study, respectively, consumed the abovementioned foods at least once a week.
It is noteworthy that, according to the “Ten steps to a healthy diet” proposed by the Ministry of Health in 2006,21 only one portion of sugars and fats should be consumed a day. In cross-sectional study carried out by Neutzling et al.22 with adolescents from Pelotas, using these steps21 a high prevalence of individuals with poor dietary habits was observed when constructing the variables to characterize the eating behavior, particularly among females, with the consumption of fruits and vegetables being the most inadequate in this sample (5.3%).
Considering the condition of a higher intake of protective foods by adolescents included in the present study, we should mention the possibility of reverse causality. The high frequency of overweight and obesity may interfere with the consumption of items considered as “risk foods” for the development of CVD, due to the occurrence of possible modification strategies in the eating behavior of these adolescents. Another suggested explanation is the underreporting of consumption of risk foods by the individuals with excess weight.
Regarding the higher score found for the risk food consumption in the group of adolescents whose mothers had higher schooling, this event may have occurred due to the fact that, in countries undergoing industrialization process, such as Brazil, overweight and obesity occur more frequently in individuals of higher socioeconomic levels and higher levels of education,23 demonstrating food consumption at greater quantity, but not of better quality.
In a study by Nunes et al.24 with adolescents from different socioeconomic classes, it was demonstrated that socioeconomic status more significantly influences the development of overweight and obesity than other sociodemographic factors. However, in a study carried out by Terres et al.25 using the same cutoffs for maternal education used in this sample, higher maternal schooling was a protective factor against the consumption of a poor diet and the consequent development of excess weight. Our results allow us to conclude that there is a need for nutrition education, not only for the poorest families, but a more global action that will have an impact on the entire at-risk population.
The use of scores in this study allowed a simple and differentiated analysis of the eating patterns of adolescents, with the advantage of allowing statistical analysis to assess the diet quality, rather than explanatory variables related to eating habits.
Regarding the high prevalence of obesity and overweight according to BMI, the present study showed that this finding is a frequent event in the literature and ranges from around 16.4% to 25.1% for both genders.1,20,22,24,26 Additionally, using the NC as parameter to assess overweight and obesity detected a higher prevalence of individuals with this nutritional diagnosis. Recent studies emphasize the NC as a reliable method for the assessment of overweight in adolescents, demonstrating even greater frequencies of the disorder when compared to BMI,26,27 a fact that corroborates the present study.
Some limitations should be taken into account when interpreting the results. This is a cross-sectional study, in which cause and effect associations cannot be determined. The dietary intake assessment using different methods in the analyzed studies was also a limiting factor regarding the discussion and comparison of results. The assessment of sexual maturation stage was a factor with a high degree of rejection in schools during the pilot study, mainly in private schools, which made it impossible to obtain such data. Additionally, the IPAQ, in its original publication,16 was well rated for adolescents older than 14 years, but showed limited use for adolescents younger than 14 years.
Despite these limitations, the present study assessed, using a practical approach, the eating habits of adolescents using the score model, a tool that additionally allowed an analysis of environmental factors associated with such eating habits, demonstrating an association between the intake of high cardiovascular risk foods with higher maternal schooling. Similarly, in a study by Moraes and Hawk,28 it was observed that eating habits are mediated by family contexts in adolescents, regardless of gender. In addition, our results were important in recognizing the nutritional status of adolescents living in the municipality of Vitória de Santo Antão, being important for the implementation of strategies aimed at the prevention, treatment and control of chronic diseases in this age group.
In conclusion, the present study showed a high prevalence of overweight and obesity in the assessed adolescent schoolchildren. The greater consumption of risk foods was associated with higher maternal schooling, which indicates the need for nutrition education interventions in the family context, regardless of socioeconomic–demographic status of individuals. Such interventions should be carried out by a multidisciplinary team, including health and education professionals, as well as the media, in order to promote the health of adolescents with educational strategies and stimulate adequate food consumption, thus helping to prevent chronic diseases in adult life. The importance of introducing other anthropometric measurements in addition to weight and height in patient/individual management, such as WC, WHtR and NC in Brazil is also noteworthy, which were important for the diagnosis of abdominal obesity and excess weight.
FundingNational Council for Scientific and Technological Development (Conselho Nacional de Desenvolvimento Científico e Tecnológico – CNPq), responsible for the funding of biochemical tests.
Conflicts of interestThe author declares no conflicts of interest.
To Conselho Nacional de Desenvolvimento Científico e Tecnológico (CNPq) for funding the study.
