
The need to study the differences among consumers due to their behavioural heterogeneity and the highly competitive consumer markets is recognized. In this paper, we analyse the potential heterogeneous shopping assessment in retail and how that experience may influence on consequent customer loyalty in a different way. The effects of satisfaction on attitudinal and behavioural loyalty and positive word of mouth are estimated by a finite-mixture structural equation model, and unobserved heterogeneity is analysed simultaneously. The results show that there are three latent segments where the strength of causal relationships differs which mean that there is an overestimation of the impact of customer on loyalty when heterogeneity is ignored.
Se reconoce la necesidad del estudio de las diferencias entre los consumidores debido a sus patrones de comportamiento heterogéneos y a la alta competitividad en los mercados de consumo. En este artículo analizamos la evaluación heterogénea de la compra en el comercio minorista y cómo esa experiencia puede influir en la lealtad del cliente de una manera distinta. Los efectos de la satisfacción sobre la lealtad actitudinal, conductual y el boca-oreja positivo se determinan mediante un modelo de ecuaciones estructurales de mezclas finitas, y simultáneamente se analiza la heterogeneidad no observada. Los resultados demuestran que hay 3 segmentos latentes en los que varía la intensidad de las relaciones causales, lo que significa que se sobrestima el efecto de la satisfacción del cliente sobre la lealtad cuando se ignora la heterogeneidad.
Satisfaction is a crucial objective for customers and managers of retail establishments and a concept of great interest in consumer research (Cooil, Keiningam, Aksoy, & Hsu, 2007). Similarly, loyalty is one of the main priorities in marketing and is particularly relevant in the field of retail distribution due to the competition in this sector, scanty product differentiation and the difficulty of capturing new customers (Cortiñas, Chocarro, & Villanueva, 2010). Furthermore, service loyalty research still has certain limitations and there is disagreement over the concept and how it is measured (Bennett & Rundle-Thiele, 2004; Buttle & Burton, 2002).
The relationship between satisfaction and loyalty seems to be obvious, but even now analysis of the effectiveness of satisfaction to predict customer loyalty is a topic of interest and debate (Kumar, Pozza, & Ganesh, 2013). Various works highlight the limited influence of satisfaction on repeat purchase behaviour and intentions (e.g. Szymanski & Henard, 2001; Verhoef, 2003), and the importance of other variables that explain loyalty better (e.g. Agustin & Singh, 2005). This satisfaction–loyalty link can be extremely sensitive to factors such as sector of activity, type of customers or the antecedent, and moderator and mediator variables that involve in the relationship (Kumar et al., 2013).
In addition, market segmentation is one of the basic pillars of marketing, especially in companies in the tertiary sector (Díaz, Iglesias, Vázquez, & Ruíz, 2000). Service providers recognise that they can increase profits by identifying groups of customers with different behaviours and responses (Rust, Lemon, & Zeithaml, 2004). Given the need to adapt commercial strategies to the specific requirements of each group of customers, the study of segmentation continues to be a topic of interest even now (Becker, Rai, Ringle, & Völckner, 2013; Floh, Zauner, Koller, & Rusch, 2013). It is therefore necessary to understand market heterogeneity to improve the process that leads to loyalty. In companies in the retail sector in particular, identifying different consumer profiles is the key to improve the efficiency and effectiveness of marketing strategies (Theodoridis & Chatzipanagiotou, 2009).
Procedures used to find homogeneous groups of consumers have been evolving towards modelling unobserved heterogeneity with latent segmentation methodology. This methodology enables identification of segments that are “intuitively more attractive, more realistic and theoretically more accurate” (Lilien & Rangaswamy, 1998, p. 60). Another of the main benefits of the latent approach lies in the fact that it is based on a probability distribution model that enables joint identification of segments and estimation of population parameters (Dillon & Mulani, 1989) and therefore enables predictions on dependent variables under a common modelling structure (Cohen & Ramaswamy, 1998). In addition, this modelling is particularly interesting for commercial managers when it comes to implementing their relationship marketing strategies at segment level (Cortiñas et al., 2010; Grewal, Chandrashekaran, Johnson, & Mallapragada, 2013).
Our proposal is intended to contribute to this line of research by analysing unobserved heterogeneity on service evaluation by customers of retail establishments, to further our understanding of how that evaluation impacts on the satisfaction–loyalty relationship from their multidimensional perspectives. This work is organised in three parts. Firstly, based on a review of the literature, we define the theoretical framework for approaching the variables satisfaction and loyalty, which are the basis for the proposed causal model. There is also in-depth explanation how heterogeneity is treated in causal equations. This theoretical framework provides the basis for a series of research hypotheses. Secondly, we establish the methodology used in the empirical research and evaluate the findings. Finally, we report the most significant conclusions which can be drawn from this study and possible managerial implications.
Conceptual frameworkSatisfactionSatisfaction has been defined in the literature from different perspectives, from approaches that point to the specific or accumulative nature of the transaction (Boulding, Kalra, Staelin, & Zeithaml, 1993) to cognitive and/or affective approaches (Oliver, 1997). In the first of these groups, satisfaction over a concrete experience is an approach shared by many authors (e.g. Giese & Cote, 2000; Spreng, Mackenzie, & Olshavsky, 1996). However, in the service context, satisfaction is considered to refer to a set of accumulated experiences (Cronin & Taylor, 1994; Jones & Suh, 2000), and especially in the area of retail distribution because in this scenario consumers evaluate the establishment's ability to continuously deliver the benefits they seek. Therefore, following the approach of other studies applied to the retail context (Sivadas & Baker-Prewitt, 2000), our work regards satisfaction as the global evaluation of a customer's experiences in the shop.
As regards the second group, from the purely cognitive perspective, the classic definition from Oliver (1997, p. 3) points out that satisfaction is “a judgement the individual emits over the pleasurable level of compliance or performance of a product or service”. In this approach, the disconfirmation of expectations theory is the most widely accepted in the literature (Oliver, 1980). From a more affective perspective, one of the most representative definitions is from Giese and Cote (2000, p. 3) who consider that satisfaction is “a set of affective responses of variable intensity that occur at a specific moment in time when the individual evaluates a product or service”. In addition, other authors defend the convergence of both approaches. For example, Lovelock and Wirtz (1997, p. 631) define satisfaction as “a person's feeling of pleasure or disappointment resulting from a consumption experience when comparing the result of a product with their expectations”.
There is a stream of research that focuses on the study of the relationship between cognitive satisfaction and affective satisfaction. Oliver (2010) points out that cognitive satisfaction is preceded by an affective process, that is, regardless of expectations, consumers form positive or negative impressions of a product or service that directly influence their satisfaction. Empirical evidence in the area of services confirms the contribution of affective responses to the level of satisfaction (e.g. Mattila & Ro, 2008; Westbrook & Oliver, 1991). In general, the results show that positive affects mean that a purchase experience is positively and directly related to satisfaction (Wirtz, Mattila, & Tan, 2000). Furthermore, the role of emotions in services is particularly relevant due to consumer interaction and participation in the servuction experience (Wirtz & Bateson, 1999). In the context of retail distribution, Gelbrich (2011) shows that customer's happiness increases their satisfaction with the shop, whereas a feeling of disappointment reduces judgements of satisfaction. Therefore, we consider that in retail establishments, affective satisfaction will have a direct positive effect on cognitive satisfaction (Fig. 1); therefore, we posit the first research hypothesis:H1 Customer affective satisfaction with the establishment has a positive impact on cognitive satisfaction.

Loyalty is a multidimensional construct that has been defined and measured in different ways in the marketing literature (Oliver, 1997, 1999). Generally, it can be analysed from a behavioural and attitudinal perspective. The behavioural perspective considers that customers show different levels of loyalty in relation to their repeat purchase behaviour over time (Buttle & Burton, 2002). Although repeat purchase is the behaviour that most authors mention, other behaviours have also been observed, such as level of spending (Knox & Denison, 2000) and recommendation from others (Zeithaml, Berry, & Parasuraman, 1996). The attitudinal perspective, with a more affective nature, refers to customer preferences and favourable predispositions towards the establishment (Gremler & Brown, 1996). This attitudinal loyalty can be defined as an individual's promised behaviour which entails the likelihood of future purchases or reduced likelihood of changing to another brand or service provider (Berné, 1997). For example, according to Lovelock and Wirtz (2007, p. 629) loyalty is “the commitment to continue purchasing from a company over a long period of time”. Various studies in the retail sphere have followed this attitudinal focus on loyalty (e.g. Chaudhuri & Ligas, 2009; Gelbrich, 2011; Walsh, Evanschitzky, & Wunderlich, 2008).
Both perspectives have been criticised in the literature because repeat purchase does not necessarily imply being loyal nor is the commitment to shop again sufficient to generate loyalty (Dick & Basu, 1994). It therefore seems appropriate to consider both behavioural and attitudinal components in order to reflect the true multidimensional nature of loyalty. Loyal customers must have an emotional tie that accompanies their repeat purchase (Doherty & Nelson, 2008); furthermore, they must continue to purchase and recommend the shop even if other shops have better offers (Dick & Basu, 1994). Similarly, Oliver (1997) understands loyalty as a deep commitment to purchase again which causes a repeat purchase behaviour despite the influence of commercial efforts from the competition. Bloemer and De Ruyter (1998, p. 500) define loyalty as “partial behaviour towards a shop, expressed over time which is determined by a psychological process stemming from commitment to the brand”. Therefore, this dual approach encompasses both behaviour and attitude and has been used in various studies applied to the retail trade (Cortiñas et al., 2010; Willems & Swinnen, 2011; Zhao & Huddleston, 2012).
As well as these two components, recommendations or word of mouth (WOM) is one of the most significant and recognised dimensions in the loyalty literature (Carl, 2006). Although it was originally studied in the 1960s, there has been a significant increase in academic investigation in recent years (WOMMA). The literature contains various definitions which, in general, coincide in pointing out that it is about communication between consumers regarding a product, service or company and that the emitter of the information is an individual independent of commercial influence (e.g. Harrison-Walker, 2001; Litvin, Goldsmith, & Pan, 2008). Therefore, word of mouth excludes formal communication of customers to companies (in the form of complaints or suggestions) and of firms to customers (through promotional activities) (Mazzarol, Sweeney, & Soutar, 2007).
It has also been highlighted that it is a type of direct, personal behaviour, independent of the company, which makes the information transmitted more real and credible. In this regard, it has been recognised that WOM has a much greater impact on consumers than advertising or promotion (Sen, 2008). It is also both an antecedent and a consequence of consumers’ evaluation of a purchase experience (Godes & Mayzlin, 2004); in the pre-purchase stage individuals seek information as a risk reduction strategy, especially in the context of services, and in the post-purchase stage they use this form of communication to help, take revenge, let off steam or reduce cognitive dissonance (Halstead, 2002).
In short, taking into account the twofold perspective of loyalty – behavioural and attitudinal and the importance of word of mouth to complete the explanation of customer loyalty, in this work we consider that this loyalty will be expressed through three dimensions: behaviour – in relation to repeat purchase; attitude – in relation to predisposition towards the shop, tie or commitment; and word of mouth – in relation to the recommendations the customer makes about the establishment.
As regards the relationship between satisfaction and loyalty, satisfaction has been considered as one of the main antecedents of loyalty, especially in retail distribution (Bloemer & De Ruyter, 1998). Despite some contradictory results for the satisfaction–loyalty link (Seiders, Voss, Grewal, & Godfrey, 2005; Verhoef, Franses, & Hoekstra, 2002; Verhoef, 2003), many recent studies applied to the retail trade confirm the direct effect of judgements of satisfaction on different dimensions of loyalty. For example, the study by Walsh et al. (2008) on a chain of franchises finds that satisfaction has a positive impact on repetition and word-of-mouth intentions. Binninger (2008) concludes that satisfaction with a given food shop favours preferences, intentions and attitudes to repeat and recommend. Vesel and Zabkar (2009) find that satisfaction with shops selling household goods has a direct impact on intention to repeat purchase and recommend. And the work by Cortiñas et al. (2010) show that customer satisfaction in supermarkets increases frequency of visits to the establishment and repeat purchase intention. Finally, Nesset, Nervik, and Helgesen (2011) confirm the positive effect of satisfaction with foods shops on future purchase intention and recommendations to others.
Therefore, we understand that both the affective satisfaction and cognitive satisfaction customers experience after their purchase experiences in shops will have a direct, positive influence on the loyalty dimensions we are considering (Fig. 1): repeat behaviour (behavioural loyalty), attitude (attitudinal loyalty) and word of mouth. Therefore we posit the following hypotheses.H2 Affective satisfaction has a positive impact on behavioural loyalty (H2a), attitudinal loyalty (H2b) and word of mouth (H2c). Cognitive satisfaction has a positive impact on behavioural loyalty (H3a), attitudinal loyalty (H3b) and word of mouth (H3c).
The relationships between satisfaction and loyalty in the retail context have mainly been studied with regression analysis (e.g. Binninger, 2008; Walsh et al., 2008) and structural equations models (e.g. Rodríguez del Bosque, San Martín, & Collado, 2006; Vesel & Zabkar, 2009; Nesset et al., 2011). Whatever the statistical procedure used, in the study of these relations it is generally assumed that consumers are homogeneous and any differences that may exist in their evaluations and responses are therefore ignored. However, various authors have argued for the need to detect and analyse differentiated consumer behaviour. Considering the market from an aggregated perspective may be a fairly unrealistic vision (Becker et al., 2013) as bias can occur in estimates of parameters causing inconsistent results in relation to the effect of marketing variables (Kamakura & Wedel, 2004), instability of the resulting segments (Blocker & Flint, 2007) and solutions that are difficult to implement (Kim, Blanchard, DeSarbo, & Fong, 2013).
When attempting to analyse individual heterogeneity at segment level, numerous studies use a priori methods in the segmentation process, that is, they previously identify the variables whose discrimination capacity is to be assessed, they describe the segments and relate their characteristics with variables relating to their behaviour. Similarly, in structural equations’ models heterogeneity is treated using multigroup methodology (Jöreskog, 1971; Sörbom, 1974), assuming that consumers can be assigned to different segments in relation to certain segmentation criteria based on sociodemographic variables or variables specific to the purchase situation. This methodology presents various limitations inherent in a priori segmentation as it is based on a two-stage procedure that first forms groups without considering the structural model and then applies multigroup methodology in each segment and it can be statistically inefficient for large models (Hahn, Johnson, Herrmann, & Huber, 2002; Jedidi, Jagpal, & DeSarbo, 1997).
The main challenge for the researcher is that it is rarely known beforehand how many segments there are and what consumers are in them, so latent modelling, as a predictive post hoc procedure is extremely useful for identifying the size and composition of unknown groups (Cohen & Ramaswamy, 1998), and is an efficient tool for detecting unobserved heterogeneity at segment level (Malhotra & Peterson, 2001). The methodology developed by Jedidi et al. (1997) based on the heterogeneity analysis proposal in Muthén's (1989) MIMIC model simultaneously combines estimation of causal relations and the detection of unobserved heterogeneity based on a general structural model with random coefficients. In particular their proposal makes it possible to obtain segments and estimate the loadings of the measurement model and causal relations in each of the segments that have not been defined a priori. This perspective follows the line of segmentation models based on the consumer decision process like those proposed by Kamakura and Russell (1989) and Chintagunta, Jain, and Vilcassim (1991), although with the difference that it enables work with simultaneous equations and measurement error.
Thus, study of customer heterogeneity in the relationship between satisfaction and loyalty is a recent line of research that can further our understanding of the formation of consumer responses (e.g. Cortiñas et al., 2010; Teller & Gittenberger, 2011). Following this approach we formulate the last research hypotheses where we consider the existence of groups of customers based on differences not only in the relationship between the two types of satisfaction, but also in the relationship between both types and the dimensions of loyalty (Fig. 1).H4 The strength of the relationship between affective satisfaction and cognitive satisfaction differs between consumer segments. The strength of the relationship between affective satisfaction and behavioural loyalty (H5a), attitudinal loyalty (H5b), and word of mouth (H5c) differs between consumer segments. The strength of the relationship between cognitive satisfaction and behavioural loyalty (H6a), attitudinal loyalty (H5b), and word-of-mouth (H5c) differs between consumer segments.
A quantitative investigation has been carried out in the context of shopping experiences at retail establishments selling food, textile, household and electronic goods. The interviews were distributed on the basis of a series of representative shop formats in a Spanish city and its metropolitan area.
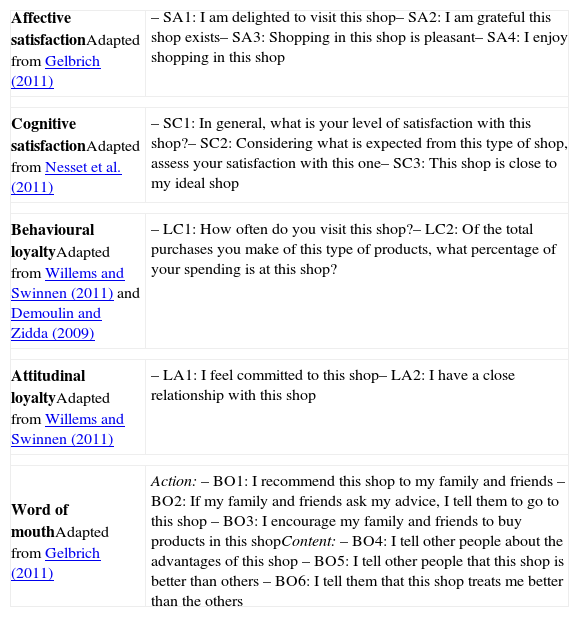
The final questionnaire, with minor changes in item headings to improve understanding after a pilot test, comprises a set of scales carefully selected from the most recent literature and adapted to our context (see Table 1). Except for the behavioural loyalty scale, 7-point Likert type scales were used. The affective satisfaction scale was adapted from Gelbrich (2011) and is based on the works by Oliver (1997) and Aurier and Siadou-Martin (2007). Cognitive satisfaction was measured on a scale used in the work by Nesset et al. (2011). The behavioural loyalty scale, adapted from the one used in the works by Willems and Swinnen (2011) and Demoulin and Zidda (2009) and based on Osman (1993), includes an item on frequency of visits to the establishment (from 1 – “Almost never” to 7 – “Almost always”) and a 7-point item on average expenditure percentage (from 1 – “0%” to 7 – “100%”).
Measurement scales.
| Affective satisfactionAdapted from Gelbrich (2011) | – SA1: I am delighted to visit this shop– SA2: I am grateful this shop exists– SA3: Shopping in this shop is pleasant– SA4: I enjoy shopping in this shop |
| Cognitive satisfactionAdapted from Nesset et al. (2011) | – SC1: In general, what is your level of satisfaction with this shop?– SC2: Considering what is expected from this type of shop, assess your satisfaction with this one– SC3: This shop is close to my ideal shop |
| Behavioural loyaltyAdapted from Willems and Swinnen (2011) and Demoulin and Zidda (2009) | – LC1: How often do you visit this shop?– LC2: Of the total purchases you make of this type of products, what percentage of your spending is at this shop? |
| Attitudinal loyaltyAdapted from Willems and Swinnen (2011) | – LA1: I feel committed to this shop– LA2: I have a close relationship with this shop |
| Word of mouthAdapted from Gelbrich (2011) | Action:– BO1: I recommend this shop to my family and friends– BO2: If my family and friends ask my advice, I tell them to go to this shop– BO3: I encourage my family and friends to buy products in this shopContent:– BO4: I tell other people about the advantages of this shop– BO5: I tell other people that this shop is better than others– BO6: I tell them that this shop treats me better than the others |
Attitudinal loyalty was measured with the scale used by Willems and Swinnen (2011), based on research by Morgan and Hunt (1994) and Bloemer and De Ruyter (1998). Finally, the word of mouth was measured following Gelbrich's (2011) approach which differentiates two dimensions: action – referring to the degree to which consumers recommend a product or company (Swan & Oliver, 1989) – and content – referring to the degree to which the consumer speaks of the advantages (Harrison-Walker, 2001).
Personal ad-hoc questionnaires were used intercepting consumers as they left the establishments from Monday to Saturday mornings and afternoons. Directed sampling was used, asking people as they left the various sales outlets and a total of 715 valid questionnaires were collected (42% from shops selling food, 25.2% textiles, 25.2% electronic goods and 7.6% household goods) The main sociodemographic characteristics of the sample are: 62.8% women with an average age of 40.6 years (±S.D. 14.8 years), 54.1% stated they were working, and 48.7% had a bachelor's degree or higher.
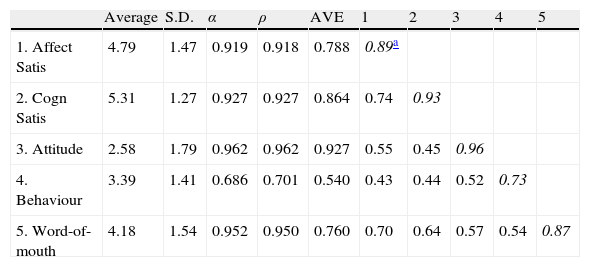
Dimensionality and reliability of the measurement scalesThe dimensionality and reliability of the proposed scales was analysed using exploratory factor analysis with maximum likelihood (ML) and calculation of Cronbach's alpha using IBM SPSS Statistics 20 software. This step enabled us to purge the scales, eliminating a variable from the affective satisfaction scale (SA4) and a cognitive satisfaction variable (SC3) as recommended by the reliability indexes. Dimensionality was confirmed with maximum likelihood estimation of a first order measurement model using EQS 6.1 statistical software. Viewing with caution the significance of the global contrast given the size of the sample, the statistics indicate that the model presents adequate fit (ChiSat-Bt.2 (d.f.=80)=433.42; RMSEA=0.067; CFI=0.974; GFI=0.932; AGFI=0.892). The final affective satisfaction scales (3 items), cognitive satisfaction (2 items), behavioural loyalty (2 items), attitudinal loyalty (2 items) and word of mouth (6 items)1 reached satisfactory levels of reliability and internal consistency. These indicators, together with the average values of the scales and the correlations between them, are shown in Table 2.
Descriptive statistics, reliability indexes and measurement scale correlations.
| Average | S.D. | α | ρ | AVE | 1 | 2 | 3 | 4 | 5 | |
| 1. Affect Satis | 4.79 | 1.47 | 0.919 | 0.918 | 0.788 | 0.89a | ||||
| 2. Cogn Satis | 5.31 | 1.27 | 0.927 | 0.927 | 0.864 | 0.74 | 0.93 | |||
| 3. Attitude | 2.58 | 1.79 | 0.962 | 0.962 | 0.927 | 0.55 | 0.45 | 0.96 | ||
| 4. Behaviour | 3.39 | 1.41 | 0.686 | 0.701 | 0.540 | 0.43 | 0.44 | 0.52 | 0.73 | |
| 5. Word-of-mouth | 4.18 | 1.54 | 0.952 | 0.950 | 0.760 | 0.70 | 0.64 | 0.57 | 0.54 | 0.87 |
The measurement scales have: (1) convergent validity because all the factor loadings are significant at 99% (t-statistic>2.58) (Steenkamp & Van Trijp, 1991); and (2) discriminant validity, because the linear correlation between each pair of scales is less than the square root of the AVE in the scales (see Table 2). This validity was analysed in depth with the Chi2 difference test between estimation of the model restricting the correlations between each pair of constructs to the unit and the unrestricted model following the indications in Anderson and Gerbing (1988). The statistical value Chi2=3730.96 (d.f.=10) is significant at 99% (p-value=0.000) and so we can state that each scale measures a different dimension.
Estimation of the finite mixture structural equation modelAs stated before, we use the methodology developed by Jedidi et al. (1997) to estimate the causal relations taking into account the existence of possible unobserved heterogeneity. The main characteristics of these authors’ proposal are as follows. Assuming there are s=1, …, S segments or classes of unknown proportion in the population, s denotes the index of belonging of the individual i (i=1, …, N) to the unknown segment s. Based on belonging to each segment, the equations that represent the measurement model are reflected as follows (according to the standard notation for multigroup structural models (Sörbom, 1974)):
where for any segment s, ξs is the vector of independent latent variables for the segment with average E(ξs)=τξs and variance E[(ξs−τξs)(ξs−τξs)']=Φs; ηs is the vector of dependent latent variables; y|s represents the vector of observable variables/indicators to measure the vector of dependent latent variables ηs; x|s is the vector of observable variables/indicators to measure the vector of independent latent variables ξs; Λys and Λxs are the matrices of factor loadings for each observable variable (dependent and independent respectively); vys and Λxs are the measurement vectors of the intercept term for the dependent and independent latent variables respectively; and εs and δs represent the vectors of measurement errors for the dependent and independent latent variables with variances Θεs and Θδs respectively that are not necessarily diagonal.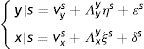
It is assumed that the vectors of measurement errors are uncorrelated with the vectors of latent variables ξs and ηs; and that the average error vectors are null.
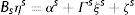
On the basis of the measurement model described in Eq. (1), the structural model is established that enables the different latent constructs for each segment to be related as follows:
Eq. (2) can be transformed assuming that the beta matrix of coefficients that relates the dependent latent constructs can be expressed as B=(I−Bs) for each segment:where ∀s=1,…,S, Bs is the non-singular matrix of structural coefficients, which shows the relations between the dependent or endogeneous latent variables; Γs represents the structural coefficient matrix that shows the effect of the independent variables ξs on the dependent latent variables ηs; αs is the vector that reflects the constant terms (intercept); and ζs is the vector of uncorrelated random errors of the structural model, with zero mean and variance Ψs.
The model expressed in Eq. (3) assumes that the population coefficients are invariant between the groups and so the multigroup structural model for known groups has been identified (Sörbom, 1974); therefore, Eq. (3) is determined in all the groups where the data have a multivariant normal distribution (Titterington, Smith, & Makov, 1985).
Δ|s denotes the joint vector of observable variables given the membership to segment s. Assuming that vector Δ|s follows a conditional multivariant normal distribution, the unconditional distribution of the vector is a mixture of distributions expressed as follows:
We can express the function of likelihood for a given sample (Δ1,…,ΔN) of i=1, …, N observations as the product of normal distribution density functions: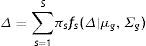
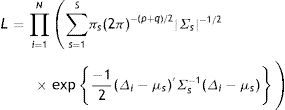
Estimation of the model enables determination of the vectors and matrices that reflect the population parameters for each segment s, (Λys,Λxs,Bs,Γs,vys,vxs,αs,Φs,ψs,Θεs,Θδs,τξs), and the unknown proportions πs, ∀s=1,…,S.
Jedidi et al. (1997) indicate that the maximum likelihood estimations for the measurement vector and the variance–covariance matrix are obtained in relation to the theoretical measurement model and structural Eqs. (1) and (3). The likelihood function (Eq. (5)) is estimated on the basis of a modification of the two-stage estimation–maximisation (EM) algorithm. Thus, when convergence is achieved, the algorithm provides the estimations for the population parameters and their asymptotic covariances. The a posteriori likelihood that observation i belongs to segment s is denoted by pis∧ and represents the fuzzy classification of N individuals in S segments – likelihood of membership to each segment S – conditional to the proposed structural model.
In short, the aim of finite mixture SEM modelling is to simultaneously estimate the causal relations proposed in Fig. 1 and detect unobserved heterogeneity from the general random coefficient model.
Firstly, the aggregated causal model is estimated using Robust Maximum Likelihood given the lack of multivariate normality in the observable variables. Then, a simplified model is estimated incorporating unobserved heterogeneity with the aim of identifying and quantifying latent segments and estimating the structural relations. Based on sample data and following the notation presented at the start of this section, it is assumed that after i=1, …, 715 individuals, there are s=1, …, S a priori unknown latent segments. Conditioning belonging to segment s, the measurement model expressed in Eq. (1) comprises vector x|s which meets the valuations of the 3 variables observed in the affective satisfaction scale which act as antecedents. Vector ξs reflects the affective satisfaction latent variable to which the previous observable variables load. Vector y|s includes the observations of observable variables that act as dependent: 2 cognitive satisfaction variables, 2 behavioural loyalty variables, 2 attitudinal loyalty variables and 6 word of mouth variables. Vector ηs gathers the 4 latent variables that act as dependent ones.
In order to ensure identification of the model it must be assumed that the measurement error vectors are uncorrelated with the latent variable vectors ξs and ηs; and that the vectors of average errors are null (E(εs)=E(δs)=0).
Based on the measurement model conditioned to belonging to segment s, the structural equations model that we propose is defined as in Eq. (3), where the matrix Γs reflects the effect of the affective satisfaction latent variable on the cognitive satisfaction and the three dimensions of loyalty. And the matrix Bs shows the effect of cognitive satisfaction on the other three endogenous latent variables (behavioural loyalty, attitudinal loyalty and word of mouth).
The structural model represented in Eq. (3) was estimated using an iteration process with the expectation–maximisation algorithm with Mplus 7.0. software. This iterative methodology consists in a four-stage estimation of all the population parameters conditioned to belonging to the segment s(Λys,Λxs,Bs,Γs,vys,vxs,αs,Φs,ψs,Θεs,Θδs,τξs), and the likelihoods of belonging πs, ∀s=1,…,S. According to Cortiñas et al. (2010), the process begins by contemplating 2 latent segments, in a first stage the parameters are relative to constants vys,vxs,αs,τξs (stage 1). The parameters are gradually released one by one according to the modification indexes. Secondly, the parameters associated to the variances are released Φs,Θεs,Θδs (stage 2). Then those associated to the matrices that reflect the factor loads and causal relations between the latent variables Λys,Λxs,Bs,Γs (stage 3) are released and, finally, the likelihood of belonging or the size of the latent segment πs (stage 4).
The process is repeated until it is verified that the evaluation criteria increase with model parsimony, especially the Bayesian Information Criterion (BIC). At each estimation stage, a considerable number of random initial values and interactions were used to prevent convergence to a local optimum (McLachlan & Basford, 1988).
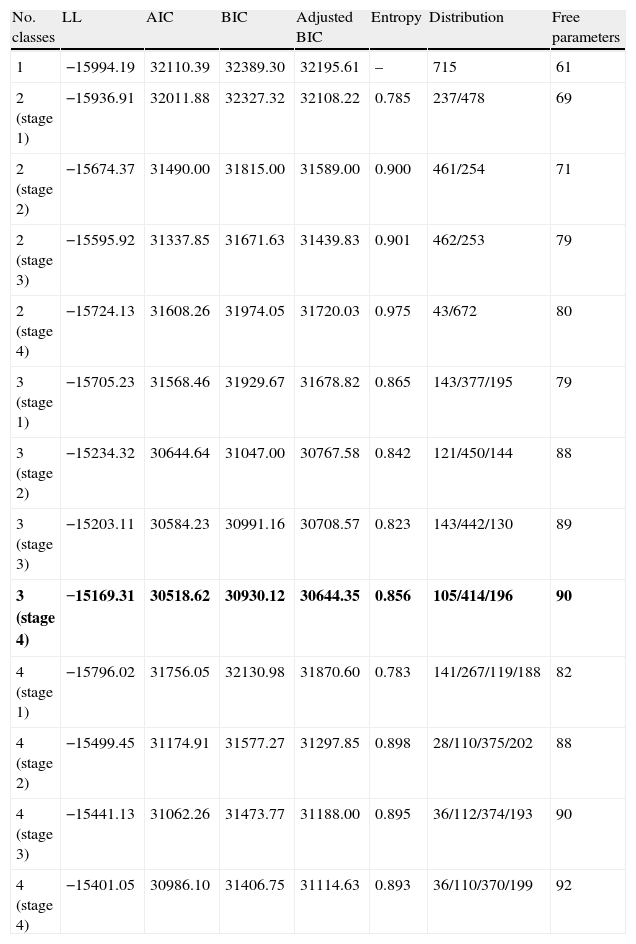
ResultsTable 3 shows the results of the different iterative processes, the number of latent segments used in the estimation, the indexes to evaluate parsimony (AIC, BIC and adjusted BIC) and discriminatory capacity (entropy), the size of each class/latent segment in absolute value and the number of free parameters at each stage of the estimation.
Evaluation indexes for determining the number of latent classes.
| No. classes | LL | AIC | BIC | Adjusted BIC | Entropy | Distribution | Free parameters |
| 1 | −15994.19 | 32110.39 | 32389.30 | 32195.61 | – | 715 | 61 |
| 2 (stage 1) | −15936.91 | 32011.88 | 32327.32 | 32108.22 | 0.785 | 237/478 | 69 |
| 2 (stage 2) | −15674.37 | 31490.00 | 31815.00 | 31589.00 | 0.900 | 461/254 | 71 |
| 2 (stage 3) | −15595.92 | 31337.85 | 31671.63 | 31439.83 | 0.901 | 462/253 | 79 |
| 2 (stage 4) | −15724.13 | 31608.26 | 31974.05 | 31720.03 | 0.975 | 43/672 | 80 |
| 3 (stage 1) | −15705.23 | 31568.46 | 31929.67 | 31678.82 | 0.865 | 143/377/195 | 79 |
| 3 (stage 2) | −15234.32 | 30644.64 | 31047.00 | 30767.58 | 0.842 | 121/450/144 | 88 |
| 3 (stage 3) | −15203.11 | 30584.23 | 30991.16 | 30708.57 | 0.823 | 143/442/130 | 89 |
| 3 (stage 4) | −15169.31 | 30518.62 | 30930.12 | 30644.35 | 0.856 | 105/414/196 | 90 |
| 4 (stage 1) | −15796.02 | 31756.05 | 32130.98 | 31870.60 | 0.783 | 141/267/119/188 | 82 |
| 4 (stage 2) | −15499.45 | 31174.91 | 31577.27 | 31297.85 | 0.898 | 28/110/375/202 | 88 |
| 4 (stage 3) | −15441.13 | 31062.26 | 31473.77 | 31188.00 | 0.895 | 36/112/374/193 | 90 |
| 4 (stage 4) | −15401.05 | 30986.10 | 31406.75 | 31114.63 | 0.893 | 36/110/370/199 | 92 |
The optimal number of segments is highlighted in bold (three segments in 4th stage).
The estimated model and the number of latent classes for retention are chosen according to criterion values, which suggest the first two conclusions. Firstly, estimation of the causal model without taking into account data heterogeneity (aggregated vision: number of classes=1) presents clearly inferior evaluation criteria to the other proposals where that heterogeneity is taken into account (disaggregated vision: number of classes=3). This fact indicates that there is unobserved heterogeneity in the effect of affective satisfaction over cognitive satisfaction and in the effects of both types of satisfaction on behavioural loyalty, attitudinal loyalty and positive word of mouth in the estimation of their causal relations. Secondly, the evaluative indexes indicate that the best estimation is the proposal that contemplates three latent segments in the fourth stage of the iterative process. In this model all the parameters of any matrix were left free according to the modification index values. Choosing this modelling as the optimum one, three segments are obtained with sizes π1=14.7% (105 customers), π2=57.9% (414 customers) and π3=27.4% (196 customers).
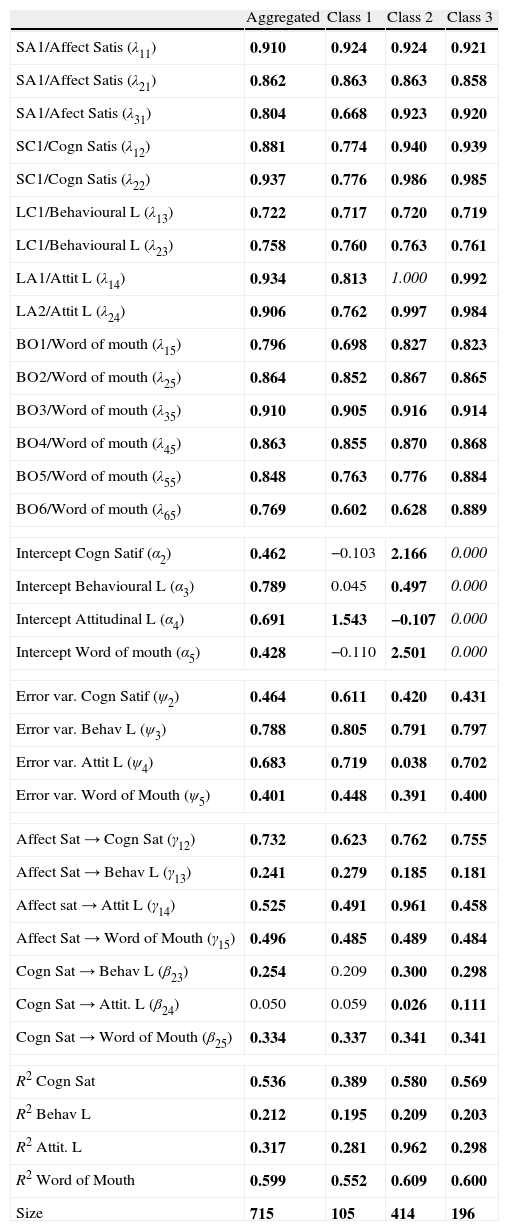
To examine for possible differences in the causal relations between the three segments the estimations of the standardised loadings in the measurement and structural relationship models are analysed for the aggregated model and the model with three latent classes (see Table 4).
Standardised loads for the measurement models and estimations of causal relations (model aggregated and by segment).
| Aggregated | Class 1 | Class 2 | Class 3 | |
| SA1/Affect Satis (λ11) | 0.910 | 0.924 | 0.924 | 0.921 |
| SA1/Affect Satis (λ21) | 0.862 | 0.863 | 0.863 | 0.858 |
| SA1/Afect Satis (λ31) | 0.804 | 0.668 | 0.923 | 0.920 |
| SC1/Cogn Satis (λ12) | 0.881 | 0.774 | 0.940 | 0.939 |
| SC1/Cogn Satis (λ22) | 0.937 | 0.776 | 0.986 | 0.985 |
| LC1/Behavioural L (λ13) | 0.722 | 0.717 | 0.720 | 0.719 |
| LC1/Behavioural L (λ23) | 0.758 | 0.760 | 0.763 | 0.761 |
| LA1/Attit L (λ14) | 0.934 | 0.813 | 1.000 | 0.992 |
| LA2/Attit L (λ24) | 0.906 | 0.762 | 0.997 | 0.984 |
| BO1/Word of mouth (λ15) | 0.796 | 0.698 | 0.827 | 0.823 |
| BO2/Word of mouth (λ25) | 0.864 | 0.852 | 0.867 | 0.865 |
| BO3/Word of mouth (λ35) | 0.910 | 0.905 | 0.916 | 0.914 |
| BO4/Word of mouth (λ45) | 0.863 | 0.855 | 0.870 | 0.868 |
| BO5/Word of mouth (λ55) | 0.848 | 0.763 | 0.776 | 0.884 |
| BO6/Word of mouth (λ65) | 0.769 | 0.602 | 0.628 | 0.889 |
| Intercept Cogn Satif (α2) | 0.462 | −0.103 | 2.166 | 0.000 |
| Intercept Behavioural L (α3) | 0.789 | 0.045 | 0.497 | 0.000 |
| Intercept Attitudinal L (α4) | 0.691 | 1.543 | −0.107 | 0.000 |
| Intercept Word of mouth (α5) | 0.428 | −0.110 | 2.501 | 0.000 |
| Error var. Cogn Satif (ψ2) | 0.464 | 0.611 | 0.420 | 0.431 |
| Error var. Behav L (ψ3) | 0.788 | 0.805 | 0.791 | 0.797 |
| Error var. Attit L (ψ4) | 0.683 | 0.719 | 0.038 | 0.702 |
| Error var. Word of Mouth (ψ5) | 0.401 | 0.448 | 0.391 | 0.400 |
| Affect Sat→Cogn Sat (γ12) | 0.732 | 0.623 | 0.762 | 0.755 |
| Affect Sat→Behav L (γ13) | 0.241 | 0.279 | 0.185 | 0.181 |
| Affect sat→Attit L (γ14) | 0.525 | 0.491 | 0.961 | 0.458 |
| Affect Sat→Word of Mouth (γ15) | 0.496 | 0.485 | 0.489 | 0.484 |
| Cogn Sat→Behav L (β23) | 0.254 | 0.209 | 0.300 | 0.298 |
| Cogn Sat→Attit. L (β24) | 0.050 | 0.059 | 0.026 | 0.111 |
| Cogn Sat→Word of Mouth (β25) | 0.334 | 0.337 | 0.341 | 0.341 |
| R2 Cogn Sat | 0.536 | 0.389 | 0.580 | 0.569 |
| R2 Behav L | 0.212 | 0.195 | 0.209 | 0.203 |
| R2 Attit. L | 0.317 | 0.281 | 0.962 | 0.298 |
| R2 Word of Mouth | 0.599 | 0.552 | 0.609 | 0.600 |
| Size | 715 | 105 | 414 | 196 |
Estimations in bold are significant at least at 95% (p-value<0.05).
Parameters that appear in italics were set before the estimation.
The results of the aggregated model, that is, the one that does not take heterogeneity into account, indicates that most of the proposed causal relations are significant. In particular, there is a positive and significant effect of affective satisfaction on cognitive satisfaction (γ12=0.732), and so the first hypothesis H1 is accepted. This relationship is in line with the contributions that show that service satisfaction judgements are preceded by affects generated by the shopping experience (e.g. Gelbrich, 2011; Mattila & Ro, 2008).
Affective satisfaction has a positive and significant influence on the three proposed consequences of loyalty: attitudinal loyalty (γ14=0.525), behavioural loyalty (γ13=0.241) and word of mouth (γ15=0.496). These results lead to acceptance at the global level of the group of hypotheses H2a, H2b and H2c. Cognitive satisfaction has a positive and significant effect on behavioural loyalty (β23=0.254) and word of mouth (β25=0.334), but not on attitudinal loyalty and so only hypotheses H3a and H3c are accepted. The fit indexes for the causal model, except the contrast associated to the robust Chi2 are adequate (RMSEA=0.061; ChiSat-Bt.2 (g.l.=74)=273.1, p-valour<0.05; CFI=0.973; TLI=0.961).
Therefore affective and cognitive satisfaction contribute to the creation of loyalty as other studies have concluded by studies that applied to the retail trade confirming the effect of satisfaction on the different responses associated to loyalty (e.g. Cortiñas et al., 2010; Nesset et al., 2011). However, although affective satisfaction has sufficient power to form loyalty in its three dimensions (repeat purchase, commitment and recommendations) the same cannot be said for cognitive satisfaction as the results indicate that it has no significant influence on attitudinal loyalty.
The results for the model disaggregating into 3 latent classes show interesting differences in the relations between the variables. The first segment is the smallest group (N=105 customers). It presents the lowest constant values for cognitive satisfaction (α2_class1=−0.103) and word of mouth (α5_class1=−0.110) of the three segments. Furthermore, it achieves the highest intercept for attitudinal loyalty (α4_class1=1.543), with an increase in this value in comparison to the aggregated model (α4_agreg=0.691). This group has the highest values for the error variances associated to the four dependent variables. In the causal relations analysed, these customers are characterised by having the highest significant effect of affective satisfaction on behavioural loyalty (γ13_class1=0.279) of the three segments. In addition, unlike the other two groups, in this segment cognitive satisfaction does not have a significant influence on behavioural loyalty (β23_class1=0.209) or attitudinal loyalty (β24_class1=0.059). The relationship between affective satisfaction and cognitive satisfaction (RCogSat_class12=0.389) is not as well explained in comparison to the other two groups (RCogSat_class22=0.580; RCogSat_class32=0.569).
The second class has the largest number of customers (N=414), representing 58% of the sample. In this group the constants of the four equations associated to the dependent variables are significant, presenting the lowest value associated to attitudinal loyalty (α4_class2=−0.107). However, this segment shows the strongest influence of affective satisfaction on this type of loyalty (γ14_class2=0.961). For the other causal relations, in this latent class all the estimations are significant, and in particular there is a significant relationship between cognitive satisfaction and behavioural loyalty (β23_class2=0.300).
Globally, this segment shows R2 indexes above those achieved in the other groups, and achieves the best explanation of attitudinal loyalty in relation to the two dimensions of satisfaction (RAttitL_class22=0.962) and word of mouth (RWOM_class22=0.609).
The third segment has 196 customers. As in the second segment, all the relationships between satisfaction and loyalty are significant. Although despite substantial influence, the effects of affective satisfaction on loyalty show lower values in comparison to the other two groups and the aggregated model. In particular, the effect of this dimension of satisfaction on behavioural loyalty (γ13_class3=0.181) is slightly below the value achieved in the second group and quite a bit lower than the estimated effect in the first group. In addition, the estimations in this segment also show lower effects in relation to affective satisfaction with the other dimensions of loyalty in comparison to the aggregated level: attitudinal loyalty (γ14_class3=0.458) and word of mouth (γ15_class3=0.484). However, this last dimension of loyalty is better explained than in the first class or in the aggregated model (RBO_class32=0.600).
Thus the results show that the effect of affective satisfaction on cognitive satisfaction (H4) and the effects of affective satisfaction and cognitive satisfaction on behavioural loyalty (H5a, H6a), attitudinal loyalty (H5b, H6b) and positive word of mouth (H5c, H6c) differ over the three segments identified. In particular, in the second and third class all the causal relations are significant, providing affirmative confirmation of hypothesis H1 and the groups of hypotheses H2 and H3. However, in the first segment we cannot accept the hypotheses concerning the effect of cognitive satisfaction on behavioural and attitudinal loyalty (H3a and H3b). These results suggest that the relationship between the two types of satisfaction and their effects on loyalty do not remain constant in all consumers as differences can be seen between the groups obtained. Firstly, in one group of individuals (class 1) most of the relations are less intense than the relations in the other groups; furthermore, cognitive satisfaction does not have a significant influence on either behavioural or attitudinal loyalty. Secondly, there are two other groups (class 2 and 3) where all the relations are fulfilled but with the difference that in class 2 most of the effects are less intense than in class 3. Consequently, we can confirm the existence of heterogeneity in the process of creating loyalty in customers of retail establishments.
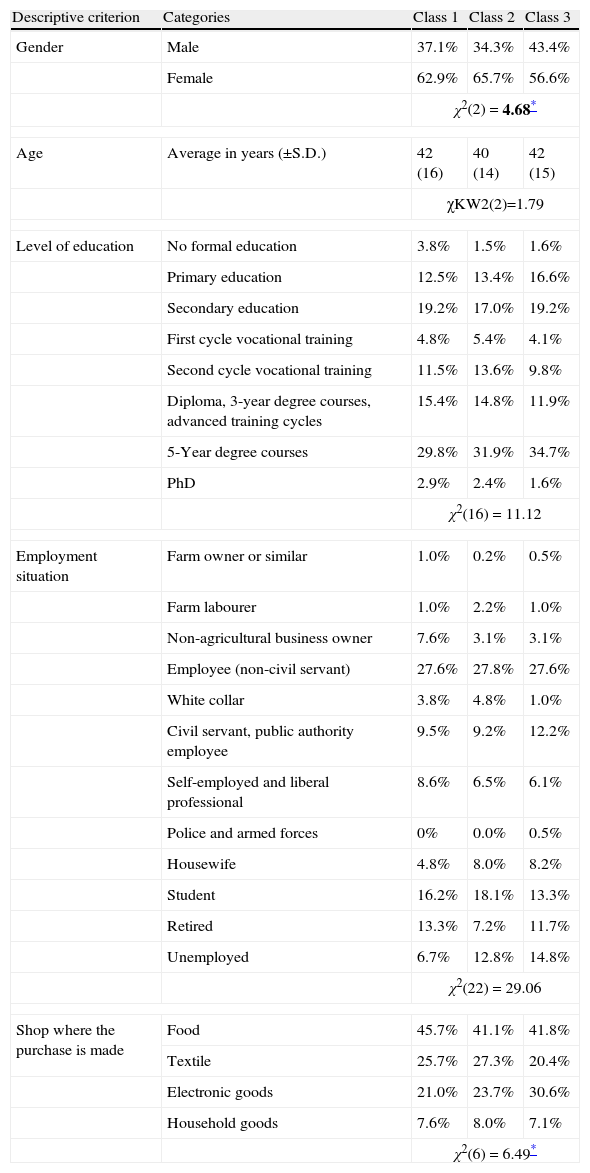
The final composition of the three segments has been studied by analysing the information from sociodemographic variables and a specific criterion concerning the type of establishment where the customer made the purchase using non-parametric bivariant tests with IBM SPSS Statistics 20 software (see Table 5). Although the results only show significant differences between the three segments in relation to the gender of the consumer, we consider the distribution of all the variables important for detailing the profile of the groups obtained.
Characterisation of the latent segments.
| Descriptive criterion | Categories | Class 1 | Class 2 | Class 3 |
| Gender | Male | 37.1% | 34.3% | 43.4% |
| Female | 62.9% | 65.7% | 56.6% | |
| χ2(2)=4.68* | ||||
| Age | Average in years (±S.D.) | 42 (16) | 40 (14) | 42 (15) |
| χKW2(2)=1.79 | ||||
| Level of education | No formal education | 3.8% | 1.5% | 1.6% |
| Primary education | 12.5% | 13.4% | 16.6% | |
| Secondary education | 19.2% | 17.0% | 19.2% | |
| First cycle vocational training | 4.8% | 5.4% | 4.1% | |
| Second cycle vocational training | 11.5% | 13.6% | 9.8% | |
| Diploma, 3-year degree courses, advanced training cycles | 15.4% | 14.8% | 11.9% | |
| 5-Year degree courses | 29.8% | 31.9% | 34.7% | |
| PhD | 2.9% | 2.4% | 1.6% | |
| χ2(16)=11.12 | ||||
| Employment situation | Farm owner or similar | 1.0% | 0.2% | 0.5% |
| Farm labourer | 1.0% | 2.2% | 1.0% | |
| Non-agricultural business owner | 7.6% | 3.1% | 3.1% | |
| Employee (non-civil servant) | 27.6% | 27.8% | 27.6% | |
| White collar | 3.8% | 4.8% | 1.0% | |
| Civil servant, public authority employee | 9.5% | 9.2% | 12.2% | |
| Self-employed and liberal professional | 8.6% | 6.5% | 6.1% | |
| Police and armed forces | 0% | 0.0% | 0.5% | |
| Housewife | 4.8% | 8.0% | 8.2% | |
| Student | 16.2% | 18.1% | 13.3% | |
| Retired | 13.3% | 7.2% | 11.7% | |
| Unemployed | 6.7% | 12.8% | 14.8% | |
| χ2(22)=29.06 | ||||
| Shop where the purchase is made | Food | 45.7% | 41.1% | 41.8% |
| Textile | 25.7% | 27.3% | 20.4% | |
| Electronic goods | 21.0% | 23.7% | 30.6% | |
| Household goods | 7.6% | 8.0% | 7.1% | |
| χ2(6)=6.49* | ||||
As regards the sociodemographic characteristics of the first segment, this group is made up mainly of women, over 60% in the second segment. They have the oldest average age together with the third segment (42±16 years), with the highest percentage of customers without education (3.8%) and lower level university education (45.2% first cycle and second cycle studies). This segment has the highest percentage of retired people (13.3%) and the lowest unemployment (6.7%). It consists mainly of consumers who have been shopping in food shops (45.7%).
The second latent segment has the highest percentage of women (65.7%), the youngest customers (40±14 years) and shows a substantial percentage of students in vocational training (19%) and at university (46.7%). In comparison with the other two groups, a high percentage of consumers have been shopping in a clothes shop (27.3%).
Finally, the third group has the highest percentage of men (43.4%). The average age of customers in this segment is similar to that of those in the first segment (42±15 years). This group has a high percentage of customers with a level of education similar to that of a degree (34.7%) and unemployed (14.8%). Furthermore, 30.6% of consumers in the group did their shopping in an electronic goods shop.
As indicated above, although there is only one difference in relation to one criterion which makes it significant, the description of the groups according to the main sociodemographic characteristics and the type of shop help to profile the types of customers found. In general terms, group 1 could respond to a profile of classical customers formed by adult women with a lower level of education with a predominance of shopping in food shops. Group 2 represents a profile of individuals also made up of women, although slightly younger, with a higher educational level, with a particular emphasis for shopping in clothing shops. Group 3 fits more closely with a profile of adult customers with higher education, containing more men than the previous groups and with a higher percentage of shopping in electronic shops.
Discussion and managerial implicationsMarket segmentation is one of the basic pillars of marketing and is particularly important in the sphere of firms that are active in the retail distribution sector. Retail establishments are aware of the potential for increasing their profits by identifying groups of customers that show different attitudes and behaviours towards the sales outlet. In this line of research, our work provides evidence of the heterogeneity in the market by explaining the process that leads to loyalty, showing different consumer profiles based on latent segmentation methodology. The results show three latent classes that identify groups of customers where the strength of the relationships of affective and cognitive satisfaction on behavioural loyalty, attitudinal loyalty and word of mouth is expressed in a significantly different way.
Other works in the same study area of retail commerce analyse the causal effects of the antecedents of satisfaction or loyalty considering that the market is homogeneous and so segmenting it in order to identify differences (e.g. Theodoridis & Chatzipanagiotou, 2009). Unlike that methodological stream, our contribution focuses on the simultaneous study of consumer heterogeneity and the process of loyalty formation through satisfaction – both constructs from a multidimensional perspective, using latent modelling, a barely used methodology in recent research. Thus, the novelty and value of our work lies firstly, in the methodology used and secondly, in the causal relations studied: the relationship between affective and cognitive satisfaction and the relationship between both types of satisfaction and the main dimensions of loyalty (behaviour, attitude and recommendation).
At aggregated level (Table 4) it can be confirmed in general terms that customer satisfaction with the retail shop has a positive influence on loyalty. In particular, the results indicate that affective satisfaction influences not only cognitive satisfaction but also behavioural and attitudinal loyalty and word of mouth behaviour. Therefore, the importance of emotions in achieving satisfaction, repeat purchase, commitment with the shop and the diffusion of positive comments is confirmed (Gelbrich, 2011; Nesset et al., 2011). However, although cognitive satisfaction also influences behavioural loyalty and word of mouth, it does not contribute to the formation of attitudinal loyalty. That is, the cognitive assessment of the experience, based on compliance with expectations or the ideal shop, stimulates repeat shopping and recommendations to others, but lacks sufficient force to influence customer commitment and attitude to the shop. This lack of relationship between cognitive satisfaction and attitudinal loyalty suggests that affective satisfaction has a greater capacity than cognitive satisfaction to predict loyalty in all its dimensions. This result is in the line of research that questions the linearity and/or simplicity of the satisfaction–loyalty relationship (e.g. Kumar et al., 2013; Seiders et al., 2005). For example, in contrast to our result, in the work by Seiders et al. (2005) satisfaction has a positive effect on repeat shopping intentions and no effect on repeat shopping behaviour.
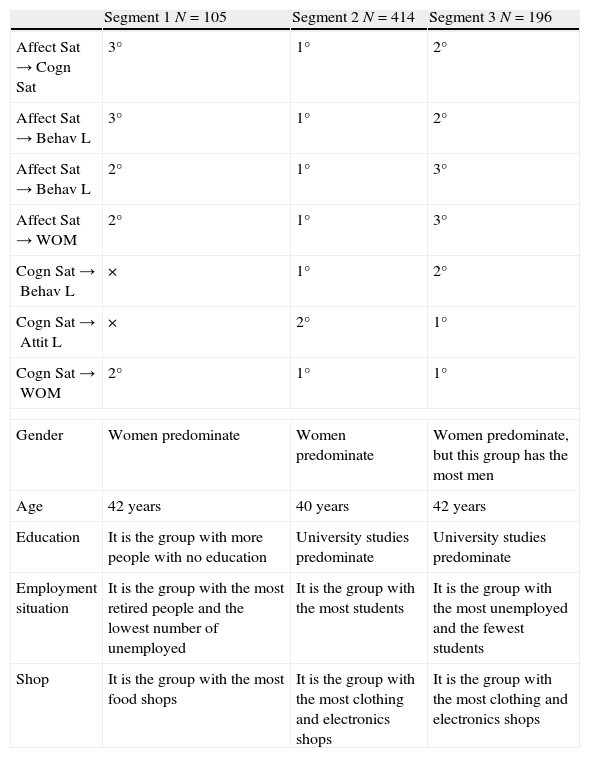
At segment level (Table 6) the results show the existence of three groups of customers with different intensity in the effect of affective satisfaction on cognitive satisfaction and in the effect of both satisfactions on the dimensions of loyalty (Fig. 1). In segment 1, the intensity of the relations is generally lower than in the other groups and there are causal relations that are not significant, namely, the effect of cognitive satisfaction on behavioural and attitudinal loyalty. Perhaps the fact that in this group over 45% of the consumers do their shopping in the food sector which means a type of routine shopping where expectations and the perception of the ideal shop is more or less constant, means that cognitive assessment of the experience does not contribute especially to repeat shopping or commitment and loyalty may depend more on how convenient the shop is (location, assortment, prices, etc.).
Summary of segment characteristics.
| Segment 1 N=105 | Segment 2 N=414 | Segment 3 N=196 | |
| Affect Sat→Cogn Sat | 3° | 1° | 2° |
| Affect Sat→Behav L | 3° | 1° | 2° |
| Affect Sat→Behav L | 2° | 1° | 3° |
| Affect Sat→WOM | 2° | 1° | 3° |
| Cogn Sat→Behav L | × | 1° | 2° |
| Cogn Sat→Attit L | × | 2° | 1° |
| Cogn Sat→WOM | 2° | 1° | 1° |
| Gender | Women predominate | Women predominate | Women predominate, but this group has the most men |
| Age | 42 years | 40 years | 42 years |
| Education | It is the group with more people with no education | University studies predominate | University studies predominate |
| Employment situation | It is the group with the most retired people and the lowest number of unemployed | It is the group with the most students | It is the group with the most unemployed and the fewest students |
| Shop | It is the group with the most food shops | It is the group with the most clothing and electronics shops | It is the group with the most clothing and electronics shops |
Segment 2 is the group with the strongest causal relations, followed by segment 3. In both cases, consumers have a level of university education, with fewer retired people, and over 50% of them have been shopping in the clothing and electronics sector.
Although there are no significant differences in the descriptive characteristics for these segments, these results indicate that in certain customers, namely in segment 1, there is no relationship between the cognitive assessment of the experience and their subsequent behaviours and attitudes, thereby adding to the above debate over the complex relation between satisfaction and loyalty (Kumar et al., 2013; Seiders et al., 2005; Verhoef, 2003; Verhoef et al., 2002). This fact highlights the need to study a disaggregated model focusing on different perceptions of customer satisfaction, showing that estimation bias can be avoided by considering the sample of customers as a whole.
From the practical perspective, this work has important implications for retail distribution management. Firstly, analysing the satisfaction–loyalty relationship is essential for assessing how and to what extent it is necessary to invest in customer satisfaction to improve loyalty (Kamakura, Mitta, De Rose, & Mazzon, 2002). If our results have revealed a greater capacity for affective satisfaction to create loyalty, managers should focus their marketing efforts on increasing positive emotions by selling experiences that are mainly affective.
Secondly, customer heterogeneity must be studied to understand the loyalty process. The identification of different segments in relation to the influence of satisfaction on loyalty is of particular interest for relationship marketing strategies at segment level, because it makes this approach more efficient and effective. In view of the fact that in some customers, cognitive satisfaction does not contribute to repeat visits or to their commitment towards the shop, managers must be aware of the need to increase satisfaction from a different approach, that is, using strategies adapted to customer profile, type of product, and type of shopping or experience. For example, if the shopping is routine, as in the case of food shops, efforts should focus on adding emotional elements, (trying out products, animation, smells, etc.) as they will have a key effect on loyalty responses. However, if the shopping is of a less frequent, more hedonic type, as in the case of clothing, household goods and electronics, the investment should be directed not only at generating emotions but also at improving assessment of the experience through product and service differentiation strategies (product quality, personalised service, complementary services, etc.).
In addition, although many retail distribution companies focus their efforts on improving satisfaction for all their customers in the same way, resources must be distributed efficiently to orient satisfaction and loyalty in the most profitable customers (Kumar, 2008; Kumar et al., 2013). Similarly, highly satisfied customers may show loyalty attitudes and behaviours that require action on the part of the shop oriented towards exceeding their expectations and emotions in order to keep their loyalty. And in the same way, for the customers who, despite being satisfied go less often to the shop and/or do not recommend it, strategies are needed to increase their perception of the improvement in services and superiority of the shop's offering in relation to its competitors.
A possible limitation of this work at conceptual level is that only satisfaction has been studied (although in both its dimensions) as an antecedent of loyalty. For that reason we propose the study of other interesting variables that may directly or indirectly influence loyalty, such as perceived value, switching costs or level of consumer involvement. Similarly, some moderating variables could be included in the model to detect differences in the satisfaction–loyalty relationship, such as type of purchase (frequent versus sporadic or utilitarian versus hedonic) or the type of establishment (franchises or branches versus independent shops). Secondly, the lack of significance in profile differences in relation to consumer sociodemographic characteristics and type of shop as objective bases, lead us to consider the use of subjective criteria that enable clearer identification of the most characteristic traits in the groups identified. In this regard, we propose including psychographic variables as they are stable over time and enable deeper understanding of consumer behaviour and motivations. Specifically, we consider it useful to use an adaptation of the LOV instrument (Kahle, 1983) to evaluate the importance consumers attach to personal values. It may also be relevant in the description of segments to address another series of behavioural variables (subjective and specific bases), such as convenience and entertainment, which match the benefits sought in shopping as well as consumer attitude.
On a methodological level, loyalty scales may be a limitation because of the small number of items. To improve measurement of this construct, we propose the use of a different behavioural loyalty scale to the one used in this work, whose reliability has been shown to be relatively acceptable. For example the measure in the work by Nesset et al. could be added (2011, p. 278) (“Out of the last 10 times that you have gone to a shop in this category, approximately how many times have you visited this shop?”), and even include items concerning loyalty behaviours other than repeat shopping, like the effect of price rises on shopping behaviour.
Finally, this study could be repeated in a different type of service context to examine shopping frequency and the degree of customer participation, for example in the field of tourism. Application to other sectors would help to verify whether the same differences between customers remain and explore more deeply market heterogeneity in the complex relationship between satisfaction and loyalty.
In short, through analysis of unobserved heterogeneity, our proposal contributes to this line of research with the aim of continuing to provide evidence of the unequal influence by segment of satisfaction on consumer loyalty to a retail establishment.
FundingThis research has received financial support from the Spanish Ministry of Science and Innovation (SEJ2010-17475/ECON and ECO2013-43353-R).
Conflict of interestThe authors declare no conflict of interest.
Despite defining two dimensions to measure word of mouth (action and content), the results of the factor analysis with maximum likelihood extraction and the criterion of eigenvalues greater than 1 showed that the six items clearly loaded on one factor, explaining 76.19% of the variance. This data was corroborated with estimation of a measurement model that took into account the two WOM dimensions. The fit indexes for said model (ChiSat-Bt.2 (g.l.=75)=514.34; RMSEA=0.074; CFI=0.969; GFI=0.918; AGFI=0.868) show that this estimation is worse than the fit for the measurement model that contemplates a single dimension for this construct.