


To analyse referrals from Primary Care consultation to Orthopaedic Surgery reference department. As a secondary objective, to establish 2 referral scenarios in order to determine the impact of variability on referral.
Material and methodsCross-sectional observational study, analyzing referrals from Primary Care to Orthopaedic Surgery during the first half of the years 2018, 2019, and 2021. The number of referrals issued by each doctor and each Primary Care Healthcare Center was examined, according to the classification of the different Basic Healthcare Zones.
ResultsThere is great variability in the number of referrals, both according to the type of Basic Healthcare Zone and by each Primary Care facultative. The referral ratios behaved uniformly over time (p<0.001). Due to a large number of referrals, 2 scenarios have been constructed: In the first scenario, the referral ratio would be in the middle of the referral rate spectrum. In the second scenario, the lowest referral ratios recorded have been taken as a reference. The reduction of variability in the 2 scenarios assumed provides a significant reduction in the demand for care.
ConclusionReducing variability would have a beneficial effect on the capacity of the Orthopaedic Surgery service to provide care.
Analizar las derivaciones dirigidas desde atención primaria a cirugía ortopédica y traumatología. Como objetivo secundario, establecer dos escenarios de derivación, con el fin de conocer el impacto de la variabilidad en la derivación.
Material y métodosEstudio observacional de carácter transversal de análisis de las derivaciones de atención primaria a cirugía ortopédica y traumatología durante el primer semestre de los años 2018, 2019 y 2021. Se ha examinado el número de derivaciones que emite cada facultativo y cada centro de salud de atención primaria, atendiendo a la clasificación de las distintas zonas básicas de salud.
ResultadosExiste una gran variabilidad en el número de derivaciones, tanto según el tipo de zona básica de salud (p<0,001) como por cada facultativo (p<0,001). Las ratios de derivación se comportan de forma uniforme en el tiempo (p<0,001). Debido al alto número de derivaciones, se han construido dos escenarios: en el primero de ellos la ratio de derivación se situaría en la zona media del espectro de la tasa de derivación. En el segundo escenario se han tomado como referencia las menores ratios de derivación registradas. La reducción de la variabilidad en los dos escenarios supuestos proporciona una disminución importante de la demanda asistencial.
ConclusionesLa reducción de la variabilidad tendría un efecto beneficioso sobre la capacidad asistencial del servicio de cirugía ortopédica y traumatología.
The care process involving the referral of patients from primary care (PC) to specialist care, and their return to PC, is what we call continuity of care.1 In the Spanish National Health System, the decision to refer patients from PC to specialist care is modulated by guidelines and protocols that, to some extent, condition this referral process, although ultimately it is down to the individual judgement of each PC physician. Healthcare management in PC has been extensively studied in terms of productive efficiency,2,3 but a larger-scale analysis of the continuity of care in traumatology and orthopaedic surgery (TOS) is still pending.
In a previous study,4 our group reported great variability in referral rates to TOS between health centres5 in the Salamanca Health Area. This variability could not be put down to epidemiological reasons. This means that the healthcare capacity, in the case of TOS, may be compromised in situations of high demand or limited resources, as it is one of the specialties that is most in demand.6–8 This variability may lead to dysfunction resulting in delays in the care of patients referred from PC.1
The purpose of the present study was to analyse referrals from PC to TOS, with special emphasis on referral rates and referral priority, and to compare them with the referral ratio to other specialist care services. The secondary objective, based on the values of the referral rate spectrum, was to construct 2 referral scenarios as a benchmark to improve the process of continuity of care.
Material and methodsWe designed a cross-sectional observational study. For the present study, all referrals from PC to TOS in the Salamanca Health Area during the first semester of 2018, 2019, and 2021 were analysed (Fig. 1 of the supplementary material), and the priority of the referral (routine, preferential, or urgent). The data for the first half of 20205 were analysed in a parallel study, given the bias caused by lockdown during the SARS-CoV-2 pandemic. Referrals to TOS from other specialist care and emergency departments were not included in this study. The data were obtained from the register of requests for TOS consultations from all health centres in the Salamanca Health Area. This register shows the centre from which the referral originated, the physician requesting the consultation, the priority (routine, preferential, and urgent) and the clinical reason reflected in the request.
We examined the number of referrals issued by each doctor and each health centre. We grouped the different basic health zones (BHA), according to the size of the population centre to which they provide health care, into rural (n=22), semi-urban (n=3), and urban (n=11) health centres. The Salamanca Health Area primary care management provided the population assigned to each centre and PC practitioner during the periods studied.
Referrals during the first half of 2019 to other specialist care services, such as cardiology, neurology, and general and digestive surgery, were also analysed to establish differences with respect to TOS.
The entire study was conducted in accordance with the Declaration of Helsinki, with the approval of the Ethics Committee for Research involving Medicines (CEIm) of the Salamanca Health Area (reference code: PI 2020 01 415).
RStudio v. 4.1.1 was used for the statistical analysis. Results are expressed as percentages, or mean and standard deviation, and 99.9% confidence interval (CI). The monthly referral ratio was calculated using the number of referrals divided by the number of patients assigned per 1000, divided by the number of months in which that physician was recorded as working in that health centre. The χ2 test was used for the differential analysis of qualitative analysis, adding the Bonferroni correction. The distribution of quantitative variables was assessed using the Kolmogorov–Smirnov test and these were compared using ANOVA and Student's t-test or non-parametric tests. Post hoc pairwise comparisons were also made using the Bonferroni method. Wilcoxon's rank-based test was used for the frequency trend analysis of referrals. In all cases, p≤.05 was considered statistically significant.
ResultsThere was a total of 6914 patient referrals to TOS from PC during the first half of 2018, which decreased to 6246 in 2019; in 2021 the total stood at 5664. This translates into an mean monthly patient referral per 1000 inhabitants of each Salamanca Health Area BHA of 3.25±1.70 in 2018, 3.30±1.83 in 2019, and 2.91±2.03 in 2021 (p=.040).
Regarding the characteristics of the population referred to TOS, the mean age of the patients referred over the 3 periods studied was 52.50±20.4 years, and 59.4% were women. The priority of the referrals analysed is summarised in Table 1. Bonferroni post hoc analysis revealed that the frequency of preferential and routine referrals was significantly higher in 2018 compared to 2019 (p<0.01) and 2021 (p<.001).
Priority of referral in the first half of 2018, 2019, and 2021, comparing by year and across years.
| 2018 | 2019 | 2021 | p (across groups) | |
|---|---|---|---|---|
| N=6914 | N=6246 | N=5662 | ||
| Priority of referral n (%) | ||||
| Routine | 4249 (61.5) | 4232 (67.8) | 3838 (67.8) | <.001 |
| Preferential | 2561 (37.0) | 1926 (30.8) | 1754 (31.0) | <.001 |
| Urgent | 104 (1.5) | 88 (1.4) | 72 (1.3) | .542 |
| p (intra-group) | <.001 | <.001 | <.001 | |
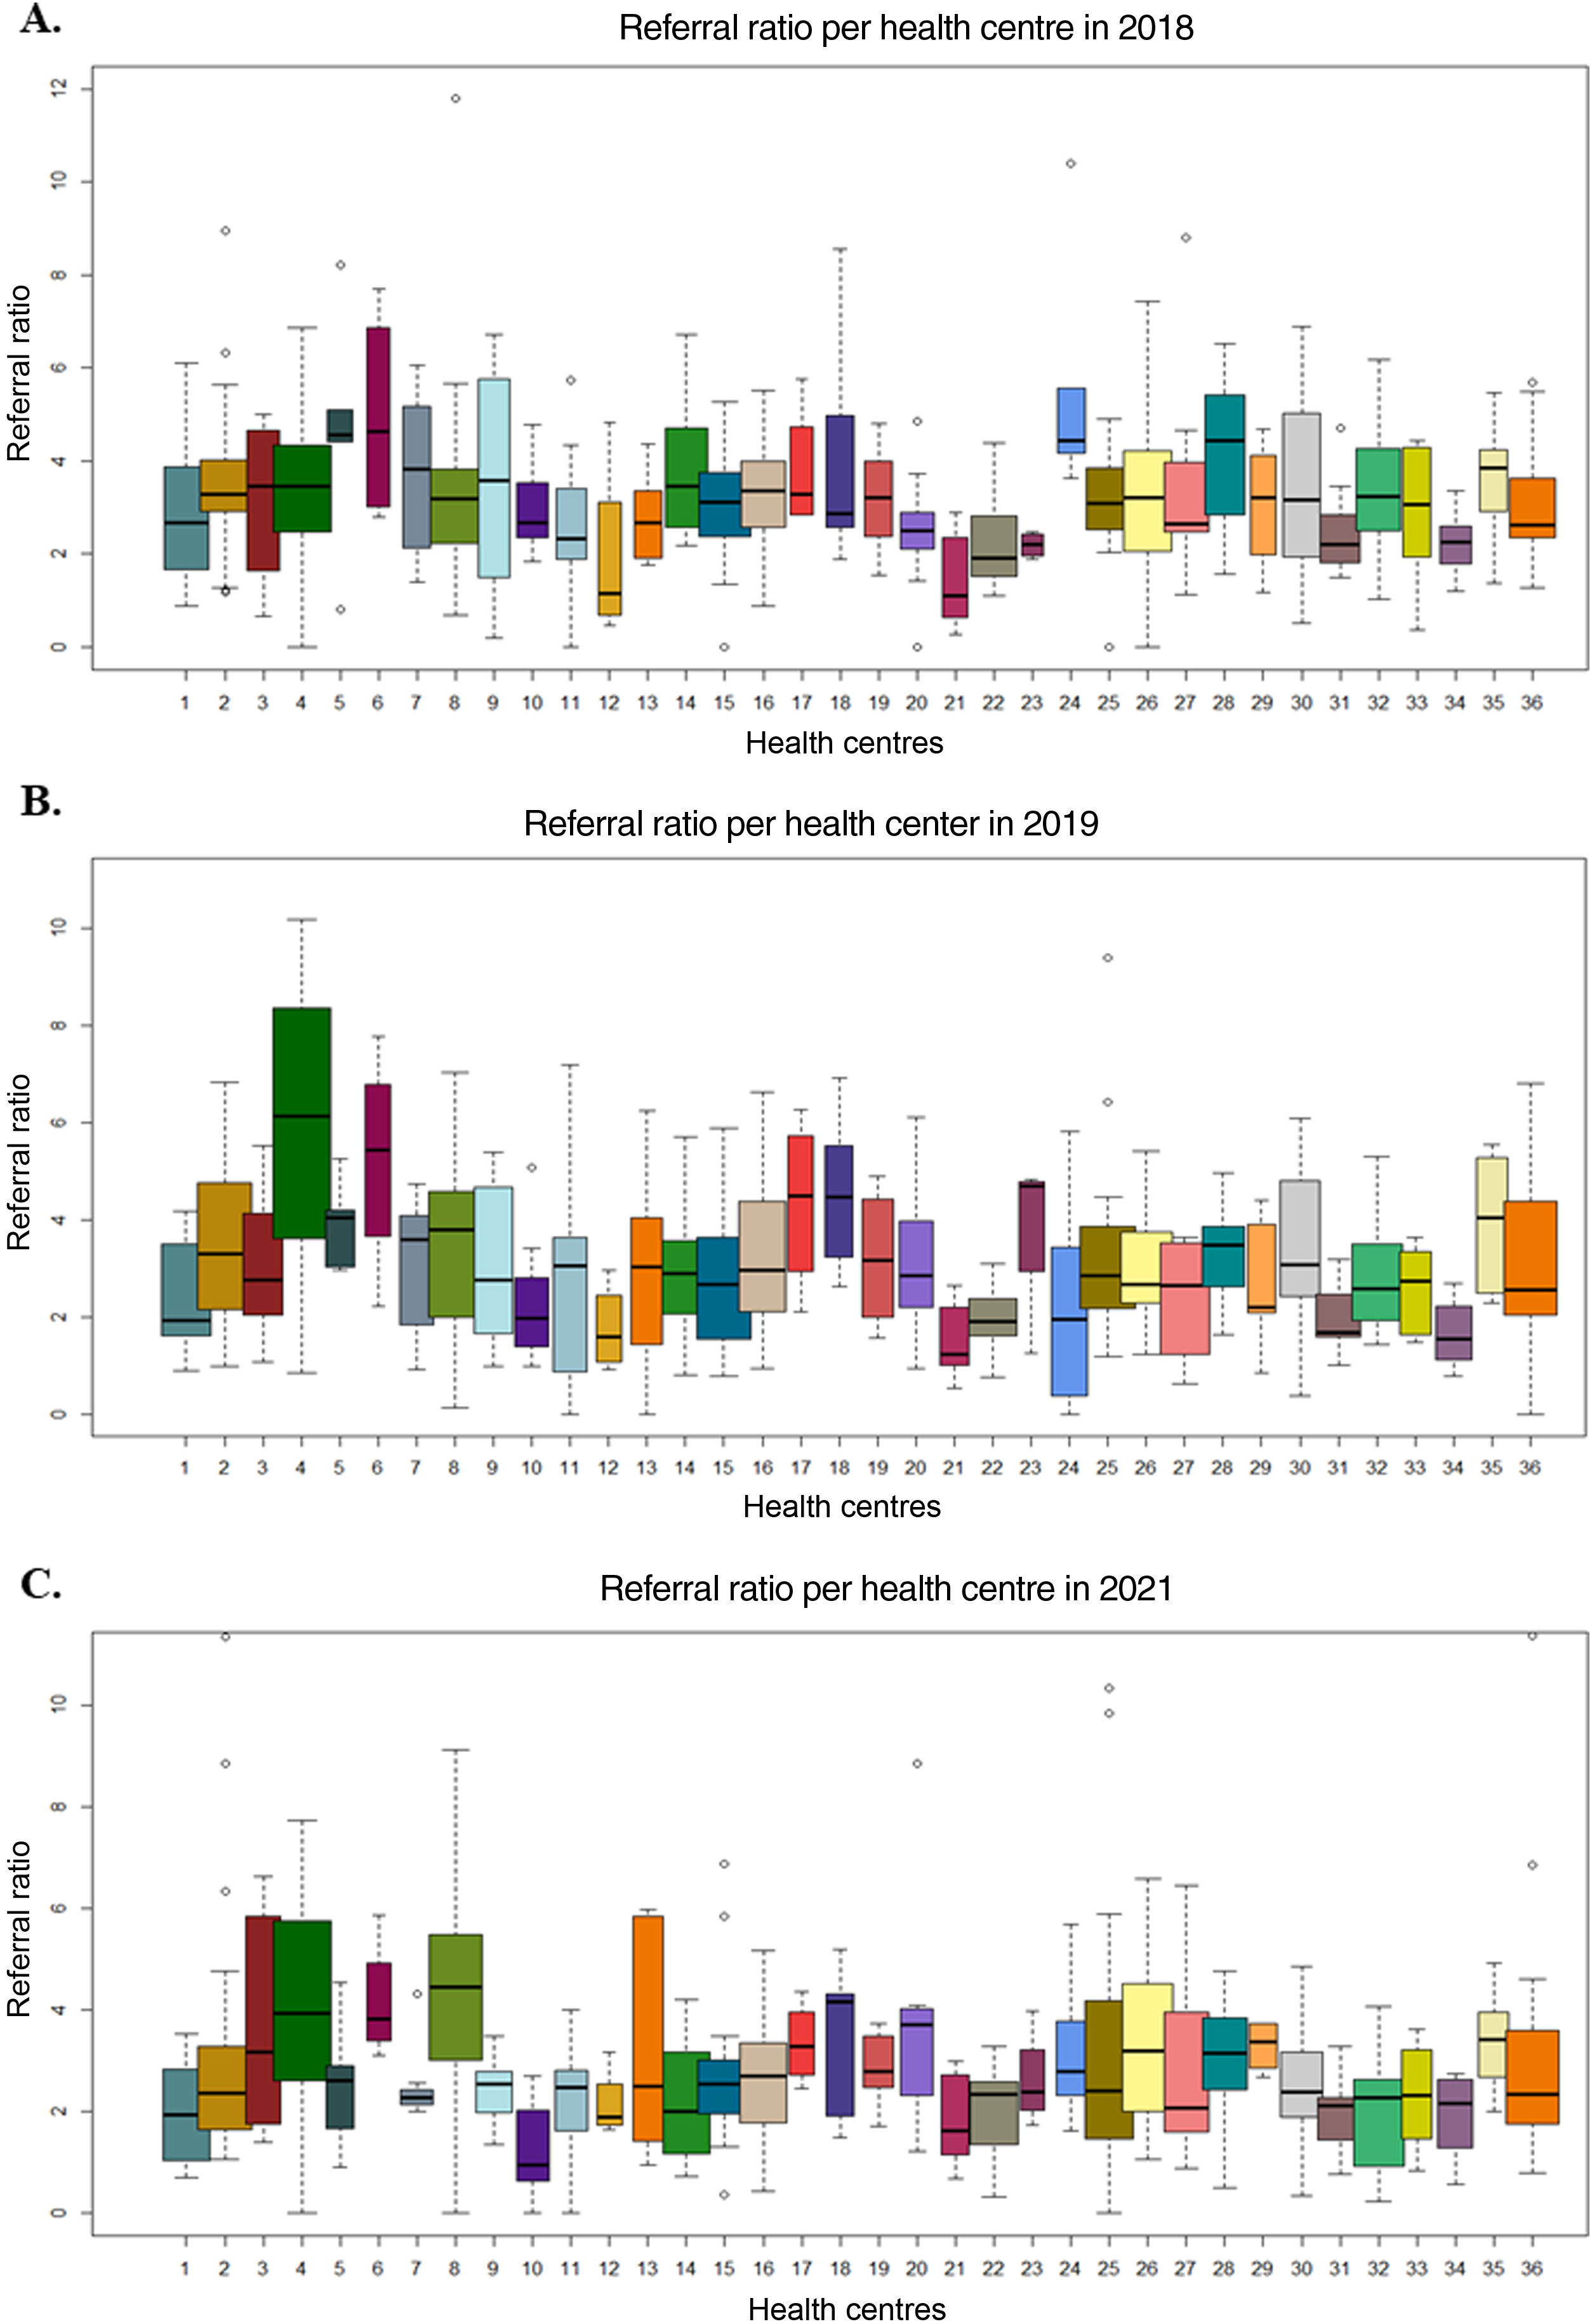
The mean monthly referral ratio of patients per 1000 inhabitants was homogeneously distributed among the different types of BHA in 2018 (p>.05), but not in 2019 (p<.001), or 2021 (p<.001) (Table 1 supplementary material). However, when analysing the mean referral ratio per health centre, regardless of the type of BHA, we found that in 2018 (Fig. 1A, p=.02) in 2019 (Fig. 1B, p<.001) and in 2021 (Fig. 1C, p<.001) there are statistically significant differences that show great variability, as their behaviour is heterogeneous over the 3 years (p<.001).
, 2019 (B), and 2021 (C).")
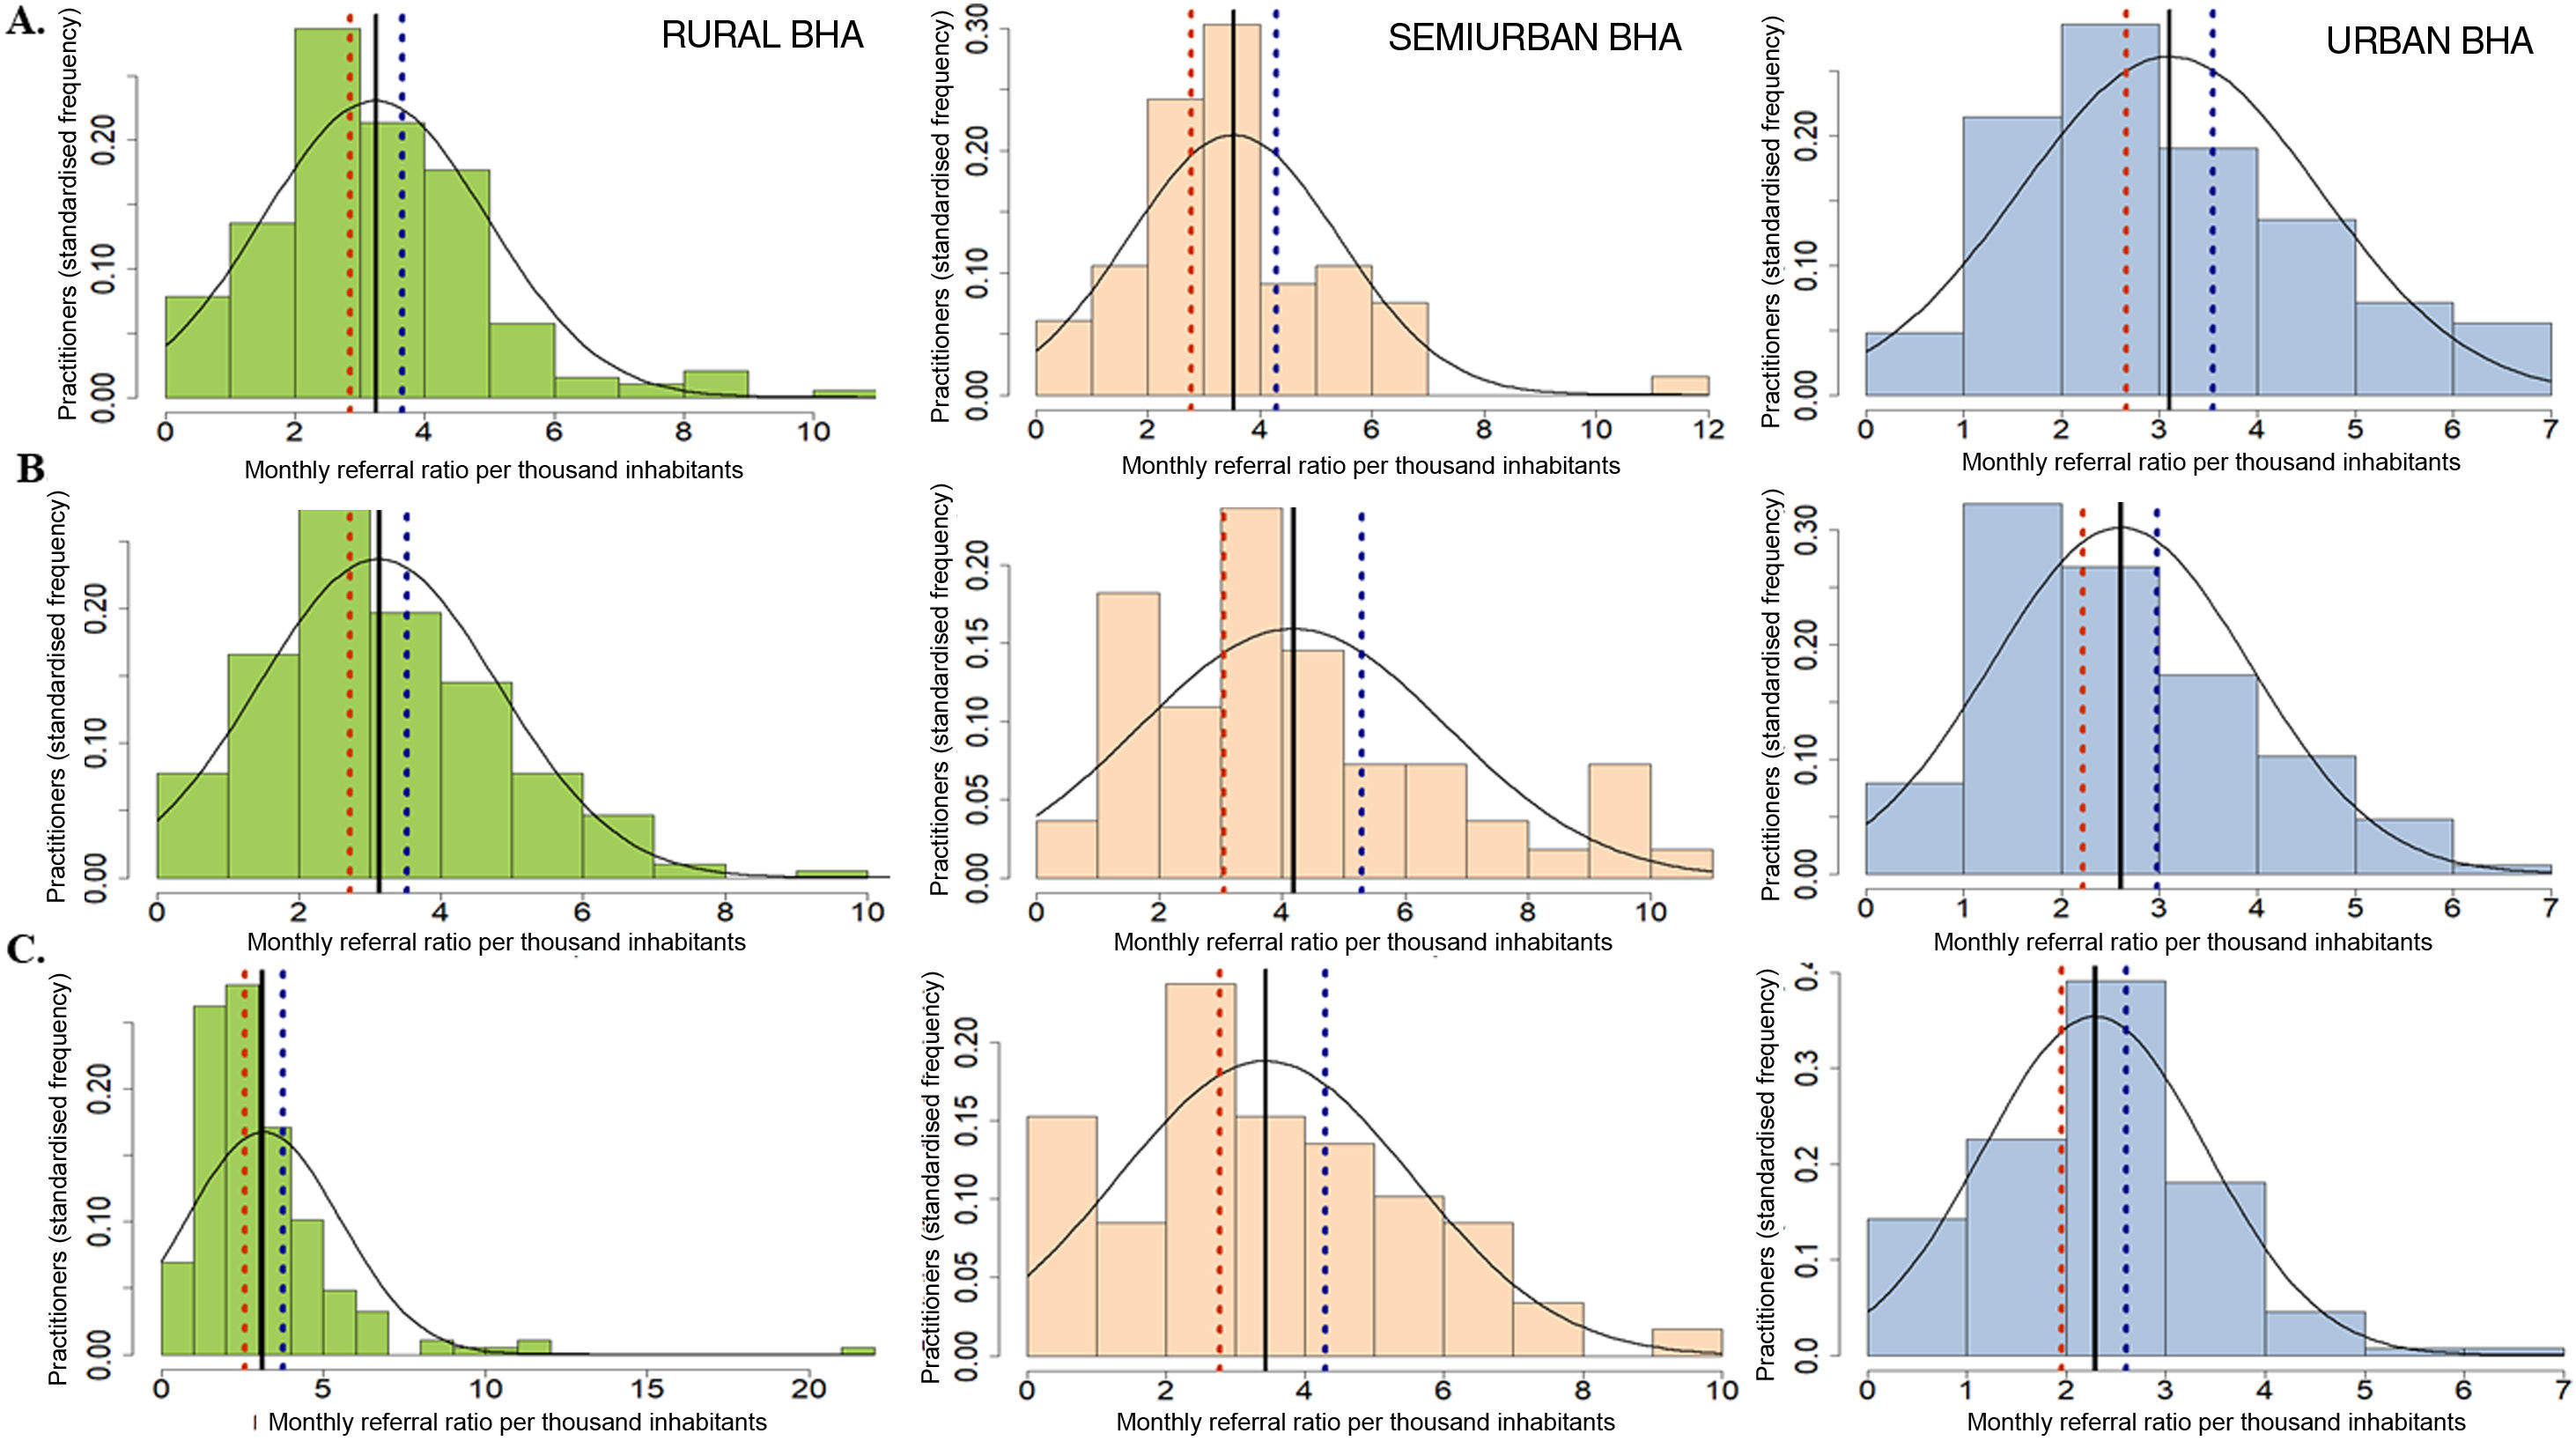
We found that this variability between the different types of BHA is not attributable to epidemiological factors such as sex, age of patients, or reason for referral (p>.05 in all cases). However, we found significant individual variability between referring PC physicians (p<.001). During the study period, referrals to TOS were made by 384 PC physicians in 2018, 378 in 2019, and 379 in 2021. The mean monthly referral ratio per 1000 population per physician was 3.25±1.69 in 2018, 3.30±1.83 in 2019, and 2.91±2.03 in 2021. The distribution of the monthly referral ratio per 1000 inhabitants per physician, distinguishing between the different types of BHA from which they originated, is shown in Fig. 2. We found that in 2018 the mean referral ratio per 1000 inhabitants of rural BHA was 3.24±1.73; in semi-urban BHA it was 3.53±1.87, and in urban BHA it was 3.11±1.53 (Fig. 2A). In 2019 the mean referral ratio per 1000 inhabitants in rural BHA was 3.12±1.69, in semi-urban BHA it was 4.18±2.51, and in urban BHA it was 2.60±1.32 (Fig. 2B). Finally, in 2021 the mean referral ratio in rural BHA was 3.16±2.38, in semi-urban BHA 3.49±2.09, and in urban BHA 2.28±1.13 (Fig. 2C). The great heterogeneity in the behaviour of referring physicians was maintained through 2021: while 41.0% presented referral ratios below the lower limit of the 99.9% CI of the mean (1.62±.63), 29.9% showed referral ratios three times as high (4.96±1.51), regardless of their type of BHA. If we analyse in depth the trend in the frequency of referral of the physicians above the 90th percentile of the monthly referral ratio, i.e., the physicians with the highest referral ratio, we find that the PC physicians who refer the most patients per month to TOS are repeated throughout the study (p<.001). Given the large number of physicians above the upper limit of the 99.9% CI of the mean referral ratio per 1000 inhabitants (Fig. 2 blue dashed line), we considered remodelling the distribution of the referral ratio per physician, adjusting it to values considered reasonable, i.e., reducing the number of referrals of the physicians who refer the most.
, according to the demographic classification of the basic health area of origin, in the first half of 2018 (A), 2019 (B), and 2021 (C). From left to right: rural BHA (green); semiurban BHA (orange); urban BHA (blue).")
Monthly referral ratio per 1000 inhabitants of primary care physicians (standardised frequency histogram), according to the demographic classification of the basic health area of origin, in the first half of 2018 (A), 2019 (B), and 2021 (C). From left to right: rural BHA (green); semiurban BHA (orange); urban BHA (blue).
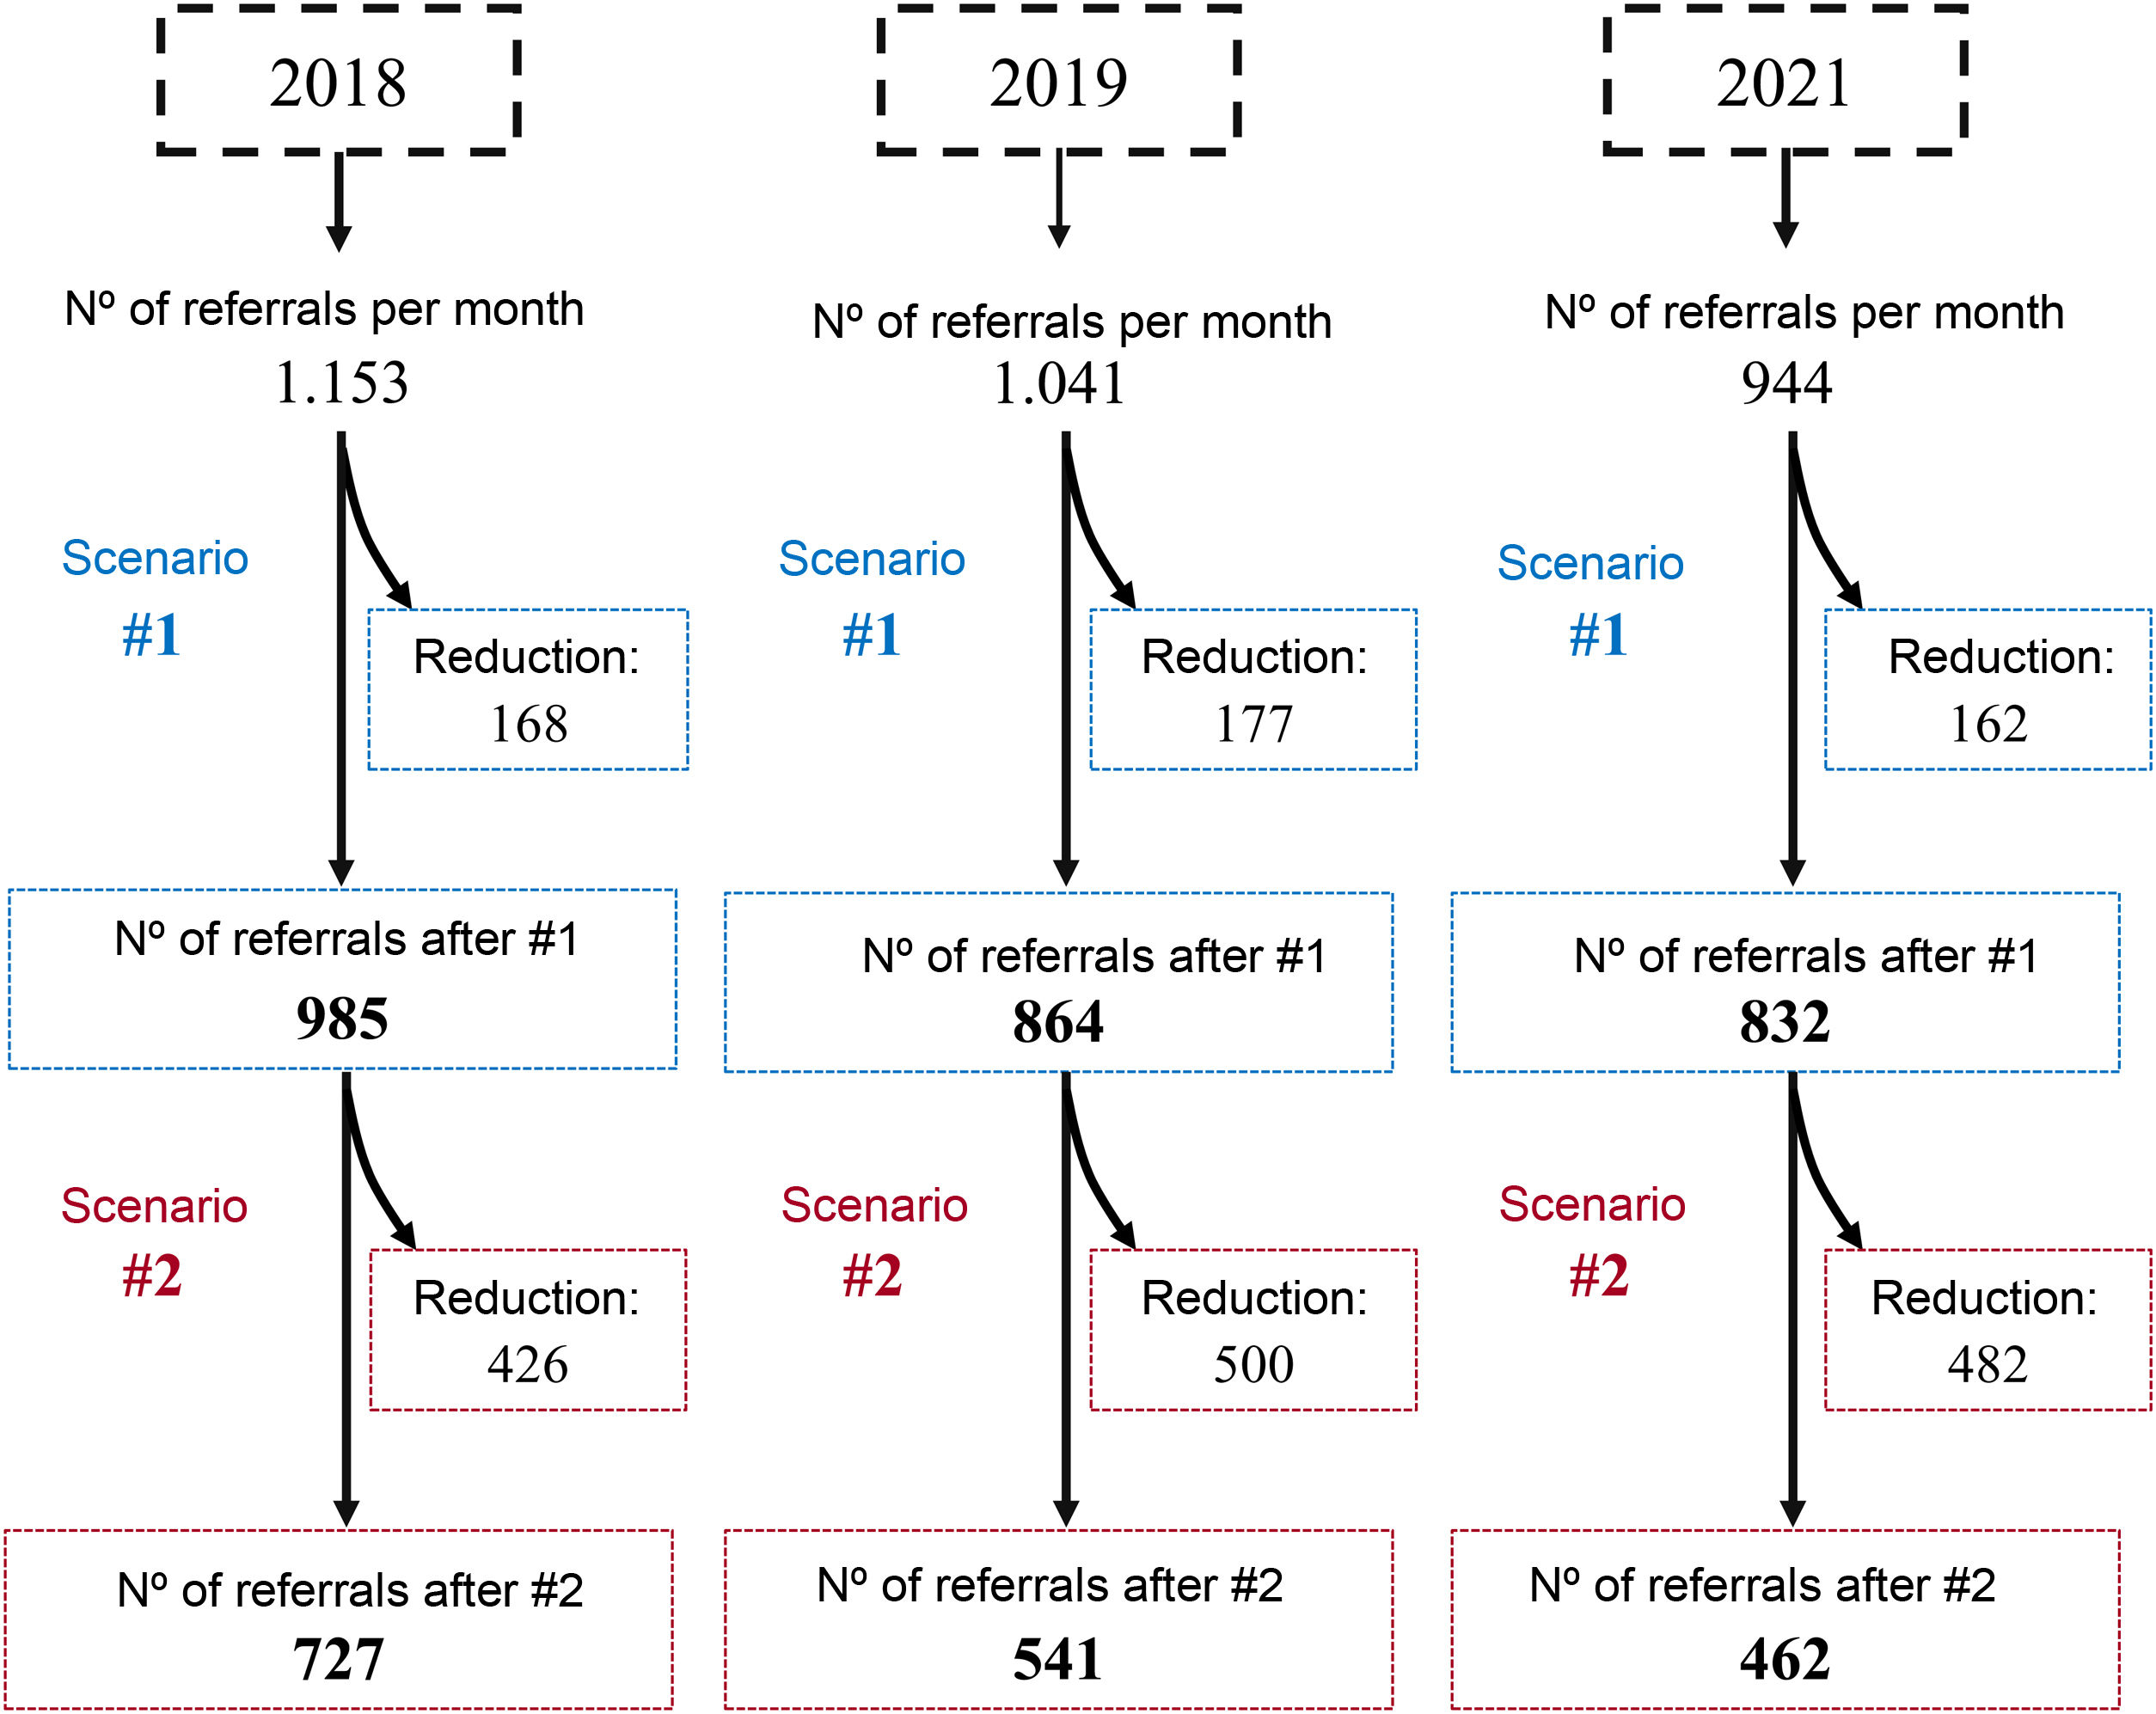
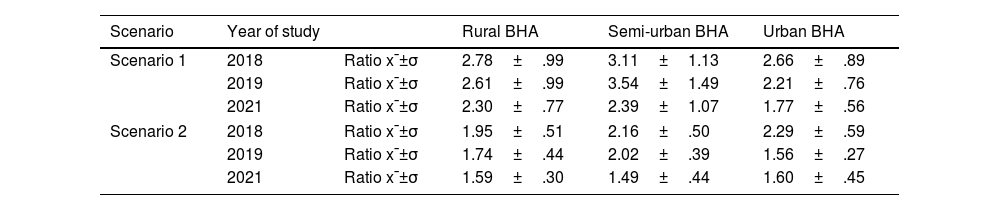
Thus, we constructed scenario 1, in which we adjusted the referral ratio of physicians exceeding the upper limit of the 99.9% CI of the mean to this same interval (Fig. 2, blue dashed line). This would mean decreasing the monthly referral rate in 2018 from 69 physicians in rural BHA, 18 in semi-urban BHA, and 40 in urban BHA (Fig. 2A); in 2019 the monthly referral rate would have been reduced for 72 physicians in rural BHA, for 15 physicians in semi-urban BHA, and for 42 physicians in urban BHA (Fig. 2B); in 2021 the monthly referral rate would have been reduced for 48 physicians in rural BHA, for 18 physicians in semi-urban BHA, and for 47 physicians in urban BHA (Fig. 2C). In this scenario 1 we obtain a new mean referral ratio (Table 2, scenario 1). Similarly, this scenario 1 would imply a reduction of 168 referrals per month (14.7%) in 2018, 177 referrals per month (16.0%) in 2019, and 162 referrals per month (12.8%) in 2021.
Adjusted mean referral ratio per 1000 inhabitants, where scenario 1 and scenario 2 have been applied, according to the classification of the health area's basic health zones in the first half of 2018, 2019, and 2021.
| Scenario | Year of study | Rural BHA | Semi-urban BHA | Urban BHA | |
|---|---|---|---|---|---|
| Scenario 1 | 2018 | Ratio x¯±σ | 2.78±.99 | 3.11±1.13 | 2.66±.89 |
| 2019 | Ratio x¯±σ | 2.61±.99 | 3.54±1.49 | 2.21±.76 | |
| 2021 | Ratio x¯±σ | 2.30±.77 | 2.39±1.07 | 1.77±.56 | |
| Scenario 2 | 2018 | Ratio x¯±σ | 1.95±.51 | 2.16±.50 | 2.29±.59 |
| 2019 | Ratio x¯±σ | 1.74±.44 | 2.02±.39 | 1.56±.27 | |
| 2021 | Ratio x¯±σ | 1.59±.30 | 1.49±.44 | 1.60±.45 | |
The mean referral ratio is expressed as mean±standard deviation x¯±σ.
Following this methodology, we propose scenario 2, in which the referral ratio per physician is adjusted to the lower limit of the 99.9% CI of the mean referral ratio per 1000 inhabitants (Fig. 2, orange dashed line). This would decrease the monthly referral rate of 145 physicians in rural BHA, 49 physicians in semi-urban BHA, and 67 physicians in urban BHA in 2018; in 2019 the monthly referral rate would have been reduced for 88 physicians in rural BHA, for 18 physicians in semi-urban BHA, and for 61 physicians in urban BHA; and in 2021 the monthly referral rate would have been reduced for 142 physicians in rural BHA, for 47 physicians in semi-urban BHA, and for 94 physicians in urban BHA. We obtain a new mean referral ratio, shown in Table 2 (scenario 2). Similarly, this scenario 2 would imply a reduction of 426 referrals per month (37.2%) in 2018, 500 referrals per month (45.2%) in 2019, and 482 referrals per month (38.3%) in 2021.
We also analysed the monthly referral ratio of patients per 1000 inhabitants to other specialties (cardiology, neurology, general and digestive system surgery) in the Salamanca Health Area. We found that, once again, the trend in the frequency of referral per physician does not follow a random pattern, but rather that the physicians who refer the most patients to TOS are also among the physicians who refer the most patients to other specialties (cardiology: ∩ 32.4% with p<.001; neurology: ∩ 24.3% with p <.001; general surgery: ∩ 35.2% with p<.001, and digestive system: ∩ 18.9% with p=.02). This confirms the importance of the individual factor in the variability of referrals.
DiscussionThe present study gives an analysis of the origin of a total of 18,824 referrals made from PC to TOS in the Salamanca Health Area during the first half of 2018, 2019, and 2021, which represents more than 5% of the population of the Salamanca Health Area over the study period.9 The year 2020 was excluded from the study due to the exceptional epidemiological situation, although we have included data relating to 2021, when some of the restrictions were maintained. In 2021 (first semester) there was a decrease in the total number of referrals, which we consider to be influenced by the epidemiological situation and the persistence of face-to-face care in the health centres. On 24 May 2021, the return to face-to-face care was ordered and protocols were established for face-to-face consultations in health centres throughout Spain; on 25 May, this decree began to be implemented in all of them.
Throughout the period analysed, we found a great variability in the referral ratio between the different types of BHA, and between the physicians working in them, confirming that there is great heterogeneity. This variability in referrals is not due to epidemiological issues (such as sex, age, or reason), but to the individual judgement of the physician. Furthermore, although the demand for the TOS service is high, when we analyse referrals to other hospital services, we see that the physicians who refer the most patients to TOS coincide with those who refer the most to other services. Therefore, this referral trend is not random, but will always be conditioned by individual criteria, which is maintained uniformly over time.
Gender variability has also been observed between the general population (around 50% women)10 and the population of patients referred from PC to TOS, possibly because the female gender is more frequently affected11 by some pathological processes which are the reason for referral, such as osteoarthritis and osteoporosis.12–15
From analysis of the priority of the referral to TOS, we deduce that it behaves independently throughout the study period. The number of routine and preferential referrals vary from year to year, while only urgent referrals remain stable over the years. Nevertheless, preferential referrals represent a very high percentage, according to data from the Centre for Analysis and Treatment of Healthcare Information (CATIA) of the SACYL: in the first half of 2021 there were a total of 36,217 routine referrals and 11,139 preferential referrals, of which 15.7% correspond to TOS. This makes us consider the excess demand for preferential consultations which, perhaps, are not due to clinical reasons but potential delay in care provided in TOS. In a previous study, we found that only 7.8% of the 30.7% preferential referrals were for preferential clinical reasons.4
A series of protocols were implemented in 2018 for the referral of patients with low back pain, neck pain, and painful shoulder. Although the data collected cannot accurately establish the direct effects of implementing these protocols, they do not appear to have had a major impact on the health centres making the most referrals. The human and material resources of public health systems are limited, and therefore their efficient use is fundamental to maintaining their sustainability. Thus, improving the criteria for patient referral from PC could lead to a reduction in the number of consultations required to meet this care demand and, in turn, would allow resources to be allocated to other care activities, such as surgery,16 where waiting times distort the quality indicators of the National Health System.17
Therefore, we created 2 scenarios of a decrease in the number of referrals and considered the consequences of these scenarios based on the values of the referral rate spectrum. The first scenario takes the mid zone of the referral rate spectrum as a benchmark. In the second scenario, our benchmark is the ideal values that correspond to the lowest recorded referral rates. Both scenarios result in a reduction in the referral ratio. If these models could be achieved, waiting times in consultations could be reduced since, for example, in the first scenario we would have 8 consultations per month to bring forward appointments or we could dedicate those 8 doctors to surgical activity. In the second scenario, which is certainly an ideal scenario, the reduction in waiting times would be very significant (Fig. 3).

In view of these findings, it is essential to introduce tools and objective criteria for assessing referrals, and to instil in the physicians making the most referrals the need to reduce their referral ratio, taking as the benchmark ratios of physicians who make reasonable or even low referrals. This would improve the continuity of care process, not only in the direction of referrals from primary care to TOS but also in the response from the hospital service.
Our study is not without limitations, however. Firstly, the data we report refer to a specific context in the Salamanca Health Area, therefore studies at national level would be necessary to extrapolate the scenarios presented here. Likewise, we have not analysed the specific context of the health centres, training plans, clinical sessions, or to hospital service accessibility, which could partly explain the variability between centres.
ConclusionThere is great variability in the referral of patients from PC to TOS, which is largely conditioned by an individual factor or criterion. We find similar findings when we analyse referrals to other hospital services.
The decrease in variability shown in the 2 scenarios considered would imply a decrease in the demand for care that should improve the efficiency of TOS services.
Level of evidenceLevel of evidence ii.
FundingNo specific support from public sector agencies, commercial sector or not-for-profit organisations was received for this research study.
Conflict of interestsThe authors declare they have no conflict of interest.
The following are the supplementary data to this article:
